> ## Documentation Index
> Fetch the complete documentation index at: https://docs.0xarchive.io/llms.txt
> Use this file to discover all available pages before exploring further.
# Anchored VWAP bands
> VWAP and deviation bands from a moment picked on the chart.
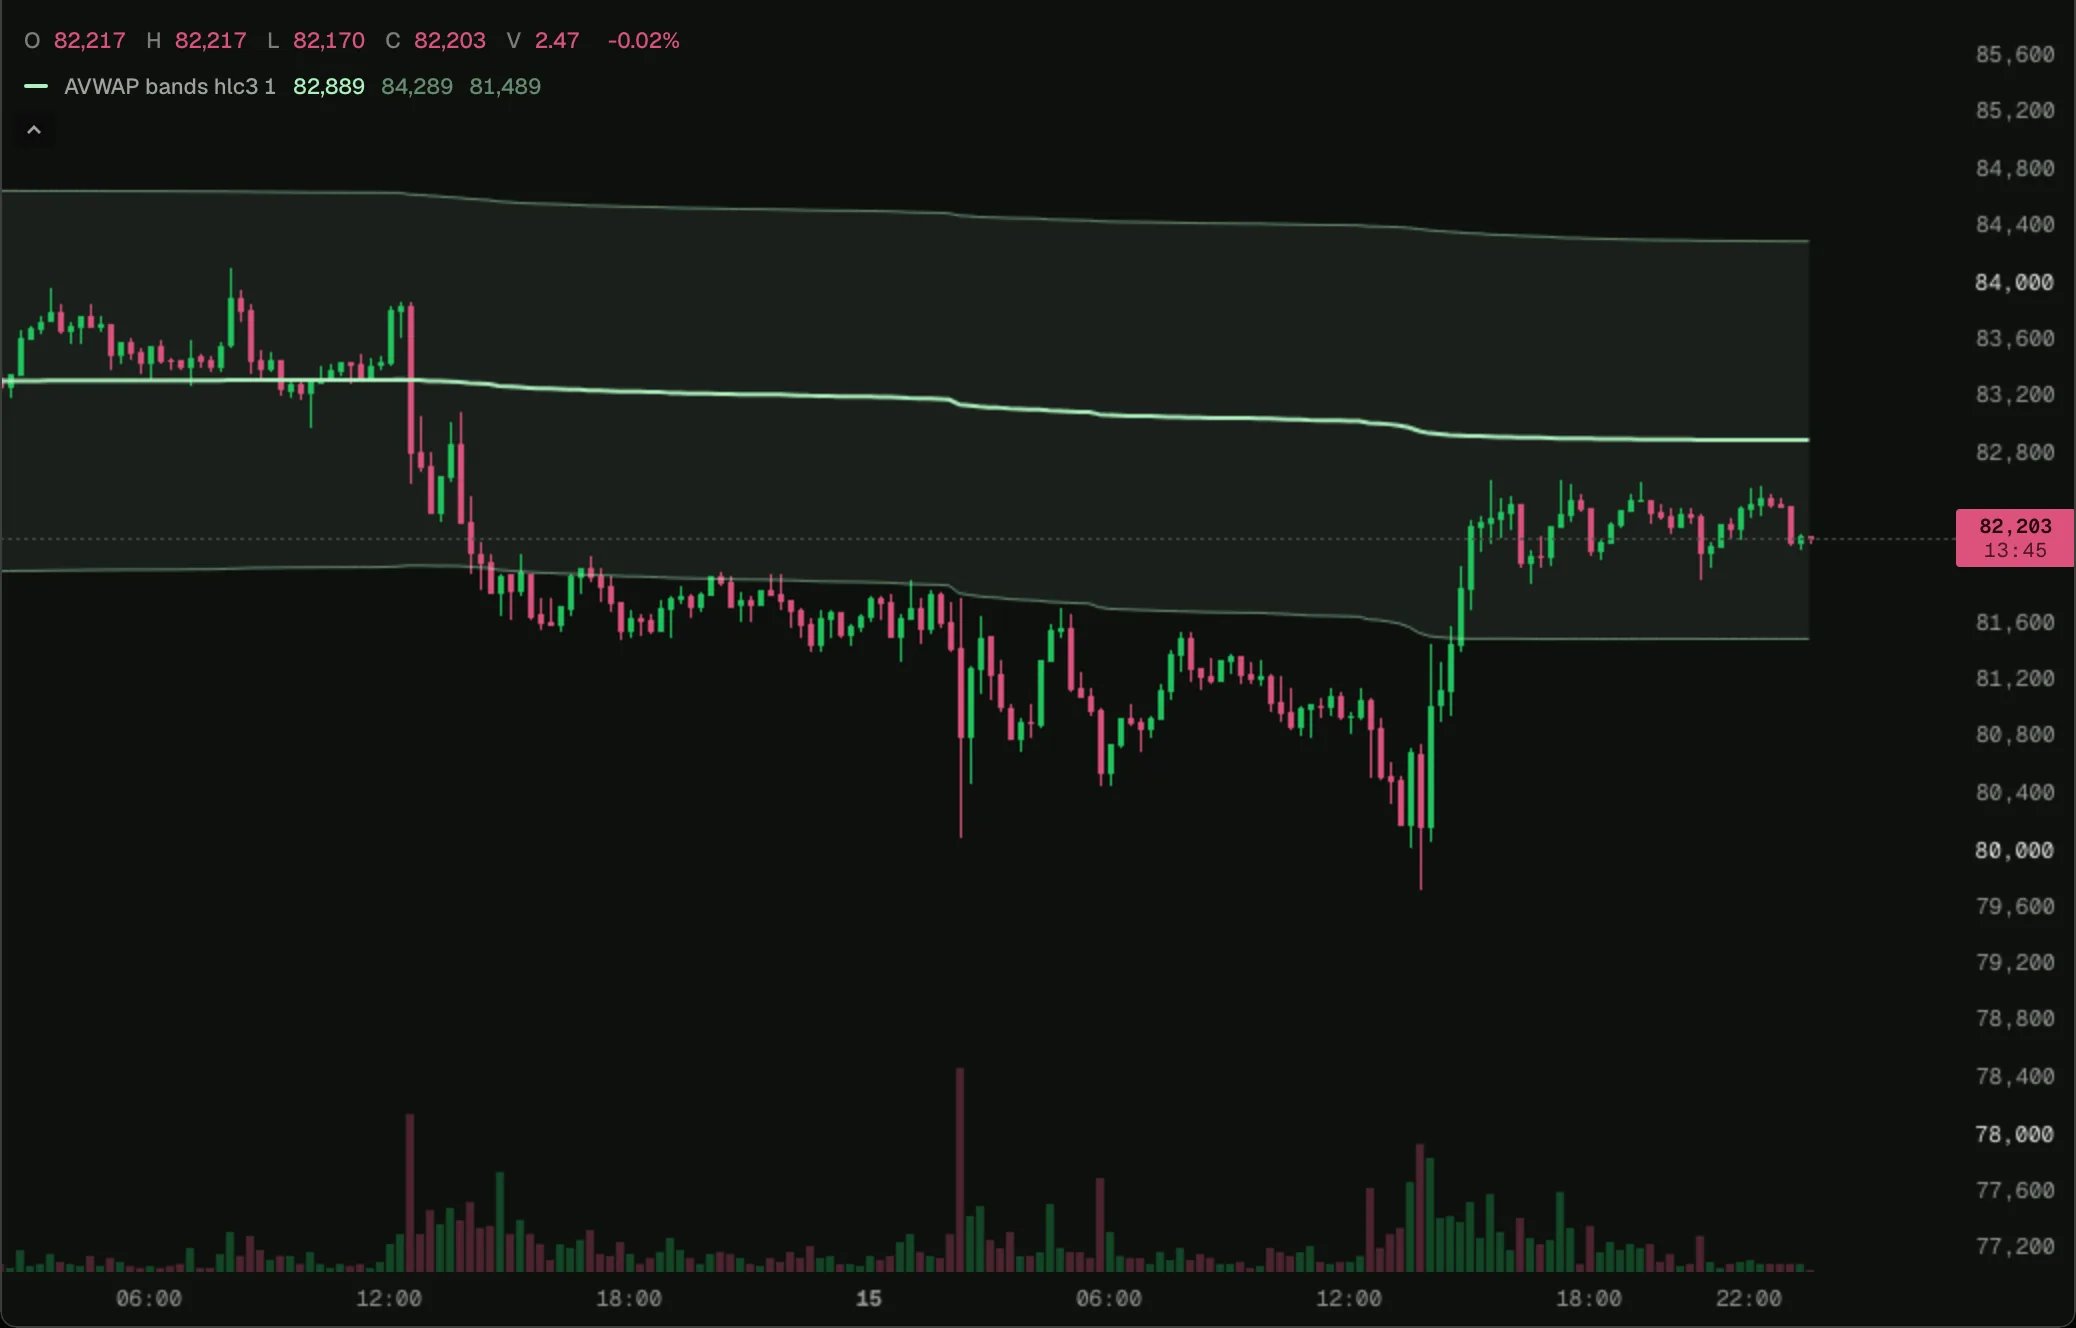 Load it on BTC 15m in the terminal, then change its settings or open it in the script editor.
A volume-weighted average price from a moment you pick, with bands a chosen number of volume-weighted standard deviations either side. In the settings, press **Pick on chart** and click a bar; until then it starts at the first loaded bar.
## How it works
`input.time` is an input set by clicking the chart. The running sums are [`state.bar`](/terminal/guides/state#state) cells. `plot.fill` shades between the two band lines, and a `labelUp` shape marks the anchor.
## The script
```ts anchored-vwap.ts theme={"theme":"github-dark"}
// VWAP from a moment picked on the chart: in the settings, press "Pick on chart" and click the
// bar to start from. Until one is picked it starts at the first loaded bar. The bands sit a
// chosen number of volume-weighted standard deviations either side, as TradingView's anchored
// VWAP draws them, and a label marks the anchor.
indicator('Anchored VWAP bands', { shortName: 'AVWAP bands', overlay: true });
const anchor = input.time('Anchor', null);
const source = input.source('Source', 'hlc3');
const width = input.float('Bands (deviations)', 1, { min: 0.5, max: 3, step: 0.5 });
const note = input.string('Anchor label', 'Anchor');
const chart = bars();
const volume = state.bar(0);
const weighted = state.bar(0);
const squares = state.bar(0);
const tone = color.study(3);
const vwap = plot.line('VWAP', { width: 2, color: tone });
const upper = plot.line('Upper band', { color: color.withAlpha(tone, 0.55) });
const lower = plot.line('Lower band', { color: color.withAlpha(tone, 0.55) });
const band = plot.fill('Band', upper, lower, { color: color.withAlpha(tone, 0.07) });
const start = plot.shape('Anchor', { shape: 'labelUp', location: 'below', color: tone, text: note });
chart.onBar(() => {
if (anchor !== null && chart.time < anchor) return;
const first = volume.value === 0;
const price = chart.source(source);
// A bar with no volume yet (a minute with no trades, or one just opened) adds nothing and keeps the VWAP.
const traded = isNa(price) ? 0 : nz(chart.volume);
if (traded > 0) {
volume.value += traded;
weighted.value += price * traded;
squares.value += price * price * traded;
}
if (volume.value === 0) return;
const mean = weighted.value / volume.value;
const deviation = Math.sqrt(Math.max(0, squares.value / volume.value - mean * mean));
vwap.set(mean);
upper.set(mean + width * deviation);
lower.set(mean - width * deviation);
start.set(first);
});
```
## Next step
See the next example, [Open bands](/terminal/examples/open-bands).
This documentation is built and hosted on [Mintlify](https://mintlify.com), a developer documentation platform.
Load it on BTC 15m in the terminal, then change its settings or open it in the script editor.
A volume-weighted average price from a moment you pick, with bands a chosen number of volume-weighted standard deviations either side. In the settings, press **Pick on chart** and click a bar; until then it starts at the first loaded bar.
## How it works
`input.time` is an input set by clicking the chart. The running sums are [`state.bar`](/terminal/guides/state#state) cells. `plot.fill` shades between the two band lines, and a `labelUp` shape marks the anchor.
## The script
```ts anchored-vwap.ts theme={"theme":"github-dark"}
// VWAP from a moment picked on the chart: in the settings, press "Pick on chart" and click the
// bar to start from. Until one is picked it starts at the first loaded bar. The bands sit a
// chosen number of volume-weighted standard deviations either side, as TradingView's anchored
// VWAP draws them, and a label marks the anchor.
indicator('Anchored VWAP bands', { shortName: 'AVWAP bands', overlay: true });
const anchor = input.time('Anchor', null);
const source = input.source('Source', 'hlc3');
const width = input.float('Bands (deviations)', 1, { min: 0.5, max: 3, step: 0.5 });
const note = input.string('Anchor label', 'Anchor');
const chart = bars();
const volume = state.bar(0);
const weighted = state.bar(0);
const squares = state.bar(0);
const tone = color.study(3);
const vwap = plot.line('VWAP', { width: 2, color: tone });
const upper = plot.line('Upper band', { color: color.withAlpha(tone, 0.55) });
const lower = plot.line('Lower band', { color: color.withAlpha(tone, 0.55) });
const band = plot.fill('Band', upper, lower, { color: color.withAlpha(tone, 0.07) });
const start = plot.shape('Anchor', { shape: 'labelUp', location: 'below', color: tone, text: note });
chart.onBar(() => {
if (anchor !== null && chart.time < anchor) return;
const first = volume.value === 0;
const price = chart.source(source);
// A bar with no volume yet (a minute with no trades, or one just opened) adds nothing and keeps the VWAP.
const traded = isNa(price) ? 0 : nz(chart.volume);
if (traded > 0) {
volume.value += traded;
weighted.value += price * traded;
squares.value += price * price * traded;
}
if (volume.value === 0) return;
const mean = weighted.value / volume.value;
const deviation = Math.sqrt(Math.max(0, squares.value / volume.value - mean * mean));
vwap.set(mean);
upper.set(mean + width * deviation);
lower.set(mean - width * deviation);
start.set(first);
});
```
## Next step
See the next example, [Open bands](/terminal/examples/open-bands).
This documentation is built and hosted on [Mintlify](https://mintlify.com), a developer documentation platform.