> ## Documentation Index
> Fetch the complete documentation index at: https://docs.0xarchive.io/llms.txt
> Use this file to discover all available pages before exploring further.
# EMA
> An exponential moving average, seeded the way TradingView seeds it.
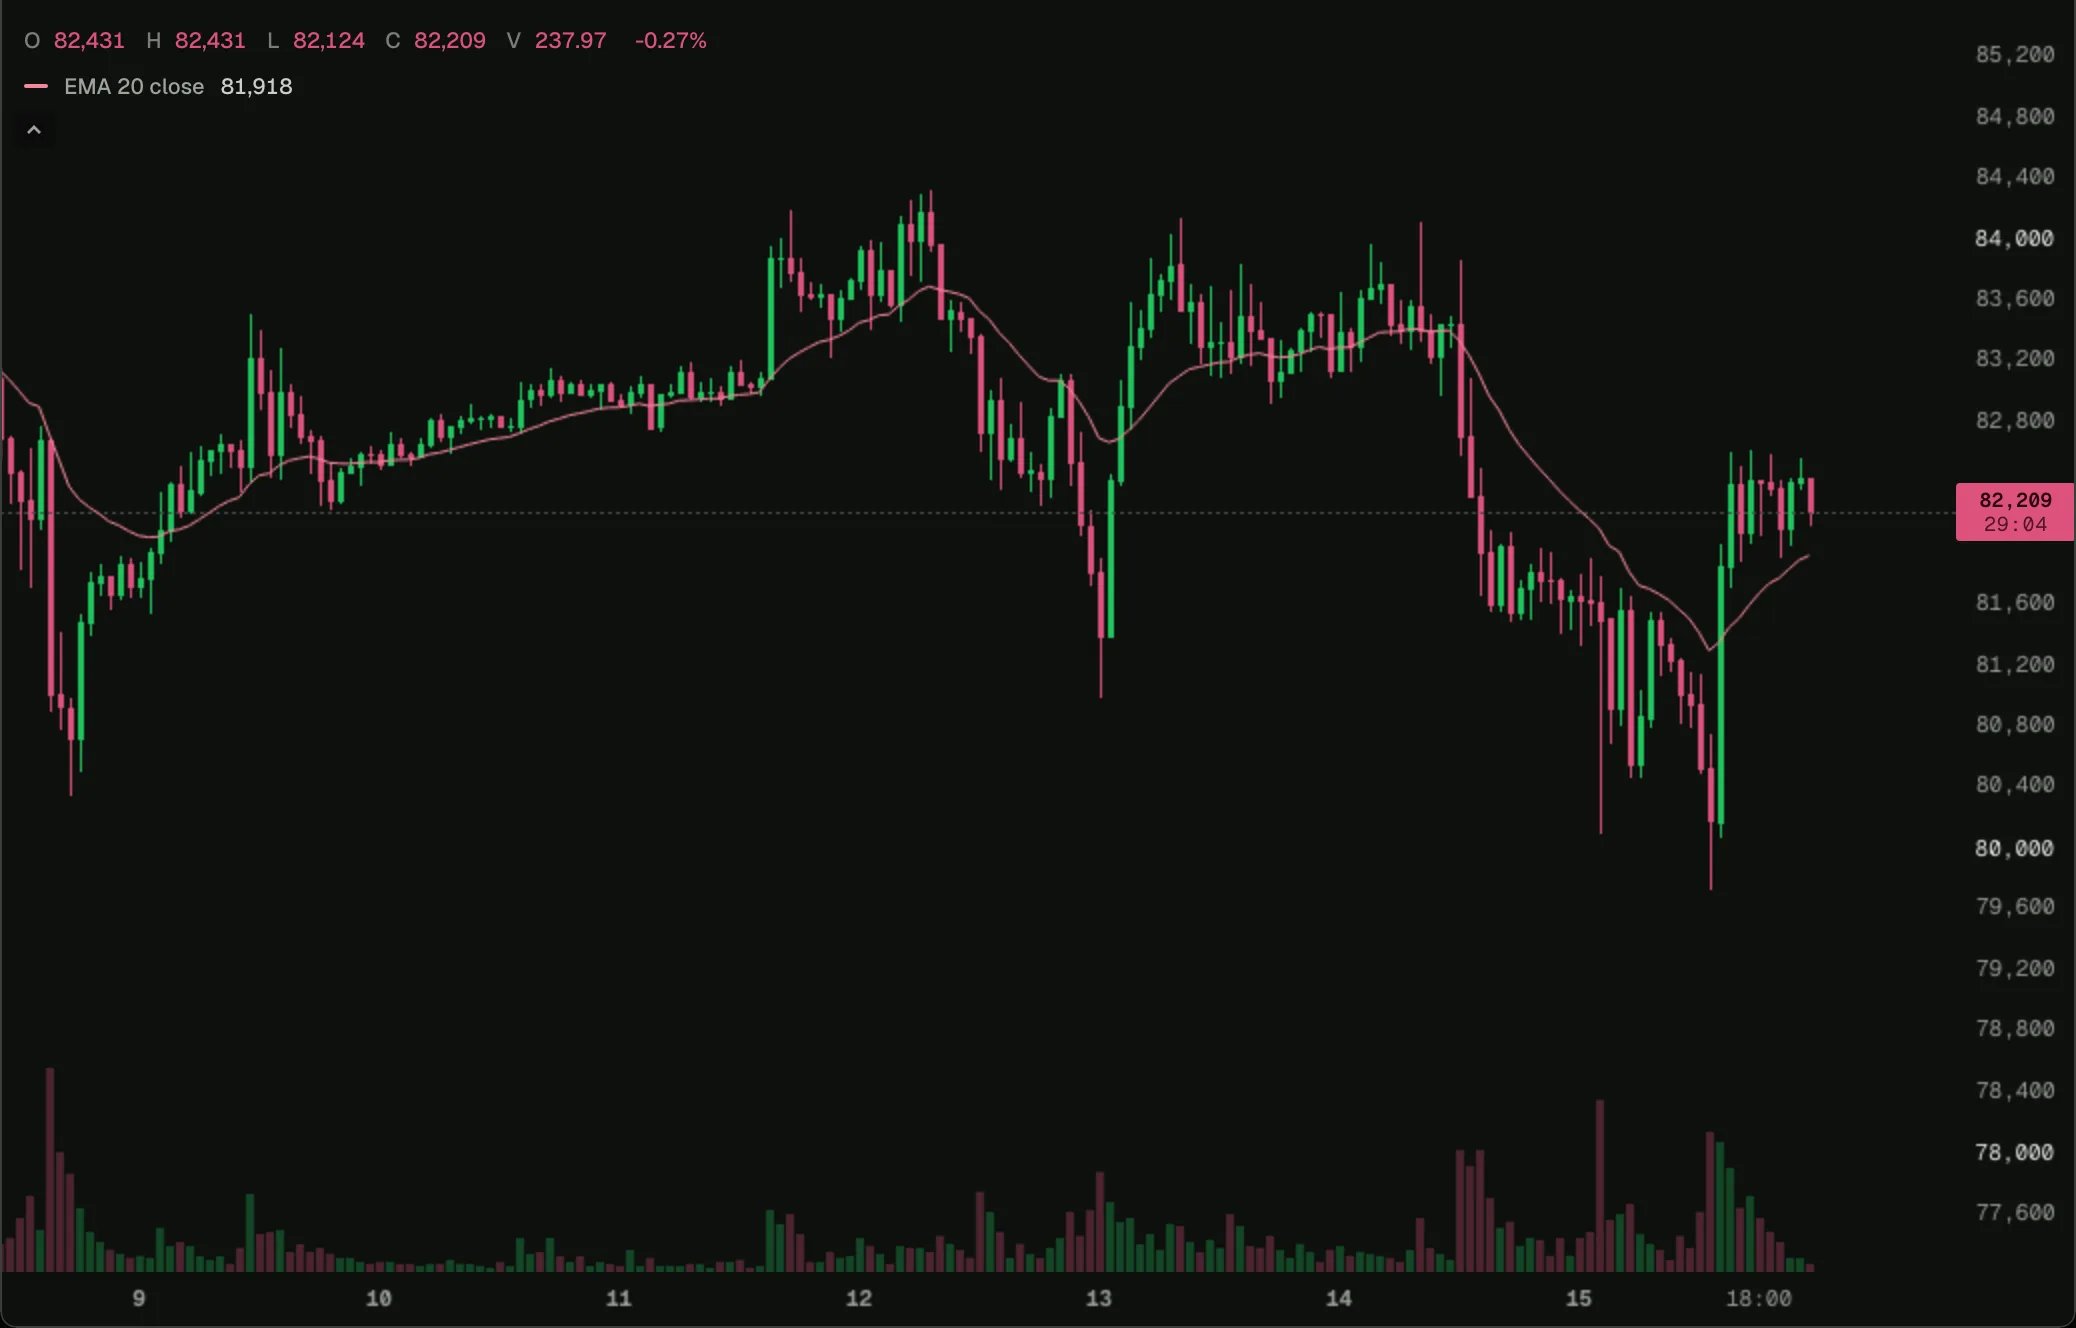 Load it on BTC 1h in the terminal, then change its settings or open it in the script editor.
The terminal's own EMA, as a script: the smallest complete indicator.
## How it works
`ta.ema(length)` is created once, at the top, and updated once per bar in `onBar`. Like every `ta` function it matches TradingView's built-in, including its seed: the simple average of the first `length` values. The **Source** input picks which bar value to average.
## The script
```ts ema.ts theme={"theme":"github-dark"}
// The built-in EMA, as a script. The engine's ta.ema follows TradingView: it is seeded with the
// simple average of the first `length` values, so the first bars differ from the chart's old EMA.
indicator('EMA', { overlay: true });
const length = input.int('Length', 20, { min: 1 });
const source = input.source('Source', 'close');
const chart = bars();
const ema = ta.ema(length);
const line = plot.line('EMA');
chart.onBar(() => {
line.set(ema.update(chart.source(source)));
});
```
## Next step
See the next example, [4h EMA](/terminal/examples/higher-timeframe).
This documentation is built and hosted on [Mintlify](https://mintlify.com), a developer documentation platform.
Load it on BTC 1h in the terminal, then change its settings or open it in the script editor.
The terminal's own EMA, as a script: the smallest complete indicator.
## How it works
`ta.ema(length)` is created once, at the top, and updated once per bar in `onBar`. Like every `ta` function it matches TradingView's built-in, including its seed: the simple average of the first `length` values. The **Source** input picks which bar value to average.
## The script
```ts ema.ts theme={"theme":"github-dark"}
// The built-in EMA, as a script. The engine's ta.ema follows TradingView: it is seeded with the
// simple average of the first `length` values, so the first bars differ from the chart's old EMA.
indicator('EMA', { overlay: true });
const length = input.int('Length', 20, { min: 1 });
const source = input.source('Source', 'close');
const chart = bars();
const ema = ta.ema(length);
const line = plot.line('EMA');
chart.onBar(() => {
line.set(ema.update(chart.source(source)));
});
```
## Next step
See the next example, [4h EMA](/terminal/examples/higher-timeframe).
This documentation is built and hosted on [Mintlify](https://mintlify.com), a developer documentation platform.