> ## Documentation Index
> Fetch the complete documentation index at: https://docs.0xarchive.io/llms.txt
> Use this file to discover all available pages before exploring further.
# Footprint cells
> What takers sold and bought in each price row inside every bar, from every trade, with imbalances shaded deeper.
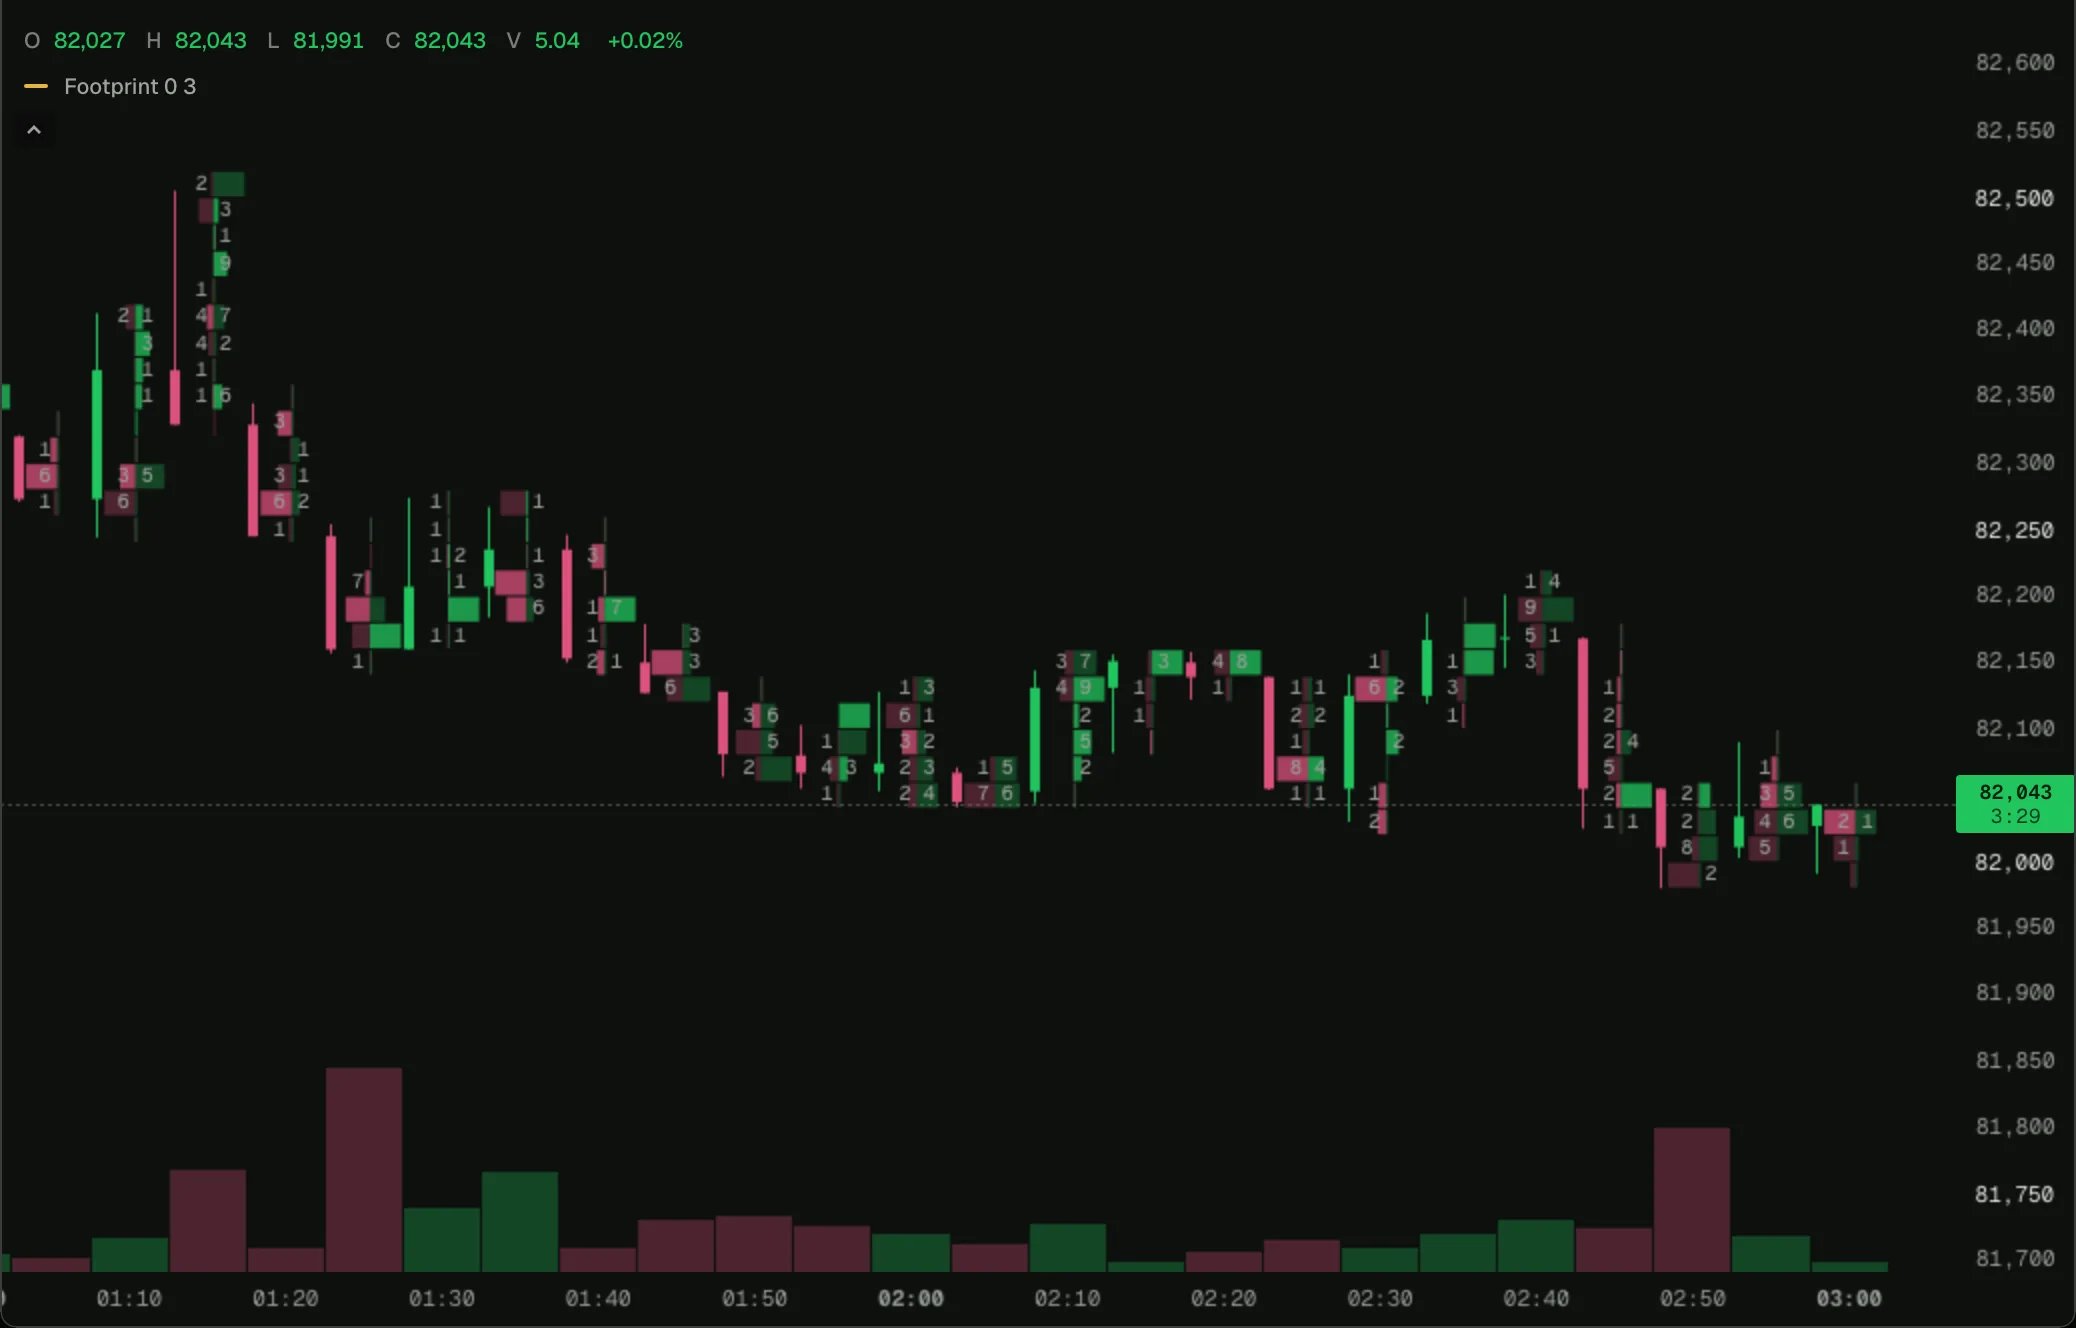 Load it on BTC 5m in the terminal, then change its settings or open it in the script editor.
A footprint inside each bar: what takers sold (left) and bought (right) in each price row, from every trade, with the candle as a thin strip beside it. A row whose buying is three times the selling one row below it, or whose selling is three times the buying one row above, is an imbalance and is shaded deeper. **Delta only** shows each row's buying less selling instead.
## How it works
[`volumeProfile()`](/terminal/guides/order-flow#volume-by-price) gives each bar's trades by price, and [`plot.cells`](/terminal/guides/outputs#cells-inside-bars) draws them as bands of price inside the bar, in two columns. One row size holds for the whole chart, picked from the first bar's price unless the input sets it, so a row is the same row on every bar. Zoom in until the bars are wide enough for the numbers: a cell too small for its number shortens it, then leaves it out.
## The script
```ts footprint-cells.ts theme={"theme":"github-dark"}
// A footprint inside each bar: what takers sold (left) and bought (right) in each price row, from
// every trade, with the candle as a thin strip beside it. A row whose buying is three times the
// selling one row below it (or whose selling is three times the buying one row above) is an
// imbalance, shaded deeper, as the footprint chart marks them. One switch shows each row's delta.
indicator('Footprint cells', { overlay: true, shortName: 'Footprint' });
const rowInput = input.float('Row size (0 picks one)', 0, { min: 0 });
const deltaOnly = input.bool('Delta only', false);
const ratio = input.float('Imbalance ratio', 3, { min: 1, step: 0.5 });
const chart = bars();
const profile = volumeProfile();
const rowSize = state.bar(0);
const bidAsk = plot.cells('Sold × bought', { columns: 2, candles: 'side' });
const delta = plot.cells('Delta', { candles: 'side', sign: true });
/** 1, 2, 2.5 or 5 times a power of ten, near a 5,000th of the price: $10 rows for BTC at 64,000. */
function pickRow(price: number): number {
const raw = price / 5000;
const power = Math.pow(10, Math.floor(Math.log10(raw)));
const steps = [1, 2, 2.5, 5, 10];
let best = steps[0];
for (const step of steps) if (Math.abs(Math.log(step * power / raw)) < Math.abs(Math.log(best * power / raw))) best = step;
return best * power;
}
chart.onBar(() => {
// One size for every bar, so each row is the same row across the chart.
if (rowSize.value === 0) rowSize.value = rowInput > 0 ? rowInput : pickRow(chart.close);
// Trades reach back to the start of the UTC day before yesterday; older bars keep their candle.
if (!profile.available) return;
const rows = profile.bar().rows({ rowSize: rowSize.value });
if (rows === null) return;
for (let i = 0; i < rows.length; i += 1) {
const row = rows[i];
if (row.total === 0) continue;
if (deltaOnly) {
delta.add({ low: row.low, high: row.high, weight: Math.abs(row.delta), value: row.delta, color: color.withAlpha(row.delta >= 0 ? color.up : color.down, 0.45) });
continue;
}
const buyImbalance = i > 0 && row.buy > 0 && row.buy >= ratio * rows[i - 1].sell;
const sellImbalance = i + 1 < rows.length && row.sell > 0 && row.sell >= ratio * rows[i + 1].buy;
// An empty side has no number: a blank reads faster than a 0.
bidAsk.add({ low: row.low, high: row.high, weight: row.sell, value: row.sell > 0 ? row.sell : undefined, color: color.withAlpha(color.down, sellImbalance ? 0.75 : 0.3), column: 0, align: 'right' });
bidAsk.add({ low: row.low, high: row.high, weight: row.buy, value: row.buy > 0 ? row.buy : undefined, color: color.withAlpha(color.up, buyImbalance ? 0.75 : 0.3), column: 1 });
}
});
```
## Next step
See the next example, [Session volume profile](/terminal/examples/session-volume-profile).
This documentation is built and hosted on [Mintlify](https://mintlify.com), a developer documentation platform.
Load it on BTC 5m in the terminal, then change its settings or open it in the script editor.
A footprint inside each bar: what takers sold (left) and bought (right) in each price row, from every trade, with the candle as a thin strip beside it. A row whose buying is three times the selling one row below it, or whose selling is three times the buying one row above, is an imbalance and is shaded deeper. **Delta only** shows each row's buying less selling instead.
## How it works
[`volumeProfile()`](/terminal/guides/order-flow#volume-by-price) gives each bar's trades by price, and [`plot.cells`](/terminal/guides/outputs#cells-inside-bars) draws them as bands of price inside the bar, in two columns. One row size holds for the whole chart, picked from the first bar's price unless the input sets it, so a row is the same row on every bar. Zoom in until the bars are wide enough for the numbers: a cell too small for its number shortens it, then leaves it out.
## The script
```ts footprint-cells.ts theme={"theme":"github-dark"}
// A footprint inside each bar: what takers sold (left) and bought (right) in each price row, from
// every trade, with the candle as a thin strip beside it. A row whose buying is three times the
// selling one row below it (or whose selling is three times the buying one row above) is an
// imbalance, shaded deeper, as the footprint chart marks them. One switch shows each row's delta.
indicator('Footprint cells', { overlay: true, shortName: 'Footprint' });
const rowInput = input.float('Row size (0 picks one)', 0, { min: 0 });
const deltaOnly = input.bool('Delta only', false);
const ratio = input.float('Imbalance ratio', 3, { min: 1, step: 0.5 });
const chart = bars();
const profile = volumeProfile();
const rowSize = state.bar(0);
const bidAsk = plot.cells('Sold × bought', { columns: 2, candles: 'side' });
const delta = plot.cells('Delta', { candles: 'side', sign: true });
/** 1, 2, 2.5 or 5 times a power of ten, near a 5,000th of the price: $10 rows for BTC at 64,000. */
function pickRow(price: number): number {
const raw = price / 5000;
const power = Math.pow(10, Math.floor(Math.log10(raw)));
const steps = [1, 2, 2.5, 5, 10];
let best = steps[0];
for (const step of steps) if (Math.abs(Math.log(step * power / raw)) < Math.abs(Math.log(best * power / raw))) best = step;
return best * power;
}
chart.onBar(() => {
// One size for every bar, so each row is the same row across the chart.
if (rowSize.value === 0) rowSize.value = rowInput > 0 ? rowInput : pickRow(chart.close);
// Trades reach back to the start of the UTC day before yesterday; older bars keep their candle.
if (!profile.available) return;
const rows = profile.bar().rows({ rowSize: rowSize.value });
if (rows === null) return;
for (let i = 0; i < rows.length; i += 1) {
const row = rows[i];
if (row.total === 0) continue;
if (deltaOnly) {
delta.add({ low: row.low, high: row.high, weight: Math.abs(row.delta), value: row.delta, color: color.withAlpha(row.delta >= 0 ? color.up : color.down, 0.45) });
continue;
}
const buyImbalance = i > 0 && row.buy > 0 && row.buy >= ratio * rows[i - 1].sell;
const sellImbalance = i + 1 < rows.length && row.sell > 0 && row.sell >= ratio * rows[i + 1].buy;
// An empty side has no number: a blank reads faster than a 0.
bidAsk.add({ low: row.low, high: row.high, weight: row.sell, value: row.sell > 0 ? row.sell : undefined, color: color.withAlpha(color.down, sellImbalance ? 0.75 : 0.3), column: 0, align: 'right' });
bidAsk.add({ low: row.low, high: row.high, weight: row.buy, value: row.buy > 0 ? row.buy : undefined, color: color.withAlpha(color.up, buyImbalance ? 0.75 : 0.3), column: 1 });
}
});
```
## Next step
See the next example, [Session volume profile](/terminal/examples/session-volume-profile).
This documentation is built and hosted on [Mintlify](https://mintlify.com), a developer documentation platform.