> ## Documentation Index
> Fetch the complete documentation index at: https://docs.0xarchive.io/llms.txt
> Use this file to discover all available pages before exploring further.
# 4h EMA and daily close, pasted Pine
> request.security on other timeframes, from pasted Pine.
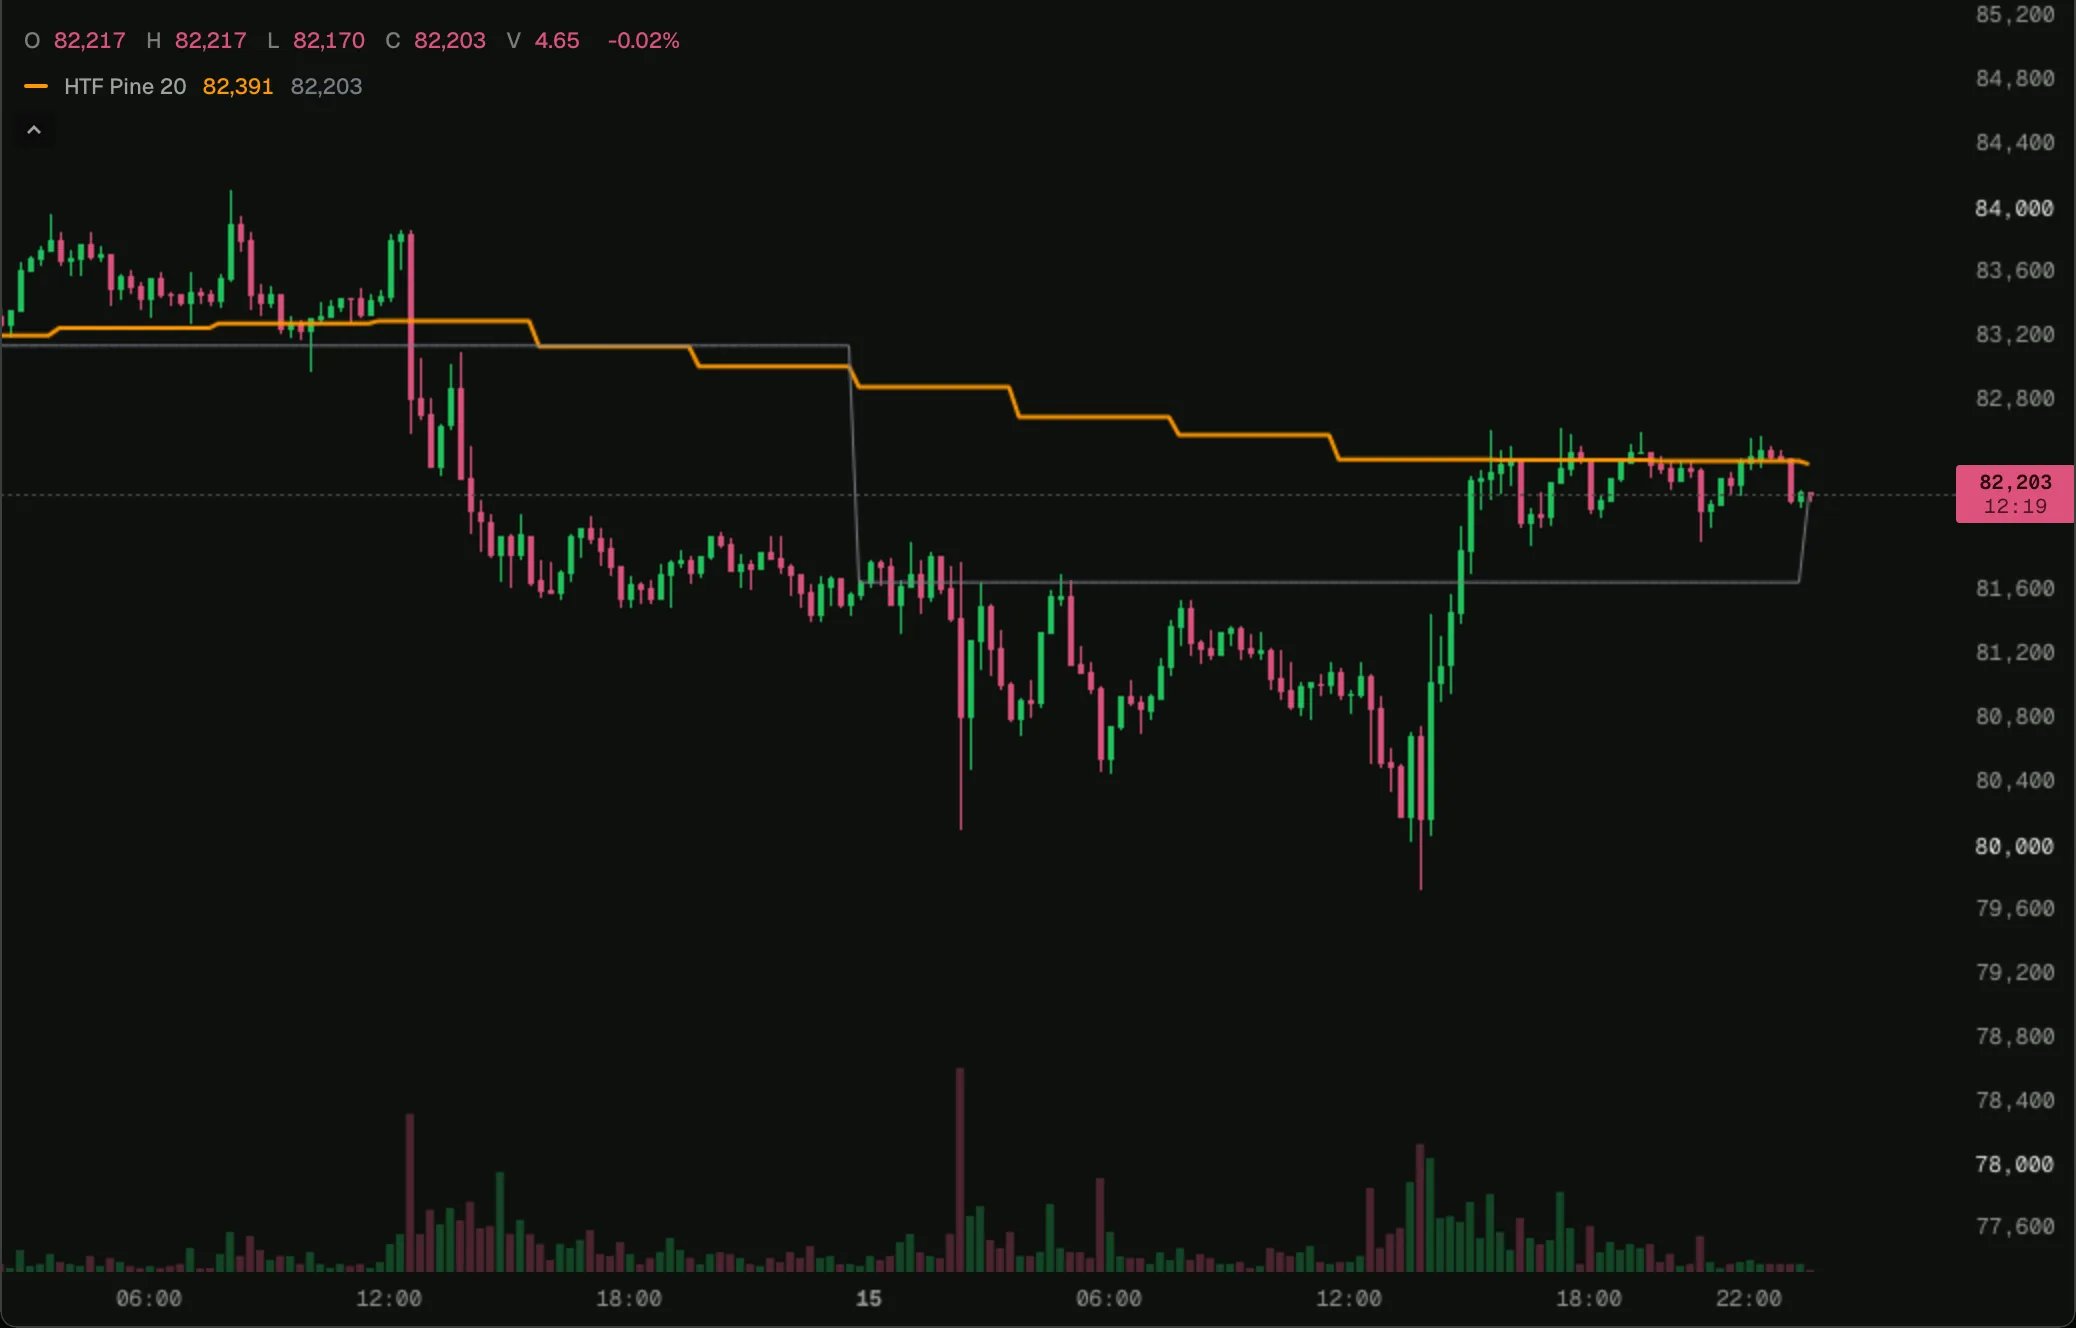 Load it on BTC 15m in the terminal, then change its settings or open it in the script editor.
`request.security` reads the 4-hour and daily bars. The translation turns each into a second bar stream, read closed only, which is Pine's behaviour with lookahead off.
## How it translates
* Each `request.security` becomes a second `bars()` stream on its timeframe, `"240"` as `4h` and `"D"` as `1d`, with the expression computed in that stream's handler.
* On history, the chart reads each stream's last closed bar; live, its forming bar, which is what Pine shows with lookahead off.
* `plot.style_stepline` is drawn as a line joined across bars, since a step line is drawn as a plain line here.
See [data and timeframes](/terminal/guides/data#other-markets-and-intervals) for the same thing written by hand.
## The script
```pine htf-pine.pine theme={"theme":"github-dark"}
//@version=5
// Another timeframe in pasted Pine: request.security reads the 4h and daily bars, closed only.
indicator("4h EMA and daily close, pasted Pine", shorttitle="HTF Pine", overlay=true)
len = input.int(20, "Length", minval=1)
ema4h = request.security(syminfo.tickerid, "240", ta.ema(close, len))
daily = request.security(syminfo.tickerid, "D", close)
plot(ema4h, "4h EMA", color=color.orange, linewidth=2)
plot(daily, "Daily close", color=color.gray, style=plot.style_stepline)
```
## Next step
Look up any function in the [reference](/terminal/reference).
This documentation is built and hosted on [Mintlify](https://mintlify.com), a developer documentation platform.
Load it on BTC 15m in the terminal, then change its settings or open it in the script editor.
`request.security` reads the 4-hour and daily bars. The translation turns each into a second bar stream, read closed only, which is Pine's behaviour with lookahead off.
## How it translates
* Each `request.security` becomes a second `bars()` stream on its timeframe, `"240"` as `4h` and `"D"` as `1d`, with the expression computed in that stream's handler.
* On history, the chart reads each stream's last closed bar; live, its forming bar, which is what Pine shows with lookahead off.
* `plot.style_stepline` is drawn as a line joined across bars, since a step line is drawn as a plain line here.
See [data and timeframes](/terminal/guides/data#other-markets-and-intervals) for the same thing written by hand.
## The script
```pine htf-pine.pine theme={"theme":"github-dark"}
//@version=5
// Another timeframe in pasted Pine: request.security reads the 4h and daily bars, closed only.
indicator("4h EMA and daily close, pasted Pine", shorttitle="HTF Pine", overlay=true)
len = input.int(20, "Length", minval=1)
ema4h = request.security(syminfo.tickerid, "240", ta.ema(close, len))
daily = request.security(syminfo.tickerid, "D", close)
plot(ema4h, "4h EMA", color=color.orange, linewidth=2)
plot(daily, "Daily close", color=color.gray, style=plot.style_stepline)
```
## Next step
Look up any function in the [reference](/terminal/reference).
This documentation is built and hosted on [Mintlify](https://mintlify.com), a developer documentation platform.