> ## Documentation Index
> Fetch the complete documentation index at: https://docs.0xarchive.io/llms.txt
> Use this file to discover all available pages before exploring further.
# Ichimoku, pasted Pine
> Ichimoku as Pine Script v6, in TradingView's colours.
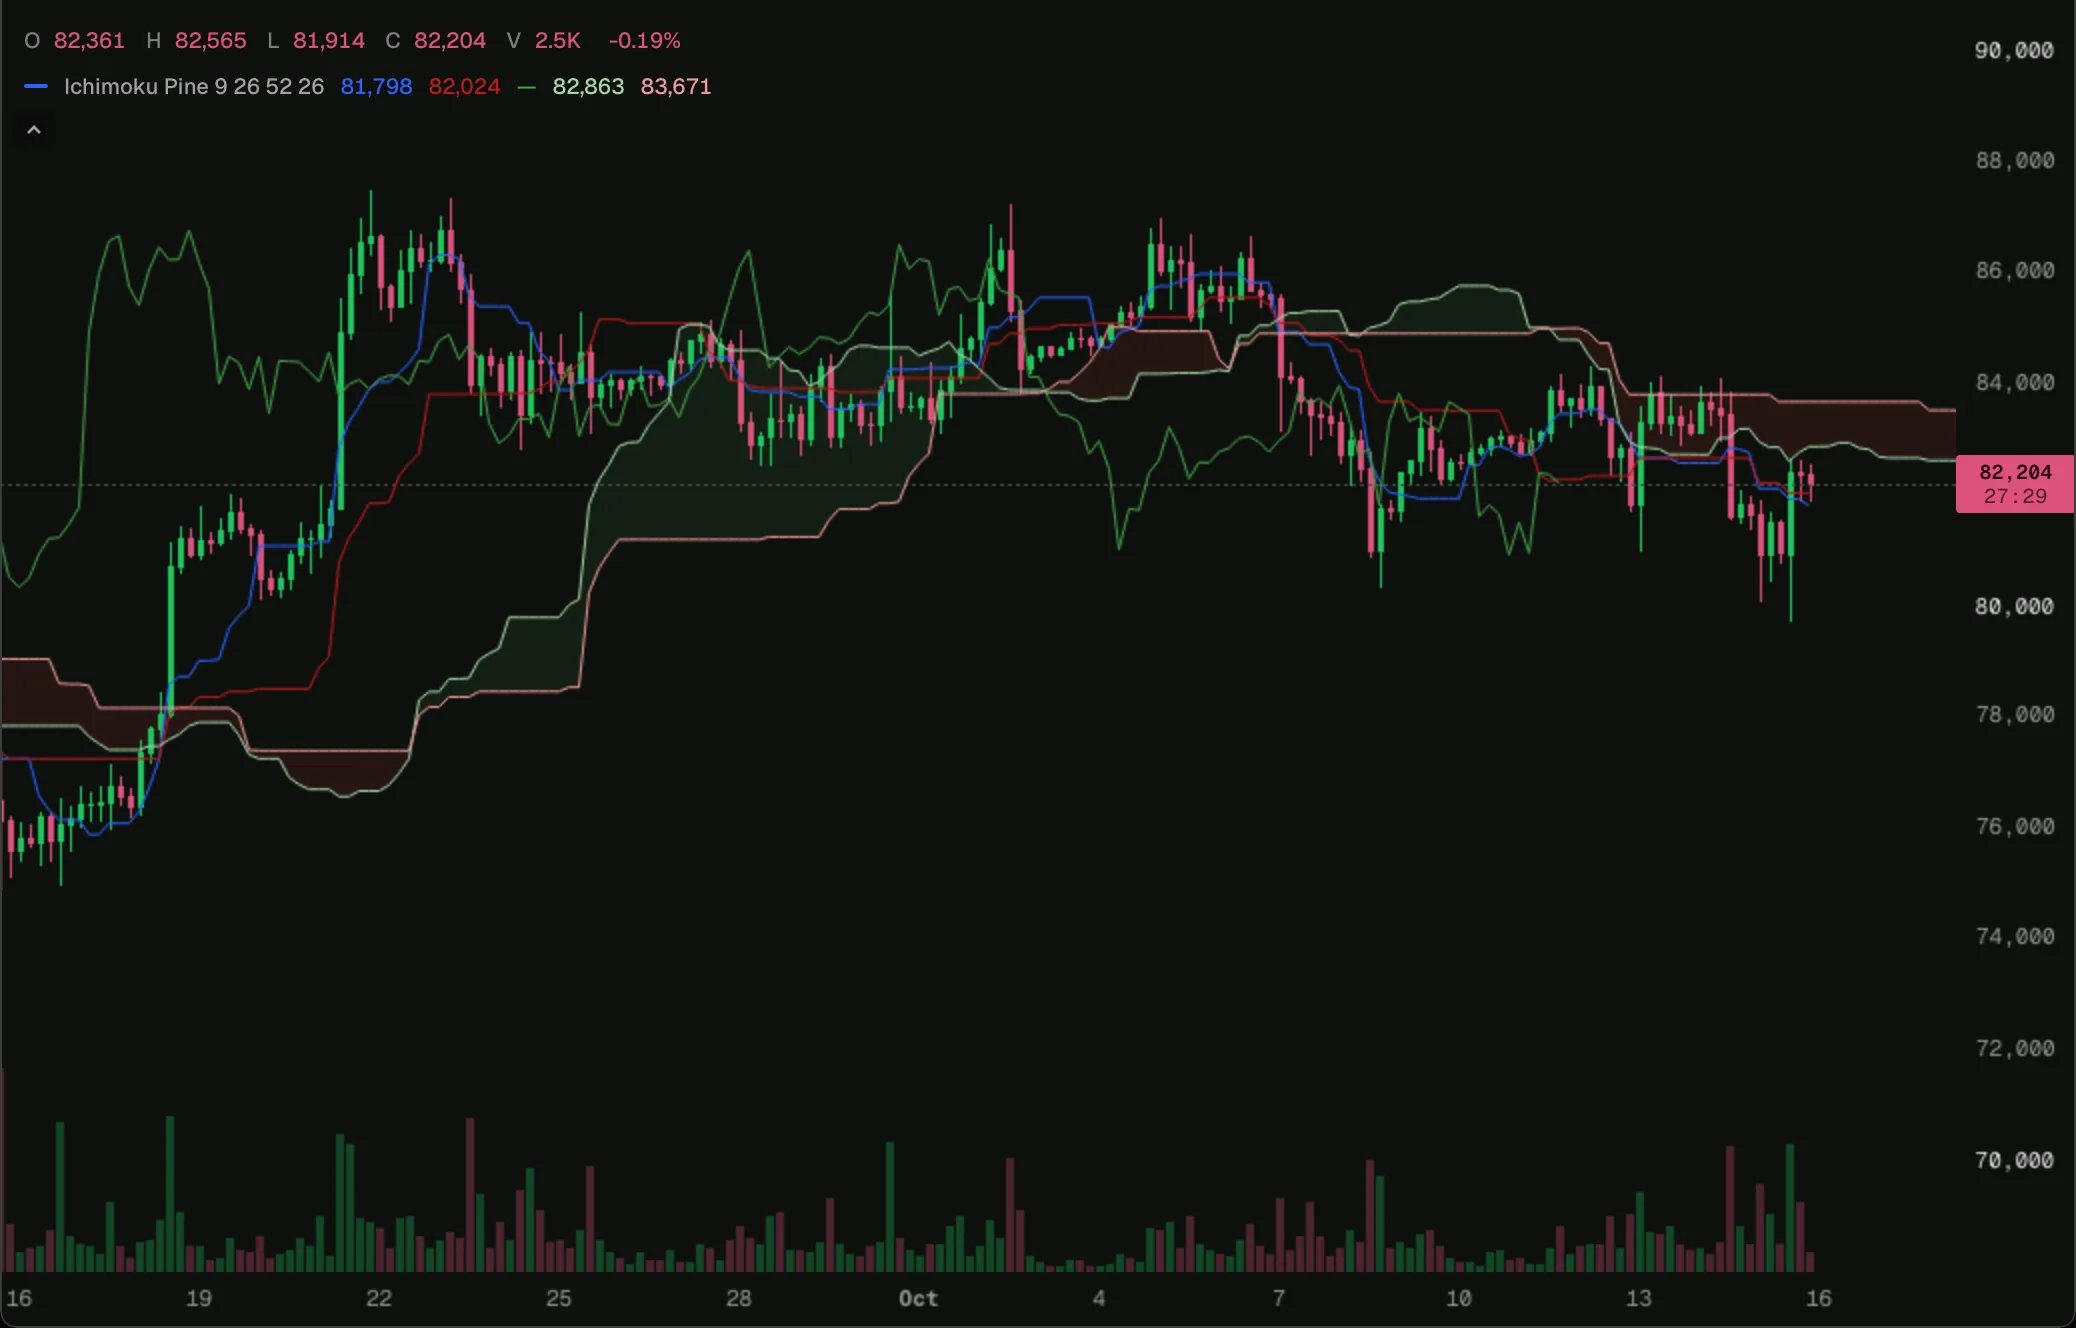 Load it on BTC 4h in the terminal, then change its settings or open it in the script editor.
The Ichimoku example as Pine Script v6 pasted from TradingView, user function and offsets included.
## How it translates
* The user function `midpoint(n)` calls `ta.lowest` and `ta.highest`, which keep history, so the translation makes it a factory called once per call site: each of the three calls keeps its own window.
* `offset = shift - 1` and `offset = -shift + 1` become the plots' `offset` option, so the leading spans are drawn past the newest bar.
* The `fill` coloured by `spanA > spanB` becomes a `plot.fill` set each bar with that bar's colour.
Compare it with [Ichimoku](/terminal/examples/ichimoku), written by hand.
## The script
```pine ichimoku-pine.pine theme={"theme":"github-dark"}
//@version=6
// The Ichimoku example (ichimoku.ts) as pasted from TradingView, in TradingView's colours.
indicator("Ichimoku cloud, pasted Pine", "Ichimoku Pine", overlay = true)
tenkanLength = input.int(9, "Conversion line length", minval = 1)
kijunLength = input.int(26, "Base line length", minval = 1)
spanBLength = input.int(52, "Leading span B length", minval = 1)
shift = input.int(26, "Displacement", minval = 1)
midpoint(n) => math.avg(ta.lowest(n), ta.highest(n))
tenkan = midpoint(tenkanLength)
kijun = midpoint(kijunLength)
spanA = math.avg(tenkan, kijun)
spanB = midpoint(spanBLength)
plot(tenkan, "Conversion line", color = #2962FF)
plot(kijun, "Base line", color = #B71C1C)
plot(close, "Lagging span", color = #43A047, offset = -shift + 1)
a = plot(spanA, "Leading span A", color = #A5D6A7, offset = shift - 1)
b = plot(spanB, "Leading span B", color = #EF9A9A, offset = shift - 1)
fill(a, b, color = spanA > spanB ? color.rgb(67, 160, 71, 90) : color.rgb(244, 67, 54, 90), title = "Cloud")
```
## Next step
See the next example, [4h EMA and daily close, pasted Pine](/terminal/examples/htf-pine).
This documentation is built and hosted on [Mintlify](https://mintlify.com), a developer documentation platform.
Load it on BTC 4h in the terminal, then change its settings or open it in the script editor.
The Ichimoku example as Pine Script v6 pasted from TradingView, user function and offsets included.
## How it translates
* The user function `midpoint(n)` calls `ta.lowest` and `ta.highest`, which keep history, so the translation makes it a factory called once per call site: each of the three calls keeps its own window.
* `offset = shift - 1` and `offset = -shift + 1` become the plots' `offset` option, so the leading spans are drawn past the newest bar.
* The `fill` coloured by `spanA > spanB` becomes a `plot.fill` set each bar with that bar's colour.
Compare it with [Ichimoku](/terminal/examples/ichimoku), written by hand.
## The script
```pine ichimoku-pine.pine theme={"theme":"github-dark"}
//@version=6
// The Ichimoku example (ichimoku.ts) as pasted from TradingView, in TradingView's colours.
indicator("Ichimoku cloud, pasted Pine", "Ichimoku Pine", overlay = true)
tenkanLength = input.int(9, "Conversion line length", minval = 1)
kijunLength = input.int(26, "Base line length", minval = 1)
spanBLength = input.int(52, "Leading span B length", minval = 1)
shift = input.int(26, "Displacement", minval = 1)
midpoint(n) => math.avg(ta.lowest(n), ta.highest(n))
tenkan = midpoint(tenkanLength)
kijun = midpoint(kijunLength)
spanA = math.avg(tenkan, kijun)
spanB = midpoint(spanBLength)
plot(tenkan, "Conversion line", color = #2962FF)
plot(kijun, "Base line", color = #B71C1C)
plot(close, "Lagging span", color = #43A047, offset = -shift + 1)
a = plot(spanA, "Leading span A", color = #A5D6A7, offset = shift - 1)
b = plot(spanB, "Leading span B", color = #EF9A9A, offset = shift - 1)
fill(a, b, color = spanA > spanB ? color.rgb(67, 160, 71, 90) : color.rgb(244, 67, 54, 90), title = "Cloud")
```
## Next step
See the next example, [4h EMA and daily close, pasted Pine](/terminal/examples/htf-pine).
This documentation is built and hosted on [Mintlify](https://mintlify.com), a developer documentation platform.