> ## Documentation Index
> Fetch the complete documentation index at: https://docs.0xarchive.io/llms.txt
> Use this file to discover all available pages before exploring further.
# Ichimoku
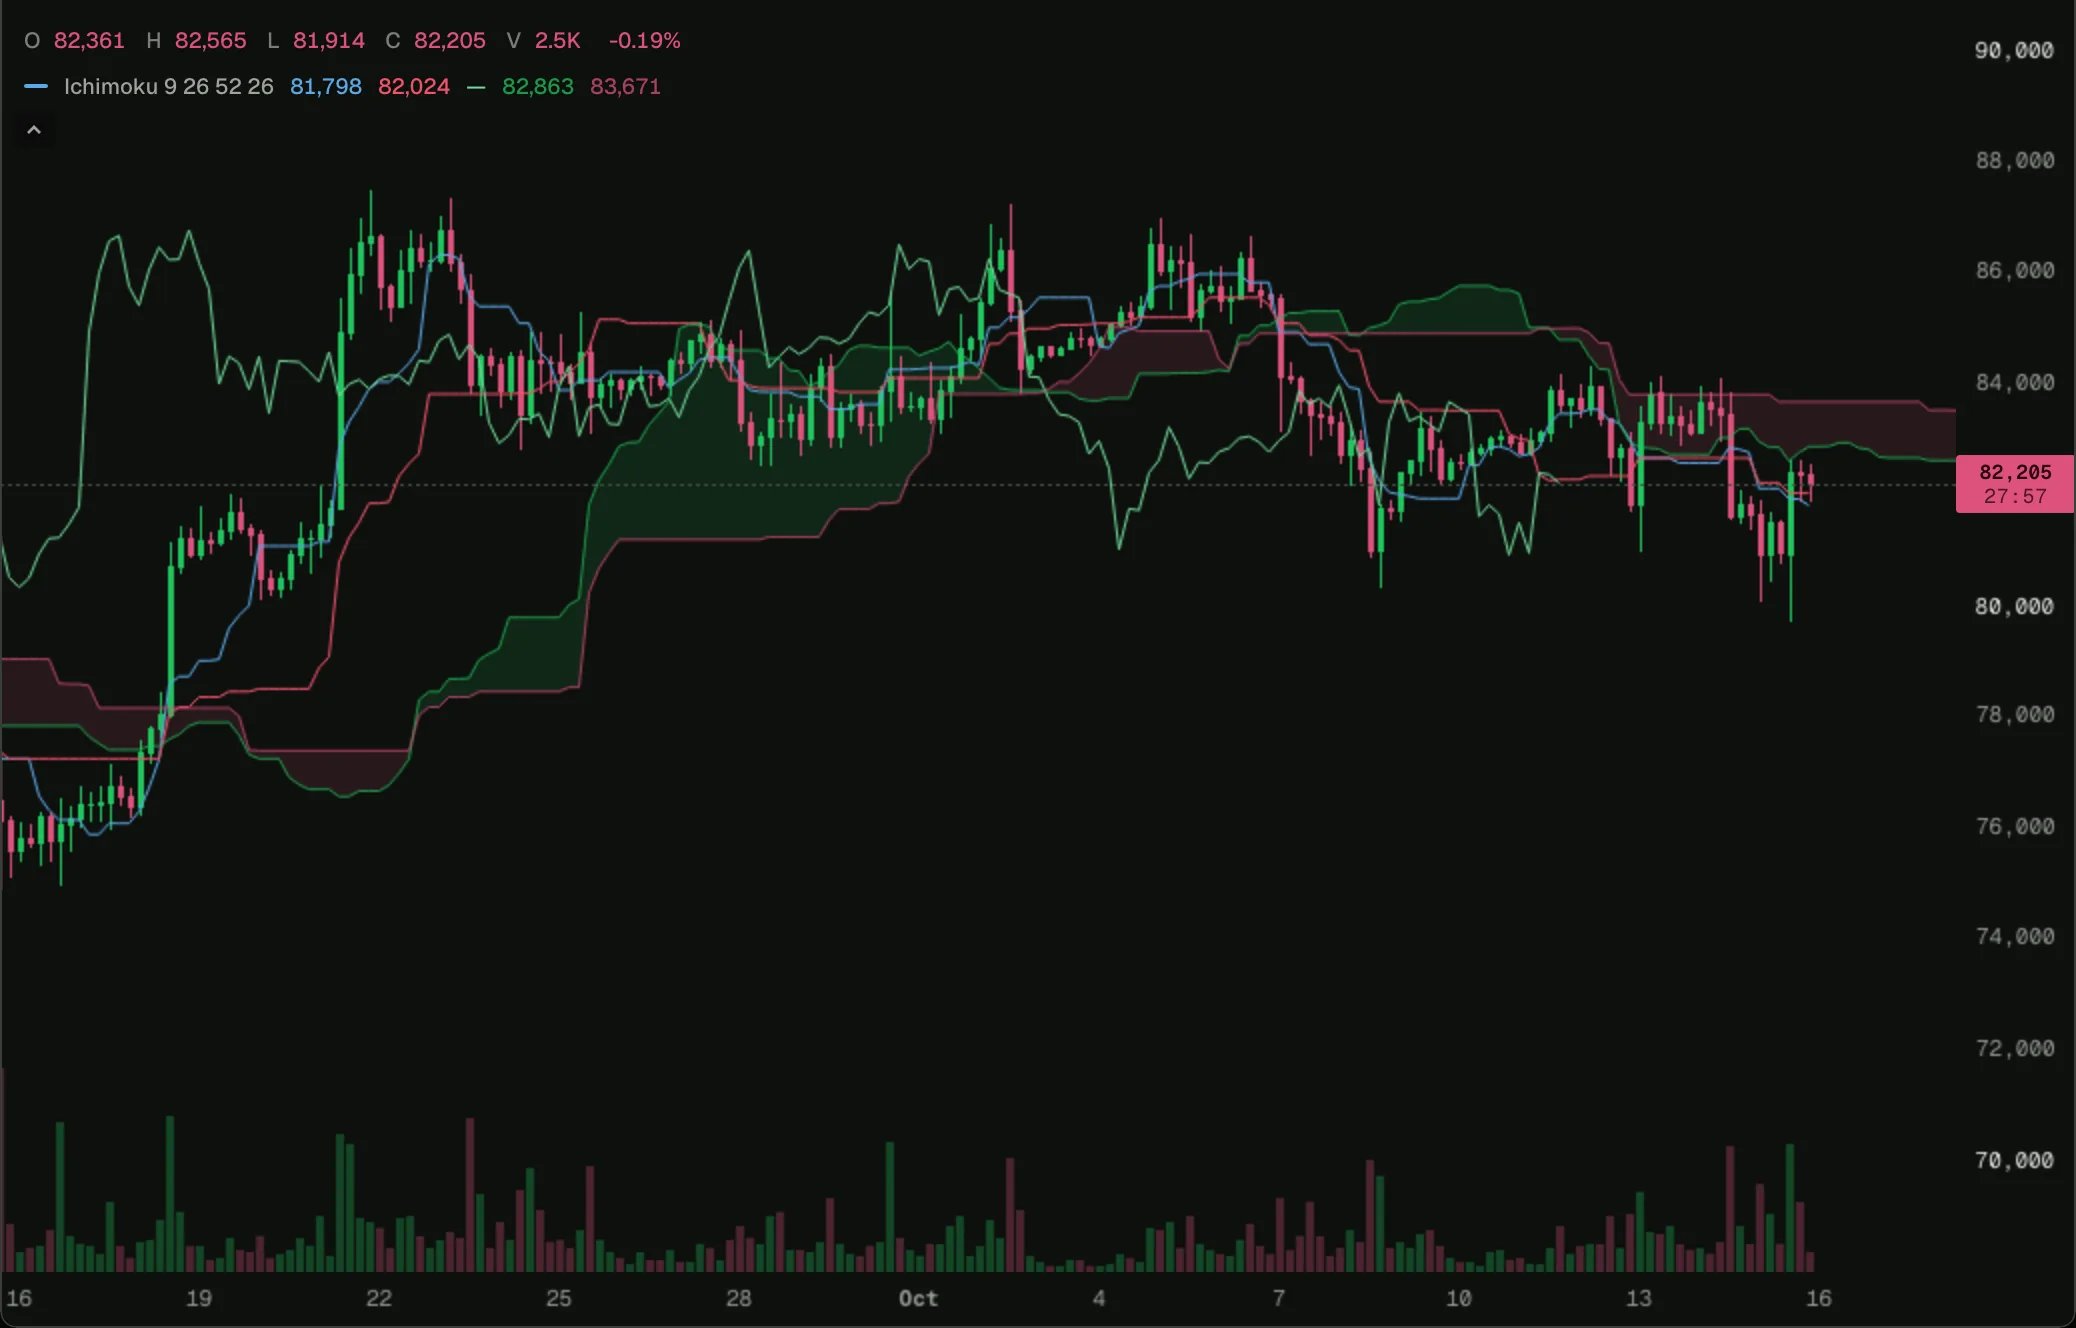
> Ichimoku Kinko Hyo, with the leading spans and cloud drawn ahead of the newest bar.
 Load it on BTC 4h in the terminal, then change its settings or open it in the script editor.
Ichimoku as TradingView draws it: the conversion and base lines, the lagging span 25 bars back, and the two leading spans and the cloud between them 25 bars ahead, in the space past the newest candle.
## How it works
`offset` shifts a plot by whole bars: positive draws to the right, past the newest bar; negative to the left. `plot.fill` shades between the two leading spans, coloured per bar.
## The script
```ts ichimoku.ts theme={"theme":"github-dark"}
// Ichimoku Kinko Hyo, drawn as TradingView's built-in draws it: the two leading spans, and the
// cloud between them, shifted 25 bars ahead, into the space past the newest bar; the lagging
// span, the close, shifted 25 bars back. Each line is the midpoint of the highest high and the
// lowest low over its window.
indicator('Ichimoku', { overlay: true });
const conversionLength = input.int('Conversion line length', 9, { min: 1 });
const baseLength = input.int('Base line length', 26, { min: 1 });
const spanBLength = input.int('Leading span B length', 52, { min: 1 });
const displacement = input.int('Displacement', 26, { min: 1 });
const chart = bars();
const conversionHigh = ta.highest(conversionLength);
const conversionLow = ta.lowest(conversionLength);
const baseHigh = ta.highest(baseLength);
const baseLow = ta.lowest(baseLength);
const spanBHigh = ta.highest(spanBLength);
const spanBLow = ta.lowest(spanBLength);
// Blue, red and green as on TradingView, from the theme's study colours.
const conversion = plot.line('Conversion line', { color: color.study(12) });
const base = plot.line('Base line', { color: color.study(6) });
// TradingView counts the displacement from the current bar, so the shift is one bar less.
const lagging = plot.line('Lagging span', { color: color.study(10), offset: 1 - displacement });
const spanA = plot.line('Leading span A', { color: color.withAlpha(color.up, 0.75), offset: displacement - 1 });
const spanB = plot.line('Leading span B', { color: color.withAlpha(color.down, 0.75), offset: displacement - 1 });
const cloud = plot.fill('Cloud', spanA, spanB);
chart.onBar(() => {
const c = (conversionHigh.update(chart.high) + conversionLow.update(chart.low)) / 2;
const b = (baseHigh.update(chart.high) + baseLow.update(chart.low)) / 2;
const a = (c + b) / 2;
const s = (spanBHigh.update(chart.high) + spanBLow.update(chart.low)) / 2;
conversion.set(c);
base.set(b);
lagging.set(chart.close);
spanA.set(a);
spanB.set(s);
cloud.set(a > s ? color.withAlpha(color.up, 0.12) : color.withAlpha(color.down, 0.12));
});
```
## Next step
See the next example, [RSI cross](/terminal/examples/rsi-cross).
This documentation is built and hosted on [Mintlify](https://mintlify.com), a developer documentation platform.
Load it on BTC 4h in the terminal, then change its settings or open it in the script editor.
Ichimoku as TradingView draws it: the conversion and base lines, the lagging span 25 bars back, and the two leading spans and the cloud between them 25 bars ahead, in the space past the newest candle.
## How it works
`offset` shifts a plot by whole bars: positive draws to the right, past the newest bar; negative to the left. `plot.fill` shades between the two leading spans, coloured per bar.
## The script
```ts ichimoku.ts theme={"theme":"github-dark"}
// Ichimoku Kinko Hyo, drawn as TradingView's built-in draws it: the two leading spans, and the
// cloud between them, shifted 25 bars ahead, into the space past the newest bar; the lagging
// span, the close, shifted 25 bars back. Each line is the midpoint of the highest high and the
// lowest low over its window.
indicator('Ichimoku', { overlay: true });
const conversionLength = input.int('Conversion line length', 9, { min: 1 });
const baseLength = input.int('Base line length', 26, { min: 1 });
const spanBLength = input.int('Leading span B length', 52, { min: 1 });
const displacement = input.int('Displacement', 26, { min: 1 });
const chart = bars();
const conversionHigh = ta.highest(conversionLength);
const conversionLow = ta.lowest(conversionLength);
const baseHigh = ta.highest(baseLength);
const baseLow = ta.lowest(baseLength);
const spanBHigh = ta.highest(spanBLength);
const spanBLow = ta.lowest(spanBLength);
// Blue, red and green as on TradingView, from the theme's study colours.
const conversion = plot.line('Conversion line', { color: color.study(12) });
const base = plot.line('Base line', { color: color.study(6) });
// TradingView counts the displacement from the current bar, so the shift is one bar less.
const lagging = plot.line('Lagging span', { color: color.study(10), offset: 1 - displacement });
const spanA = plot.line('Leading span A', { color: color.withAlpha(color.up, 0.75), offset: displacement - 1 });
const spanB = plot.line('Leading span B', { color: color.withAlpha(color.down, 0.75), offset: displacement - 1 });
const cloud = plot.fill('Cloud', spanA, spanB);
chart.onBar(() => {
const c = (conversionHigh.update(chart.high) + conversionLow.update(chart.low)) / 2;
const b = (baseHigh.update(chart.high) + baseLow.update(chart.low)) / 2;
const a = (c + b) / 2;
const s = (spanBHigh.update(chart.high) + spanBLow.update(chart.low)) / 2;
conversion.set(c);
base.set(b);
lagging.set(chart.close);
spanA.set(a);
spanB.set(s);
cloud.set(a > s ? color.withAlpha(color.up, 0.12) : color.withAlpha(color.down, 0.12));
});
```
## Next step
See the next example, [RSI cross](/terminal/examples/rsi-cross).
This documentation is built and hosted on [Mintlify](https://mintlify.com), a developer documentation platform.