> ## Documentation Index
> Fetch the complete documentation index at: https://docs.0xarchive.io/llms.txt
> Use this file to discover all available pages before exploring further.
# Liquidation clusters
> The single biggest long and short liquidation level within 10% of the price, as of each bar.
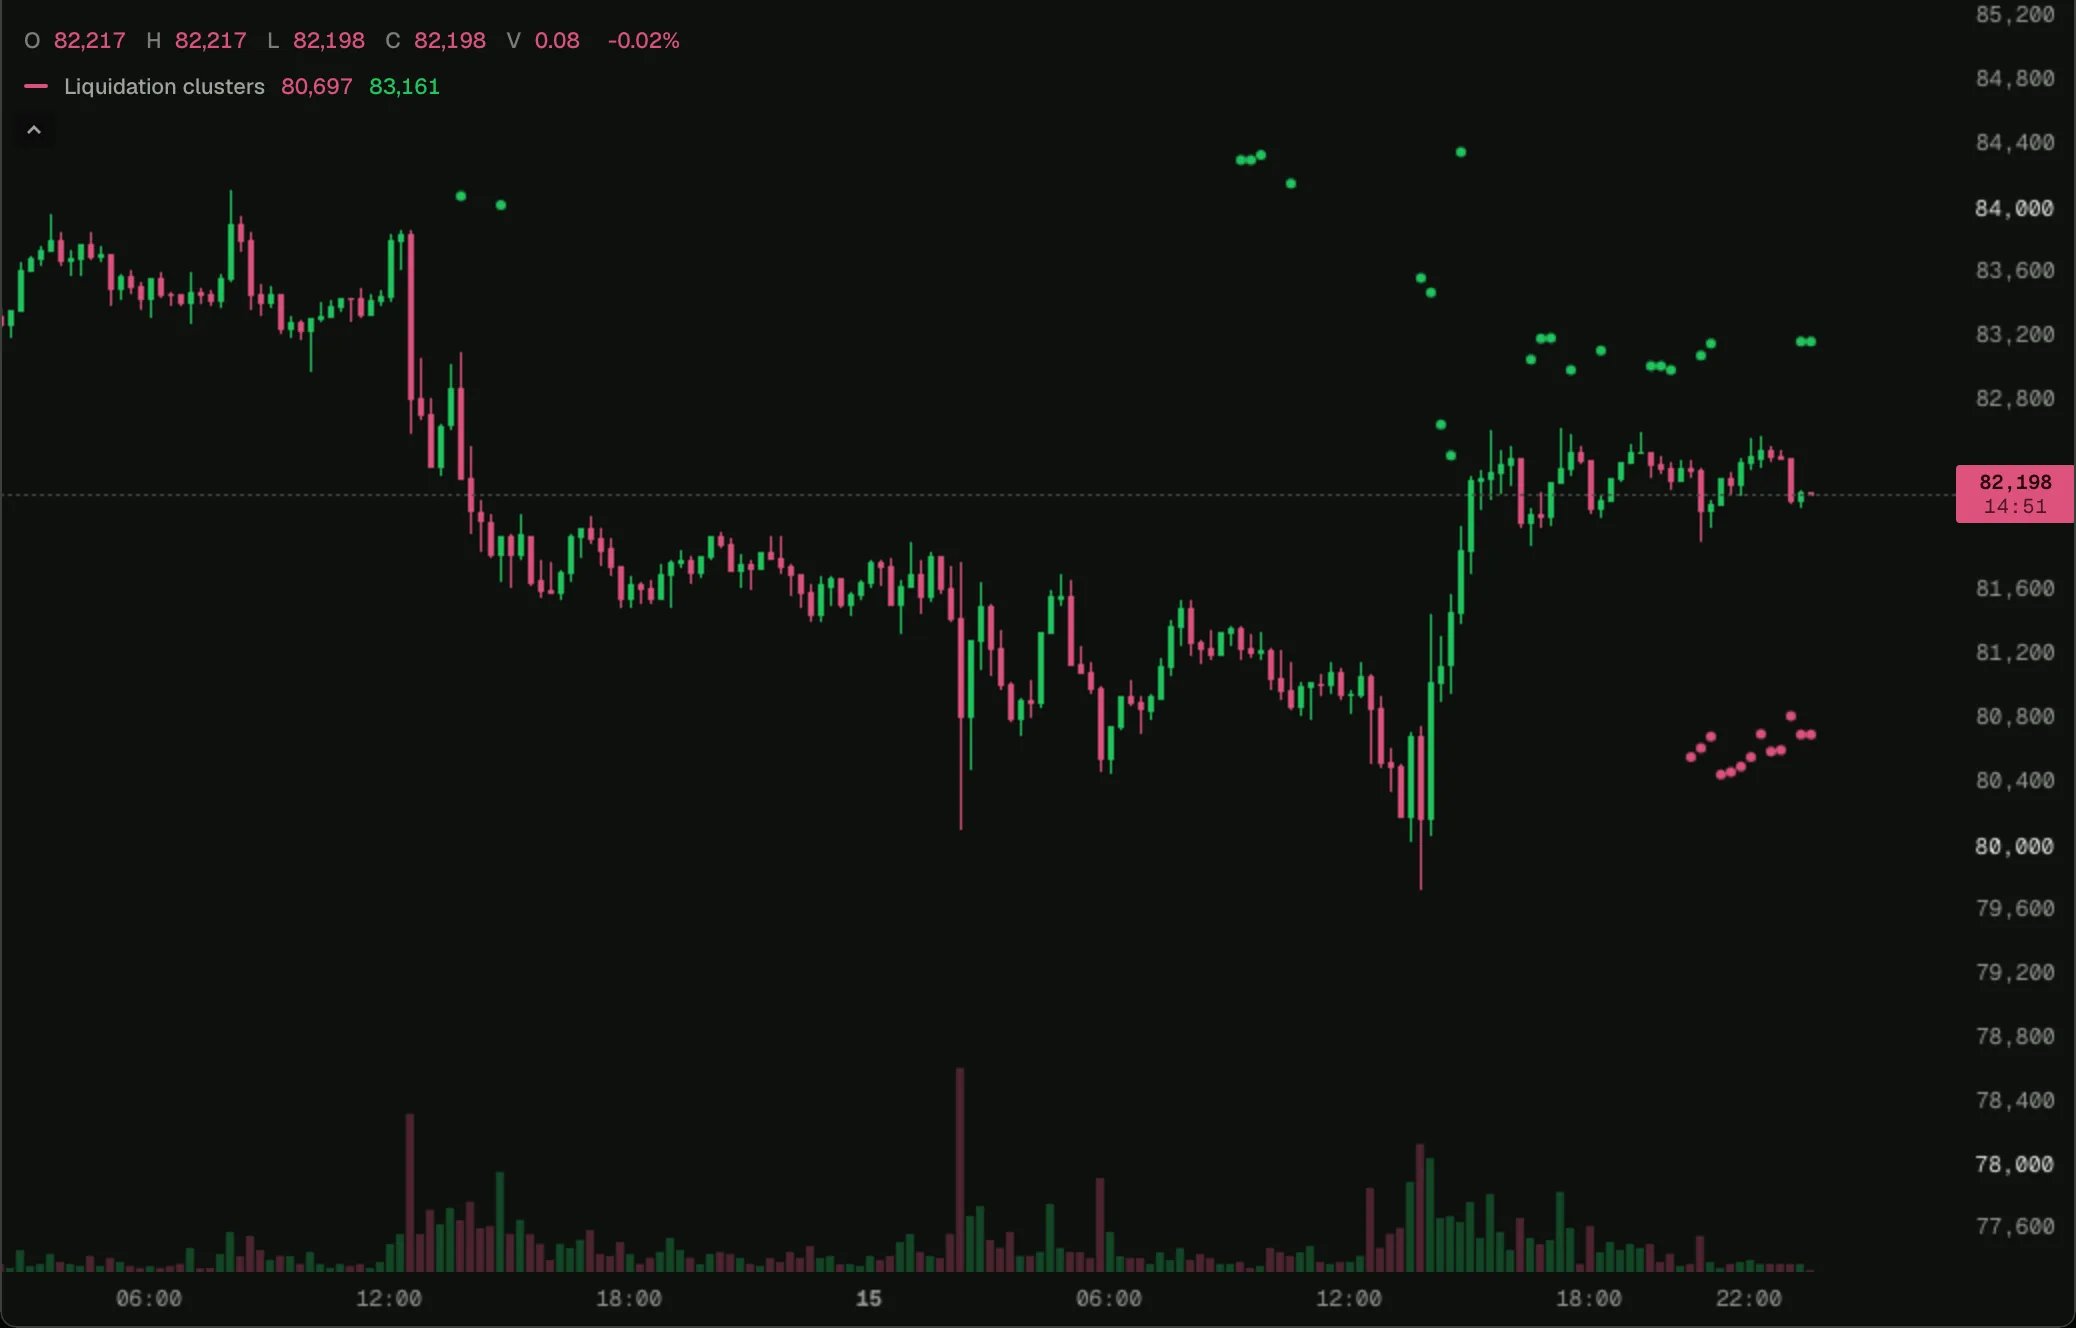 Load it on BTC 15m in the terminal, then change its settings or open it in the script editor.
On every bar, a dot at the price of the biggest cluster of long liquidations and of short liquidations, from the snapshot as of that bar. Watching the dots over time shows where the market's pain points sat and when price went to collect them.
## How it works
The dots use `autoscale: false`, so levels up to 10% away do not squash the candles into a line: they are drawn where they fall, and the parts outside the view are simply not seen. See [Liquidation levels ahead](/terminal/examples/liquidation-levels-ahead) for the newest snapshot drawn as lines.
## The script
```ts liquidation-clusters.ts theme={"theme":"github-dark"}
// The biggest cluster of long and short liquidations within 10% of the price, from the snapshot as of each bar.
// Clusters sit up to 10% away, so they leave the price scale to the candles (autoscale: false).
indicator('Liquidation clusters', { overlay: true });
const chart = bars();
const map = liquidationLevels();
const longs = plot.points('Long cluster', { color: color.down, autoscale: false });
const shorts = plot.points('Short cluster', { color: color.up, autoscale: false });
chart.onBar(() => {
let bestLong = 0;
let bestShort = 0;
let longAt = na;
let shortAt = na;
for (const level of map.levels()) {
if (level.longUsd > bestLong) { bestLong = level.longUsd; longAt = level.price; }
if (level.shortUsd > bestShort) { bestShort = level.shortUsd; shortAt = level.price; }
}
longs.set(longAt);
shorts.set(shortAt);
});
```
## Next step
See the next example, [Tape CVD](/terminal/examples/cvd).
This documentation is built and hosted on [Mintlify](https://mintlify.com), a developer documentation platform.
Load it on BTC 15m in the terminal, then change its settings or open it in the script editor.
On every bar, a dot at the price of the biggest cluster of long liquidations and of short liquidations, from the snapshot as of that bar. Watching the dots over time shows where the market's pain points sat and when price went to collect them.
## How it works
The dots use `autoscale: false`, so levels up to 10% away do not squash the candles into a line: they are drawn where they fall, and the parts outside the view are simply not seen. See [Liquidation levels ahead](/terminal/examples/liquidation-levels-ahead) for the newest snapshot drawn as lines.
## The script
```ts liquidation-clusters.ts theme={"theme":"github-dark"}
// The biggest cluster of long and short liquidations within 10% of the price, from the snapshot as of each bar.
// Clusters sit up to 10% away, so they leave the price scale to the candles (autoscale: false).
indicator('Liquidation clusters', { overlay: true });
const chart = bars();
const map = liquidationLevels();
const longs = plot.points('Long cluster', { color: color.down, autoscale: false });
const shorts = plot.points('Short cluster', { color: color.up, autoscale: false });
chart.onBar(() => {
let bestLong = 0;
let bestShort = 0;
let longAt = na;
let shortAt = na;
for (const level of map.levels()) {
if (level.longUsd > bestLong) { bestLong = level.longUsd; longAt = level.price; }
if (level.shortUsd > bestShort) { bestShort = level.shortUsd; shortAt = level.price; }
}
longs.set(longAt);
shorts.set(shortAt);
});
```
## Next step
See the next example, [Tape CVD](/terminal/examples/cvd).
This documentation is built and hosted on [Mintlify](https://mintlify.com), a developer documentation platform.