> ## Documentation Index
> Fetch the complete documentation index at: https://docs.0xarchive.io/llms.txt
> Use this file to discover all available pages before exploring further.
# Liquidation levels ahead
> Draw the biggest liquidation clusters above and below the price, and the balance of shorts above against longs below on every bar.
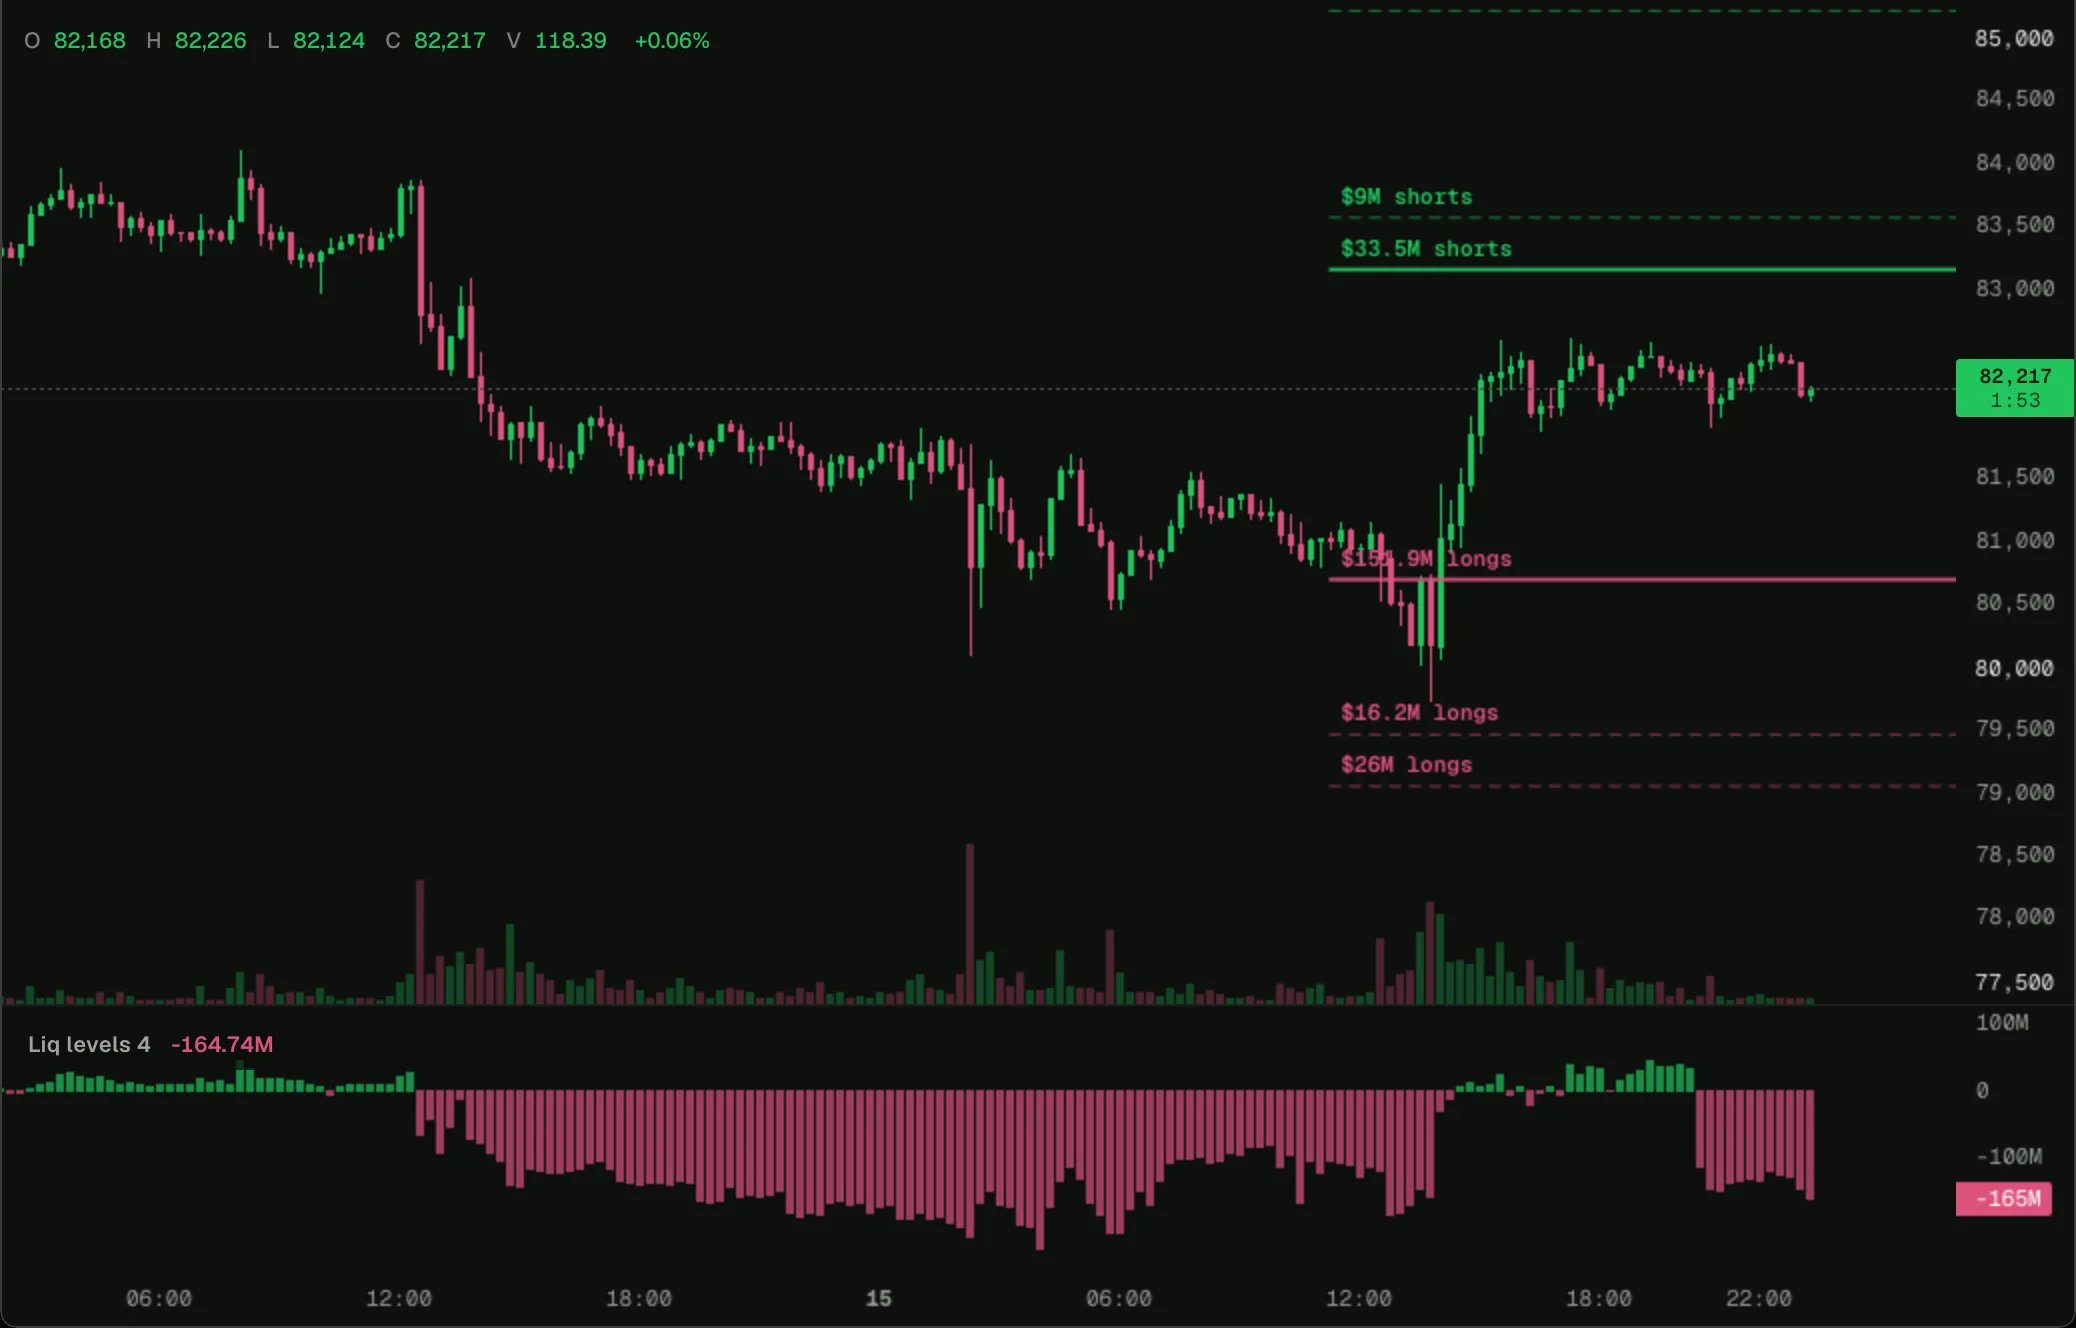 Load it on BTC 15m in the terminal, then change its settings or open it in the script editor.
0xArchive estimates where open positions would be liquidated, in 40 levels over 10% either side of the mark, about every 5 minutes. This script draws the three biggest clusters of shorts above the price and of longs below it, within 4%, as lines out to the right with their size. The solid line on each side is the biggest.
Under the candles, the bars are the balance within 4% of the price on each bar: USD of shorts above less USD of longs below. Above zero, more shorts sit close above than longs below.
## How it works
`liquidationLevels()` is a sample stream: read in a handler, it gives the snapshot as of that bar, so history never sees a later snapshot. The balance is computed on every bar; the lines and labels only on the newest bar. `maxLines` and `maxLabels` cap the drawings at six, so each bar's lines replace the last bar's.
Liquidation levels are Hyperliquid's, from 27 July 2026, kept for 7 days.
## Try changing
* Widen **Within** toward 10% to reach clusters further away; lines past the edge of the view are not seen.
* Fire an [alert](/terminal/guides/outputs#alerts) when the balance flips sign.
## The script
```ts liquidation-levels-ahead.ts theme={"theme":"github-dark"}
// Where the price would set off liquidations next, from 0xArchive's liquidation levels: the three
// biggest clusters of short positions above the price and of long positions below it, within
// `within` percent, as lines out to the right labelled with their size. Below the candles, the
// balance within the same distance on each bar: shorts above less longs below, from the snapshot
// as of that bar.
indicator('Liquidation levels ahead', { overlay: true, shortName: 'Liq levels', maxLines: 6, maxLabels: 6 });
const within = input.float('Within (%)', 4, { min: 0.5, max: 10, step: 0.5 });
const chart = bars();
const map = liquidationLevels();
const balance = plot.histogram('Shorts above less longs below $', { pane: 'balance' });
const SHOWN = 3;
// How far back the lines start, in bars; their labels sit there, clear of the price axis.
const BACK = 48;
chart.onBar(() => {
if (!map.available) return;
const price = chart.close;
const near = map.levels().filter((level) => Math.abs(level.price / price - 1) * 100 <= within);
let shortsAbove = 0;
let longsBelow = 0;
for (const level of near) {
if (level.price > price) shortsAbove += level.shortUsd;
else longsBelow += level.longUsd;
}
balance.set(shortsAbove - longsBelow, color.withAlpha(shortsAbove >= longsBelow ? color.up : color.down, 0.7));
if (!chart.isLast) return;
// Biggest first: shorts above the price, longs below.
const above = near.filter((level) => level.price > price && level.shortUsd > 0).sort((a, b) => b.shortUsd - a.shortUsd).slice(0, SHOWN);
const below = near.filter((level) => level.price < price && level.longUsd > 0).sort((a, b) => b.longUsd - a.longUsd).slice(0, SHOWN);
above.forEach((level, rank) => mark(level.price, level.shortUsd, 'shorts', color.up, rank));
below.forEach((level, rank) => mark(level.price, level.longUsd, 'longs', color.down, rank));
});
function mark(price: number, usd: number, side: string, ink: string, rank: number) {
draw.line({ from: { bar: chart.index - BACK, price }, to: { bar: chart.index, price }, extend: 'right', color: color.withAlpha(ink, rank === 0 ? 0.9 : 0.6), width: rank === 0 ? 2 : 1, style: rank === 0 ? 'solid' : 'dashed' });
// The label's lower-left corner on the line's start: it sits just above the line.
draw.label({ at: { bar: chart.index - BACK, price }, text: `${fmt.usd(usd)} ${side}`, style: 'lowerLeft', color: color.none, textColor: ink, size: 'small' });
}
```
## Next step
See the next example, [Large taker orders](/terminal/examples/large-takers).
This documentation is built and hosted on [Mintlify](https://mintlify.com), a developer documentation platform.
Load it on BTC 15m in the terminal, then change its settings or open it in the script editor.
0xArchive estimates where open positions would be liquidated, in 40 levels over 10% either side of the mark, about every 5 minutes. This script draws the three biggest clusters of shorts above the price and of longs below it, within 4%, as lines out to the right with their size. The solid line on each side is the biggest.
Under the candles, the bars are the balance within 4% of the price on each bar: USD of shorts above less USD of longs below. Above zero, more shorts sit close above than longs below.
## How it works
`liquidationLevels()` is a sample stream: read in a handler, it gives the snapshot as of that bar, so history never sees a later snapshot. The balance is computed on every bar; the lines and labels only on the newest bar. `maxLines` and `maxLabels` cap the drawings at six, so each bar's lines replace the last bar's.
Liquidation levels are Hyperliquid's, from 27 July 2026, kept for 7 days.
## Try changing
* Widen **Within** toward 10% to reach clusters further away; lines past the edge of the view are not seen.
* Fire an [alert](/terminal/guides/outputs#alerts) when the balance flips sign.
## The script
```ts liquidation-levels-ahead.ts theme={"theme":"github-dark"}
// Where the price would set off liquidations next, from 0xArchive's liquidation levels: the three
// biggest clusters of short positions above the price and of long positions below it, within
// `within` percent, as lines out to the right labelled with their size. Below the candles, the
// balance within the same distance on each bar: shorts above less longs below, from the snapshot
// as of that bar.
indicator('Liquidation levels ahead', { overlay: true, shortName: 'Liq levels', maxLines: 6, maxLabels: 6 });
const within = input.float('Within (%)', 4, { min: 0.5, max: 10, step: 0.5 });
const chart = bars();
const map = liquidationLevels();
const balance = plot.histogram('Shorts above less longs below $', { pane: 'balance' });
const SHOWN = 3;
// How far back the lines start, in bars; their labels sit there, clear of the price axis.
const BACK = 48;
chart.onBar(() => {
if (!map.available) return;
const price = chart.close;
const near = map.levels().filter((level) => Math.abs(level.price / price - 1) * 100 <= within);
let shortsAbove = 0;
let longsBelow = 0;
for (const level of near) {
if (level.price > price) shortsAbove += level.shortUsd;
else longsBelow += level.longUsd;
}
balance.set(shortsAbove - longsBelow, color.withAlpha(shortsAbove >= longsBelow ? color.up : color.down, 0.7));
if (!chart.isLast) return;
// Biggest first: shorts above the price, longs below.
const above = near.filter((level) => level.price > price && level.shortUsd > 0).sort((a, b) => b.shortUsd - a.shortUsd).slice(0, SHOWN);
const below = near.filter((level) => level.price < price && level.longUsd > 0).sort((a, b) => b.longUsd - a.longUsd).slice(0, SHOWN);
above.forEach((level, rank) => mark(level.price, level.shortUsd, 'shorts', color.up, rank));
below.forEach((level, rank) => mark(level.price, level.longUsd, 'longs', color.down, rank));
});
function mark(price: number, usd: number, side: string, ink: string, rank: number) {
draw.line({ from: { bar: chart.index - BACK, price }, to: { bar: chart.index, price }, extend: 'right', color: color.withAlpha(ink, rank === 0 ? 0.9 : 0.6), width: rank === 0 ? 2 : 1, style: rank === 0 ? 'solid' : 'dashed' });
// The label's lower-left corner on the line's start: it sits just above the line.
draw.label({ at: { bar: chart.index - BACK, price }, text: `${fmt.usd(usd)} ${side}`, style: 'lowerLeft', color: color.none, textColor: ink, size: 'small' });
}
```
## Next step
See the next example, [Large taker orders](/terminal/examples/large-takers).
This documentation is built and hosted on [Mintlify](https://mintlify.com), a developer documentation platform.