> ## Documentation Index
> Fetch the complete documentation index at: https://docs.0xarchive.io/llms.txt
> Use this file to discover all available pages before exploring further.
# Makers opening footprint
> Who absorbed the flow: the bid and ask makers who opened positions at each price.
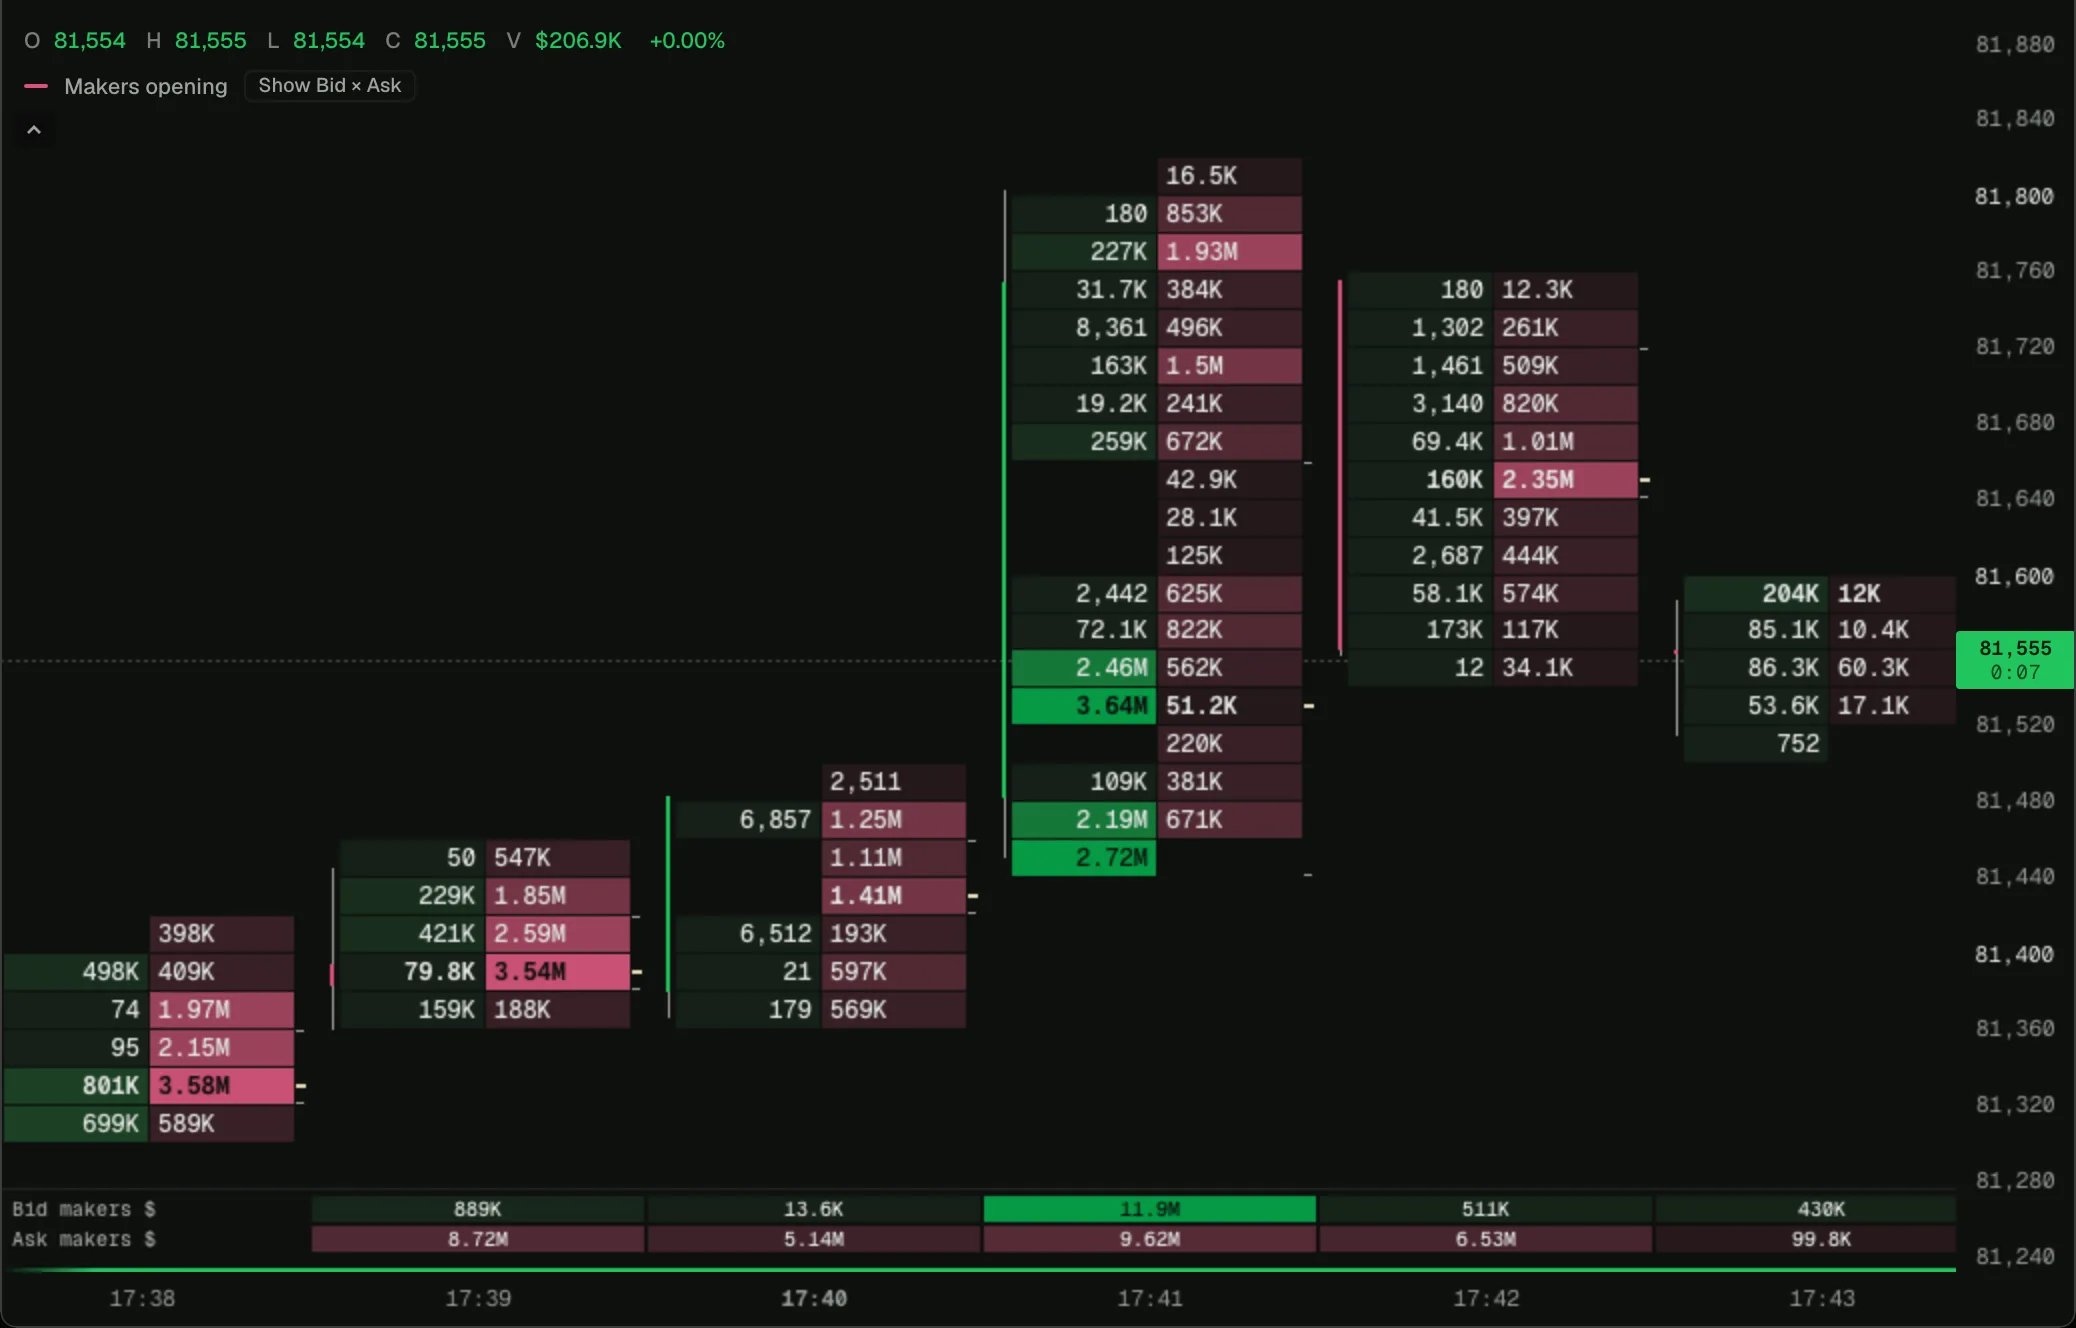 Load it on BTC 1m in the terminal, then change its settings or open it in the script editor.
The makers who took the other side of the trades and opened positions doing it, at each price: **bid makers opening longs** on the left, under the taker selling they absorbed, and **ask makers opening shorts** on the right. Where longs were liquidated into a price and bid makers opened longs at that same price, the absorption is read from positions, not guessed from delta.
The colours are the reverse of Bid × Ask: the left lane is buyers.
## How it works
Each fill's [`makerWhy`](/terminal/guides/order-flow#why-each-side-traded) says what the maker's position did. A taker sell fills a resting bid, so a maker opening a long there is a bid maker; a taker buy fills an ask. Market makers' legs are tagged too.
## Try changing
* Add the makers closing (`tp_short`, `stop_short` on the bid; `tp_long`, `stop_long` on the ask) as two more lanes.
## The script
```ts makers-opening-footprint.ts theme={"theme":"github-dark"}
// Who absorbed the flow: the makers who opened positions at each price, from each fill's `makerWhy`.
// A taker sell fills a resting bid, so bid makers opening longs are on the left; a taker buy fills an
// ask, so ask makers opening shorts are on the right. The colours are the reverse of Bid × Ask: the
// left lane is buyers.
indicator('Makers opening footprint', { overlay: true, shortName: 'Makers opening' });
const tape = trades();
const fp = plot.footprint('Makers opening', {
lanes: [
{ id: 'bidMakers', label: 'Bid makers opening longs', short: 'Bid makers', side: 'left', color: color.up },
{ id: 'askMakers', label: 'Ask makers opening shorts', short: 'Ask makers', side: 'right', color: color.down },
],
});
tape.onTrade((t) => {
const why = t.makerWhy;
if (t.side === 'sell' && (why === 'open_long' || why === 'flip_sl')) fp.add('bidMakers', t.price, t.size);
else if (t.side === 'buy' && (why === 'open_short' || why === 'flip_ls')) fp.add('askMakers', t.price, t.size);
});
```
## Next step
See the next example, [Session volume profile](/terminal/examples/session-volume-profile).
This documentation is built and hosted on [Mintlify](https://mintlify.com), a developer documentation platform.
Load it on BTC 1m in the terminal, then change its settings or open it in the script editor.
The makers who took the other side of the trades and opened positions doing it, at each price: **bid makers opening longs** on the left, under the taker selling they absorbed, and **ask makers opening shorts** on the right. Where longs were liquidated into a price and bid makers opened longs at that same price, the absorption is read from positions, not guessed from delta.
The colours are the reverse of Bid × Ask: the left lane is buyers.
## How it works
Each fill's [`makerWhy`](/terminal/guides/order-flow#why-each-side-traded) says what the maker's position did. A taker sell fills a resting bid, so a maker opening a long there is a bid maker; a taker buy fills an ask. Market makers' legs are tagged too.
## Try changing
* Add the makers closing (`tp_short`, `stop_short` on the bid; `tp_long`, `stop_long` on the ask) as two more lanes.
## The script
```ts makers-opening-footprint.ts theme={"theme":"github-dark"}
// Who absorbed the flow: the makers who opened positions at each price, from each fill's `makerWhy`.
// A taker sell fills a resting bid, so bid makers opening longs are on the left; a taker buy fills an
// ask, so ask makers opening shorts are on the right. The colours are the reverse of Bid × Ask: the
// left lane is buyers.
indicator('Makers opening footprint', { overlay: true, shortName: 'Makers opening' });
const tape = trades();
const fp = plot.footprint('Makers opening', {
lanes: [
{ id: 'bidMakers', label: 'Bid makers opening longs', short: 'Bid makers', side: 'left', color: color.up },
{ id: 'askMakers', label: 'Ask makers opening shorts', short: 'Ask makers', side: 'right', color: color.down },
],
});
tape.onTrade((t) => {
const why = t.makerWhy;
if (t.side === 'sell' && (why === 'open_long' || why === 'flip_sl')) fp.add('bidMakers', t.price, t.size);
else if (t.side === 'buy' && (why === 'open_short' || why === 'flip_ls')) fp.add('askMakers', t.price, t.size);
});
```
## Next step
See the next example, [Session volume profile](/terminal/examples/session-volume-profile).
This documentation is built and hosted on [Mintlify](https://mintlify.com), a developer documentation platform.