> ## Documentation Index
> Fetch the complete documentation index at: https://docs.0xarchive.io/llms.txt
> Use this file to discover all available pages before exploring further.
# Makers opening heat
> Who absorbed the flow, as zones: bid makers opening longs into selling and ask makers opening shorts into buying, at each price.
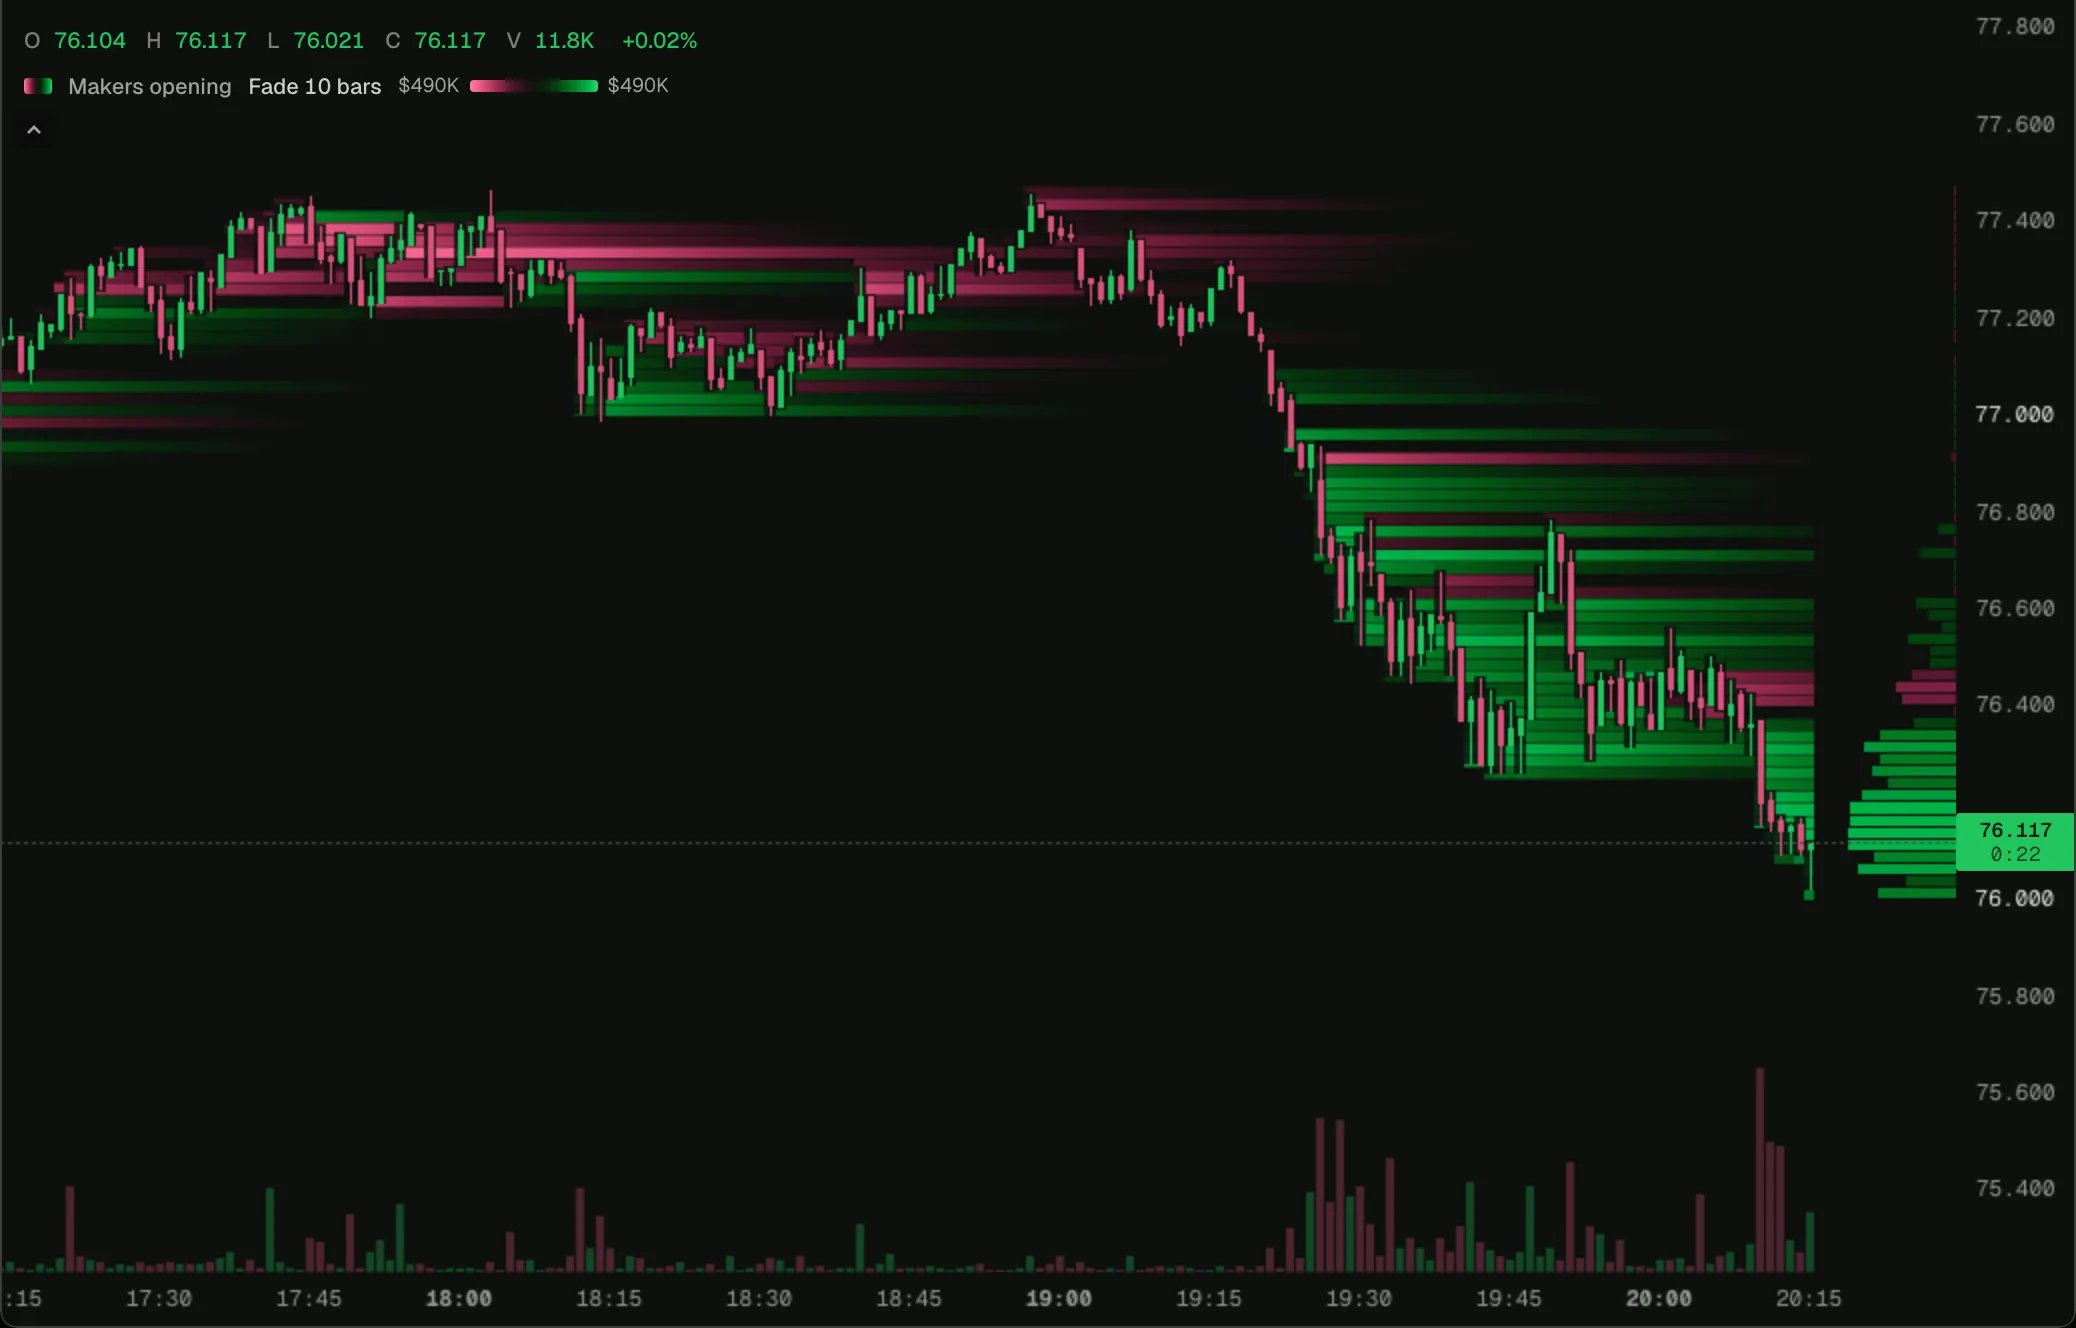 Load it on HYPE 1m in the terminal, then change its settings or open it in the script editor.
Absorption, read from positions: at each price, the **bid makers opening longs** (up colour), who took the other side of taker selling, against the **ask makers opening shorts** (down colour), who took the other side of taker buying. Through a drop, a band of up colour is passive buyers building longs into the selling.
## How it works
Each fill's [`makerWhy`](/terminal/guides/order-flow#why-each-side-traded) says what the maker's position did. A taker sell fills a resting bid, so a sell whose maker opened or flipped long is a bid maker opening; a taker buy fills an ask likewise. [`plot.heat`](/terminal/guides/outputs#heats) declares the two sides and nets them per row; the chart carries the values so the zones stay behind later candles.
## Try changing
* Count makers closing instead (`close_long`, `close_short`) to see who took profit into the move.
## The script
```ts makers-opening-heat.ts theme={"theme":"github-dark"}
// Who absorbed the flow, as zones: the makers who opened positions at each price, from each fill's
// `makerWhy`. A taker sell fills a resting bid, so bid makers opening longs absorbed selling; a taker
// buy fills an ask, so ask makers opening shorts absorbed buying. Each row draws its larger side, net.
indicator('Makers opening heat', { overlay: true, shortName: 'Makers opening' });
const tape = trades();
const heat = plot.heat('Makers opening', {
sides: [
{ id: 'askMakers', label: 'Ask makers opening shorts', color: color.down },
{ id: 'bidMakers', label: 'Bid makers opening longs', color: color.up },
],
});
tape.onTrade((t) => {
const why = t.makerWhy;
if (t.side === 'sell' && (why === 'open_long' || why === 'flip_sl')) heat.add('bidMakers', t.price, t.size);
else if (t.side === 'buy' && (why === 'open_short' || why === 'flip_ls')) heat.add('askMakers', t.price, t.size);
});
```
## Next step
See the next example, [Open interest heat](/terminal/examples/open-interest-heat).
This documentation is built and hosted on [Mintlify](https://mintlify.com), a developer documentation platform.
Load it on HYPE 1m in the terminal, then change its settings or open it in the script editor.
Absorption, read from positions: at each price, the **bid makers opening longs** (up colour), who took the other side of taker selling, against the **ask makers opening shorts** (down colour), who took the other side of taker buying. Through a drop, a band of up colour is passive buyers building longs into the selling.
## How it works
Each fill's [`makerWhy`](/terminal/guides/order-flow#why-each-side-traded) says what the maker's position did. A taker sell fills a resting bid, so a sell whose maker opened or flipped long is a bid maker opening; a taker buy fills an ask likewise. [`plot.heat`](/terminal/guides/outputs#heats) declares the two sides and nets them per row; the chart carries the values so the zones stay behind later candles.
## Try changing
* Count makers closing instead (`close_long`, `close_short`) to see who took profit into the move.
## The script
```ts makers-opening-heat.ts theme={"theme":"github-dark"}
// Who absorbed the flow, as zones: the makers who opened positions at each price, from each fill's
// `makerWhy`. A taker sell fills a resting bid, so bid makers opening longs absorbed selling; a taker
// buy fills an ask, so ask makers opening shorts absorbed buying. Each row draws its larger side, net.
indicator('Makers opening heat', { overlay: true, shortName: 'Makers opening' });
const tape = trades();
const heat = plot.heat('Makers opening', {
sides: [
{ id: 'askMakers', label: 'Ask makers opening shorts', color: color.down },
{ id: 'bidMakers', label: 'Bid makers opening longs', color: color.up },
],
});
tape.onTrade((t) => {
const why = t.makerWhy;
if (t.side === 'sell' && (why === 'open_long' || why === 'flip_sl')) heat.add('bidMakers', t.price, t.size);
else if (t.side === 'buy' && (why === 'open_short' || why === 'flip_ls')) heat.add('askMakers', t.price, t.size);
});
```
## Next step
See the next example, [Open interest heat](/terminal/examples/open-interest-heat).
This documentation is built and hosted on [Mintlify](https://mintlify.com), a developer documentation platform.