> ## Documentation Index
> Fetch the complete documentation index at: https://docs.0xarchive.io/llms.txt
> Use this file to discover all available pages before exploring further.
# Open bands
> Bands a set percentage above and below the day's open, kept out of the price scale.
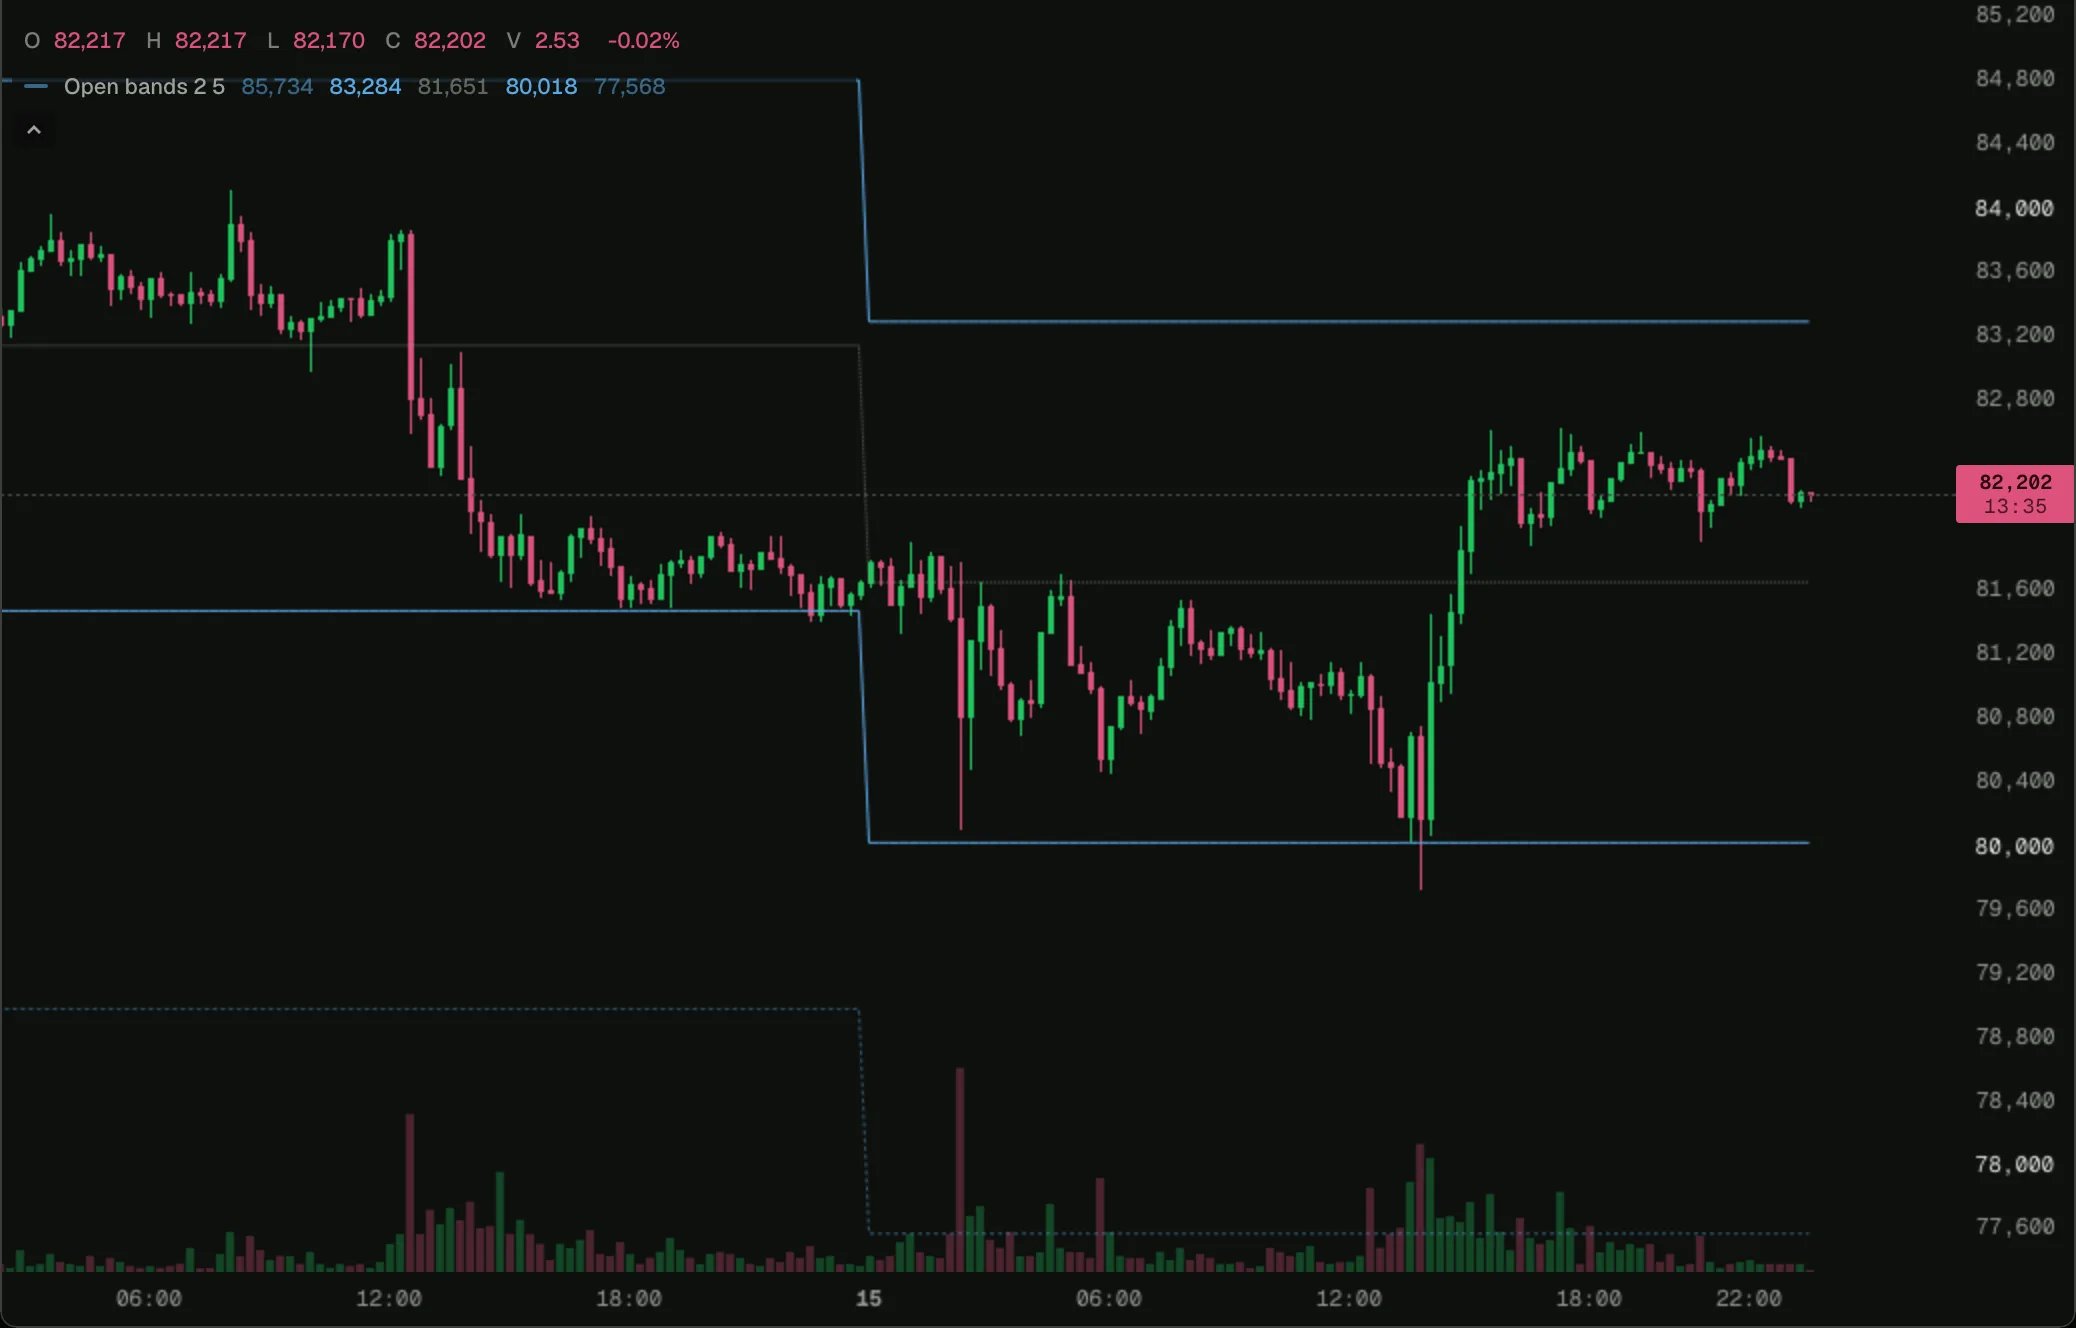 Load it on BTC 15m in the terminal, then change its settings or open it in the script editor.
Lines 2% and 5% above and below the day's open at 00:00 UTC, for how far the day has stretched.
## How it works
`clock.startOf(chart.time, 'day')` finds the day each bar belongs to. The bands use `autoscale: false`, so bands far from the price do not shrink the candles; switch on **Fit bands in view** to fit them.
## The script
```ts open-bands.ts theme={"theme":"github-dark"}
// Bands a set percentage above and below the day's open (00:00 UTC), for how far the day has
// stretched. Bands far from price are drawn where they fall, but unless "Fit bands in view" is
// on they do not stretch the price scale (autoscale: false), so the candles keep the view.
indicator('Open bands', { overlay: true });
const near = input.float('Near band (%)', 2, { min: 0.1, max: 50, step: 0.1 });
const far = input.float('Far band (%)', 5, { min: 0.1, max: 50, step: 0.1 });
const fit = input.bool('Fit bands in view', false);
const chart = bars();
const day = state.bar(na);
const open = state.bar(na);
const tone = color.study(12);
const farAbove = plot.line('Far above', { color: color.withAlpha(tone, 0.55), style: 'dashed', autoscale: fit });
const nearAbove = plot.line('Near above', { color: tone, autoscale: fit });
const dayOpen = plot.line('Open', { color: color.withAlpha(color.neutral, 0.6), style: 'dotted', autoscale: fit });
const nearBelow = plot.line('Near below', { color: tone, autoscale: fit });
const farBelow = plot.line('Far below', { color: color.withAlpha(tone, 0.55), style: 'dashed', autoscale: fit });
chart.onBar(() => {
const start = clock.startOf(chart.time, 'day');
if (start !== day.value) {
day.value = start;
open.value = chart.open;
}
const base = open.value;
farAbove.set(base * (1 + far / 100));
nearAbove.set(base * (1 + near / 100));
dayOpen.set(base);
nearBelow.set(base * (1 - near / 100));
farBelow.set(base * (1 - far / 100));
});
```
## Next step
See the next example, [Relative strength](/terminal/examples/relative-strength).
This documentation is built and hosted on [Mintlify](https://mintlify.com), a developer documentation platform.
Load it on BTC 15m in the terminal, then change its settings or open it in the script editor.
Lines 2% and 5% above and below the day's open at 00:00 UTC, for how far the day has stretched.
## How it works
`clock.startOf(chart.time, 'day')` finds the day each bar belongs to. The bands use `autoscale: false`, so bands far from the price do not shrink the candles; switch on **Fit bands in view** to fit them.
## The script
```ts open-bands.ts theme={"theme":"github-dark"}
// Bands a set percentage above and below the day's open (00:00 UTC), for how far the day has
// stretched. Bands far from price are drawn where they fall, but unless "Fit bands in view" is
// on they do not stretch the price scale (autoscale: false), so the candles keep the view.
indicator('Open bands', { overlay: true });
const near = input.float('Near band (%)', 2, { min: 0.1, max: 50, step: 0.1 });
const far = input.float('Far band (%)', 5, { min: 0.1, max: 50, step: 0.1 });
const fit = input.bool('Fit bands in view', false);
const chart = bars();
const day = state.bar(na);
const open = state.bar(na);
const tone = color.study(12);
const farAbove = plot.line('Far above', { color: color.withAlpha(tone, 0.55), style: 'dashed', autoscale: fit });
const nearAbove = plot.line('Near above', { color: tone, autoscale: fit });
const dayOpen = plot.line('Open', { color: color.withAlpha(color.neutral, 0.6), style: 'dotted', autoscale: fit });
const nearBelow = plot.line('Near below', { color: tone, autoscale: fit });
const farBelow = plot.line('Far below', { color: color.withAlpha(tone, 0.55), style: 'dashed', autoscale: fit });
chart.onBar(() => {
const start = clock.startOf(chart.time, 'day');
if (start !== day.value) {
day.value = start;
open.value = chart.open;
}
const base = open.value;
farAbove.set(base * (1 + far / 100));
nearAbove.set(base * (1 + near / 100));
dayOpen.set(base);
nearBelow.set(base * (1 - near / 100));
farBelow.set(base * (1 - far / 100));
});
```
## Next step
See the next example, [Relative strength](/terminal/examples/relative-strength).
This documentation is built and hosted on [Mintlify](https://mintlify.com), a developer documentation platform.