> ## Documentation Index
> Fetch the complete documentation index at: https://docs.0xarchive.io/llms.txt
> Use this file to discover all available pages before exploring further.
# Open interest heat
> Where open interest was built and where it was unwound, as zones behind the candles, from each fill's change in open interest.
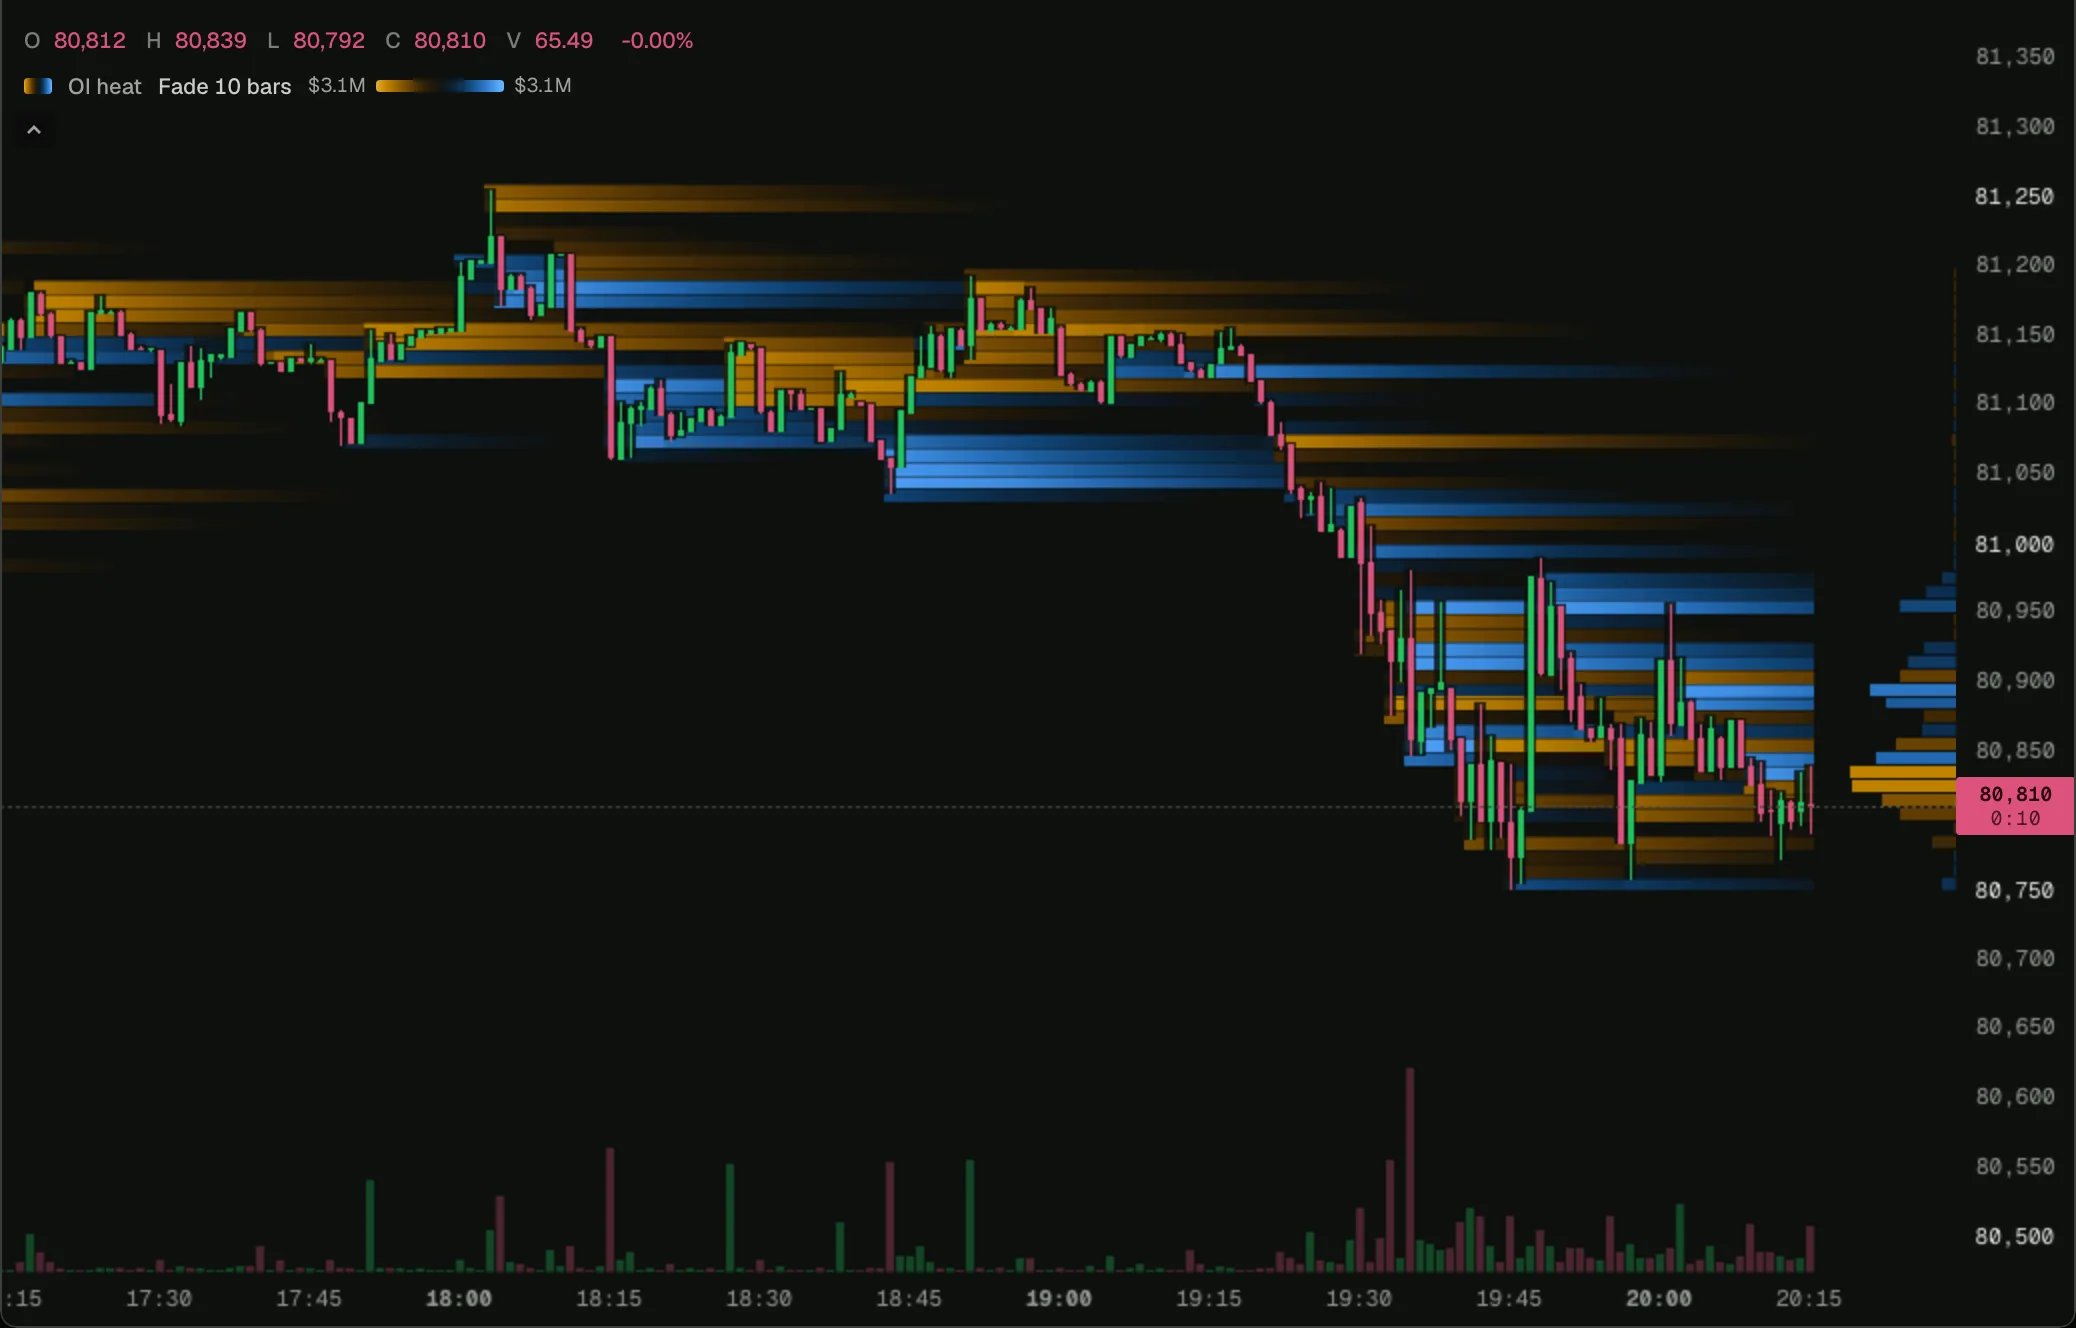 Load it on BTC 1m in the terminal, then change its settings or open it in the script editor.
At each price, open interest **built** (blue) against **unwound** (amber), netted by row. A sell-off reads amber all the way down as positions close; new positions opening at a top turn it blue. The colours are neither buy nor sell, since either side can do both. The [Open interest footprint](/terminal/examples/open-interest-footprint) shows the same bar by bar.
## How it works
Each fill's `oiDelta` is its change in the venue's open interest: above 0 where both sides opened, below where both closed, 0 where one opened and the other closed. [`plot.heat`](/terminal/guides/outputs#heats) declares two sides with the script's own colours, which the chart turns apart if a theme puts them close, and `heat.add` adds each fill's change at its price.
## Try changing
* `carry: { fade: 30 }` keeps the zones for longer by default.
## The script
```ts open-interest-heat.ts theme={"theme":"github-dark"}
// Where open interest was built and where it was unwound, as zones: each fill's `oiDelta`, its change
// in the venue's open interest, netted by price. Built is blue and unwound amber, so neither reads as
// buying or selling.
indicator('Open interest heat', { overlay: true, shortName: 'OI heat' });
const tape = trades();
const heat = plot.heat('Open interest change', {
sides: [
{ id: 'unwound', label: 'Unwound', color: '#e0a33a' },
{ id: 'built', label: 'Built', color: '#4f9cf0' },
],
});
tape.onTrade((t) => {
// `na` where the venue does not know; 0 where one side opened and the other closed.
const oi = t.oiDelta;
if (isNa(oi) || oi === 0) return;
if (oi > 0) heat.add('built', t.price, oi);
else heat.add('unwound', t.price, -oi);
});
```
## Next step
See the next example, [Session volume profile](/terminal/examples/session-volume-profile).
This documentation is built and hosted on [Mintlify](https://mintlify.com), a developer documentation platform.
Load it on BTC 1m in the terminal, then change its settings or open it in the script editor.
At each price, open interest **built** (blue) against **unwound** (amber), netted by row. A sell-off reads amber all the way down as positions close; new positions opening at a top turn it blue. The colours are neither buy nor sell, since either side can do both. The [Open interest footprint](/terminal/examples/open-interest-footprint) shows the same bar by bar.
## How it works
Each fill's `oiDelta` is its change in the venue's open interest: above 0 where both sides opened, below where both closed, 0 where one opened and the other closed. [`plot.heat`](/terminal/guides/outputs#heats) declares two sides with the script's own colours, which the chart turns apart if a theme puts them close, and `heat.add` adds each fill's change at its price.
## Try changing
* `carry: { fade: 30 }` keeps the zones for longer by default.
## The script
```ts open-interest-heat.ts theme={"theme":"github-dark"}
// Where open interest was built and where it was unwound, as zones: each fill's `oiDelta`, its change
// in the venue's open interest, netted by price. Built is blue and unwound amber, so neither reads as
// buying or selling.
indicator('Open interest heat', { overlay: true, shortName: 'OI heat' });
const tape = trades();
const heat = plot.heat('Open interest change', {
sides: [
{ id: 'unwound', label: 'Unwound', color: '#e0a33a' },
{ id: 'built', label: 'Built', color: '#4f9cf0' },
],
});
tape.onTrade((t) => {
// `na` where the venue does not know; 0 where one side opened and the other closed.
const oi = t.oiDelta;
if (isNa(oi) || oi === 0) return;
if (oi > 0) heat.add('built', t.price, oi);
else heat.add('unwound', t.price, -oi);
});
```
## Next step
See the next example, [Session volume profile](/terminal/examples/session-volume-profile).
This documentation is built and hosted on [Mintlify](https://mintlify.com), a developer documentation platform.