> ## Documentation Index
> Fetch the complete documentation index at: https://docs.0xarchive.io/llms.txt
> Use this file to discover all available pages before exploring further.
# Opening and closing flow
> Split taker flow into trades that opened positions and trades that closed them, from each trade's own change in open interest.
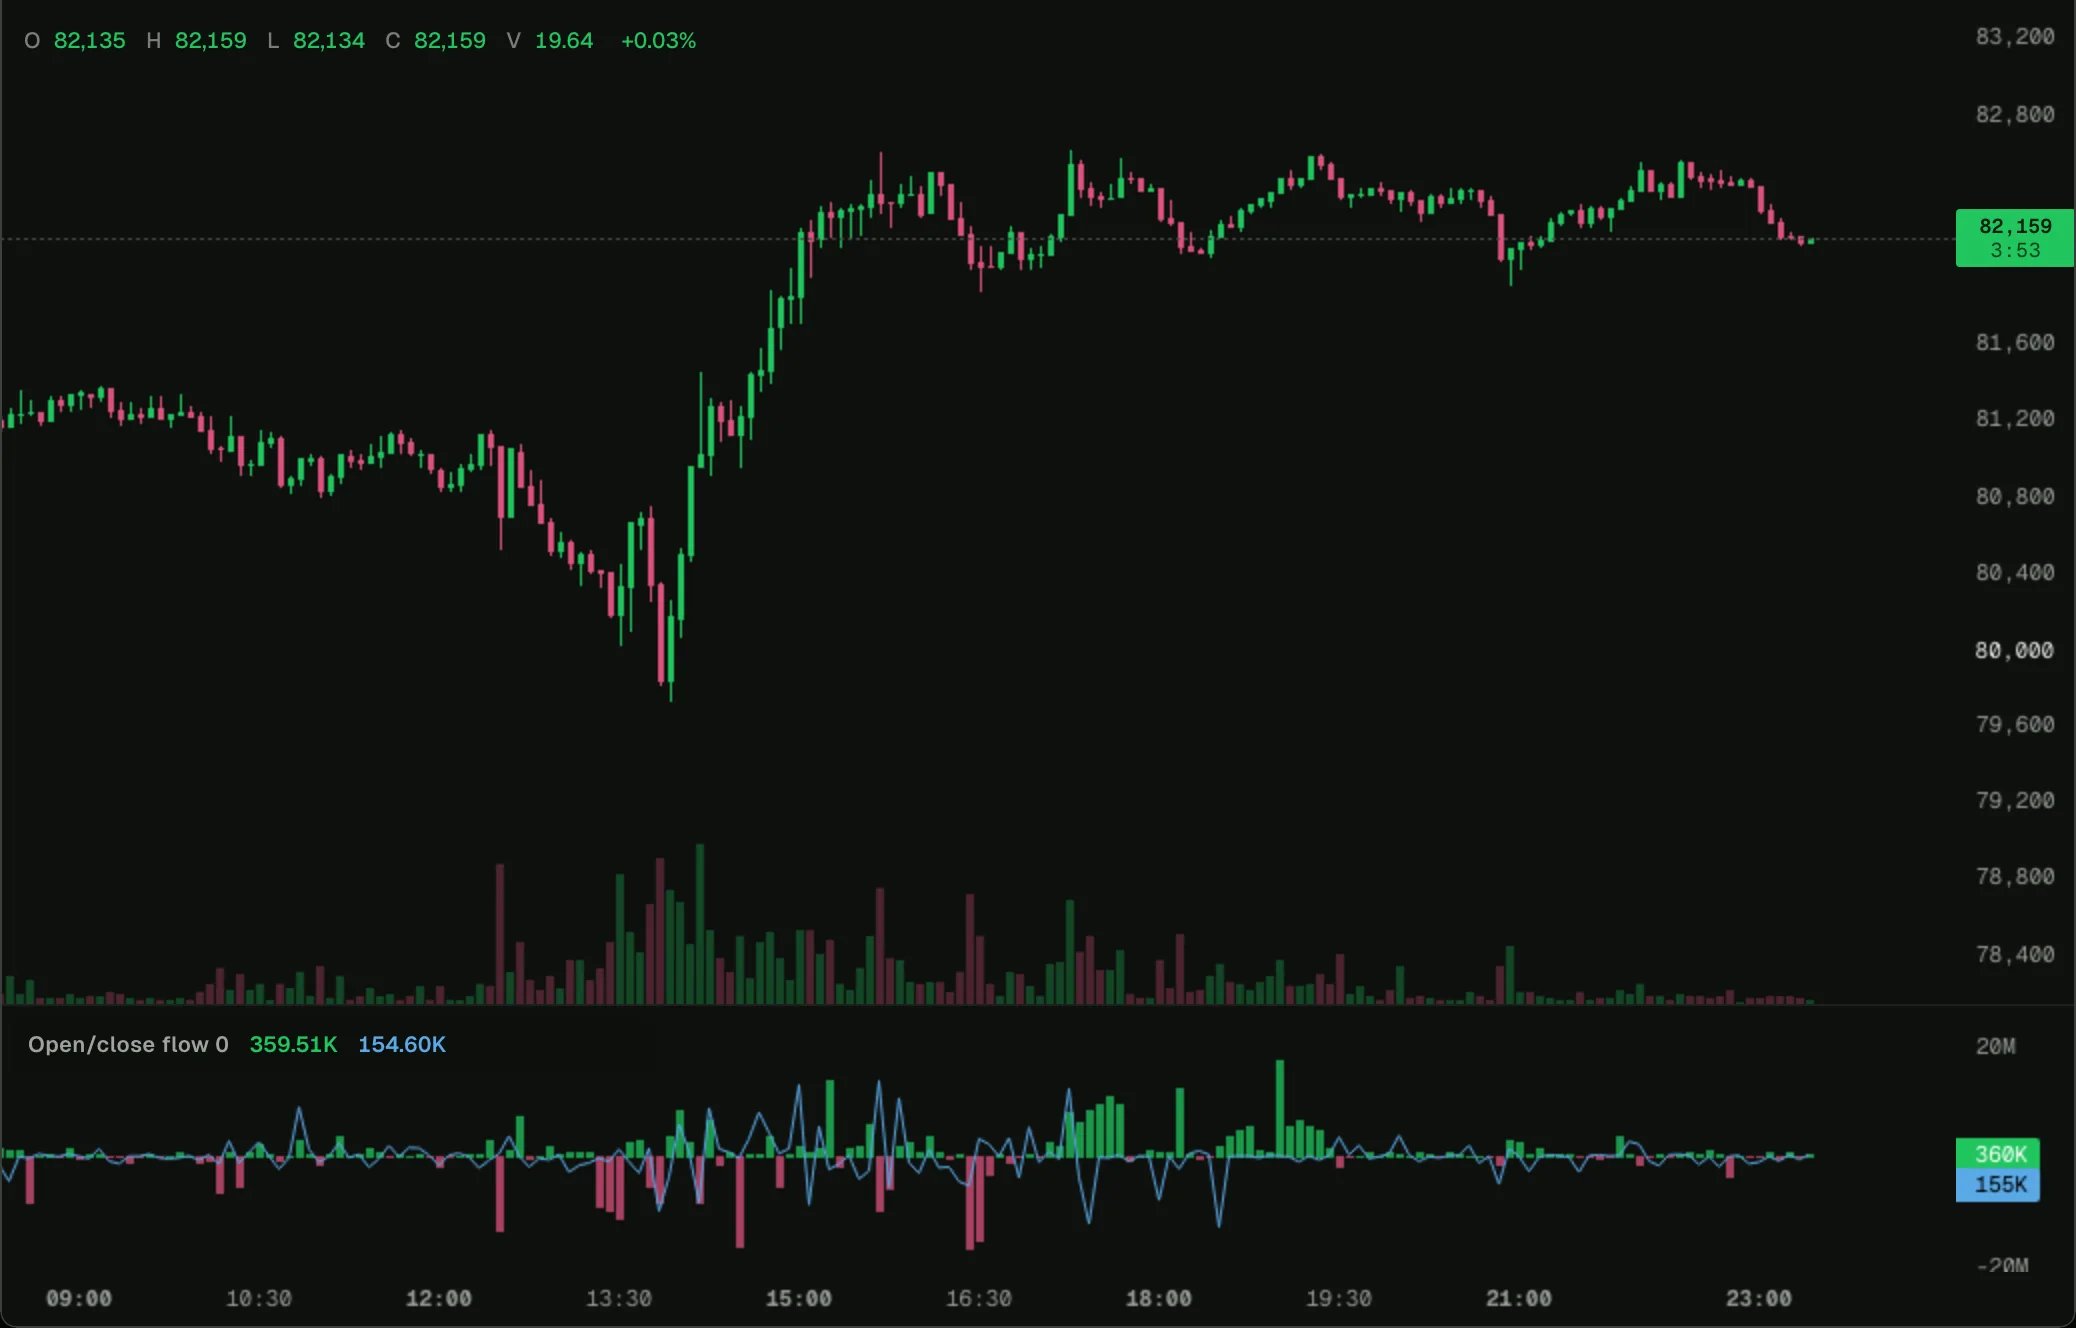 Load it on BTC 5m in the terminal, then change its settings or open it in the script editor.
Every trade on Hyperliquid, HIP-3 and Lighter changes open interest by a known amount, and 0xArchive records it on the print as `oiDelta`. Its sign says what the trade did:
| Taker trade | What happened |
| - | - |
| Buy, open interest up | A new long |
| Buy, open interest down | A short bought back |
| Sell, open interest up | A new short |
| Sell, open interest down | A long sold out |
The bars are **opening flow**: new longs less new shorts, in USD. The line is **closing flow**: shorts bought back less longs sold out. A rally on closing flow is shorts running for the exit; a rally on opening flow is new money taking a side.
## How it works
Two [tallies](/terminal/guides/state#tallies) collect the bar's trades as they arrive, one for each kind. A trade with an `oiDelta` of 0 moved no open interest (one side opened while the other closed), so it counts in neither. `tape.available` is false on bars older than the trade history, which reaches back to the start of the UTC day before yesterday, so those bars stay empty.
## Try changing
* Raise **Smallest trade** to see only the larger players' flow.
* Plot `opening.value + closing.value` as well: that is the bar's ordinary taker delta, which mixes both.
## The script
```ts opening-closing-flow.ts theme={"theme":"github-dark"}
// Taker flow split by what each trade did to open interest. A buy that raised open interest opened
// a long; a buy that lowered it closed a short. Opening flow is new longs less new shorts, closing
// flow is shorts bought back less longs sold out, in USD per bar: opening as the bars, closing as
// the line. From each trade's own change in open interest (`oiDelta`), which 0xArchive records on
// every print.
indicator('Opening and closing flow', { shortName: 'Open/close flow' });
const minUsd = input.float('Smallest trade ($)', 0, { min: 0 });
const chart = bars();
const tape = trades({ minNotional: minUsd });
const opening = tally();
const closing = tally();
const openingBars = plot.histogram('Opening flow $');
const closingLine = plot.line('Closing flow $', { color: color.study(12), width: 1 });
tape.onTrade((t) => {
// 0: one side opened and the other closed, so open interest did not move. na: the venue did not say.
if (isNa(t.oiDelta) || t.oiDelta === 0) return;
const usd = t.side === 'buy' ? t.notional : -t.notional;
(t.oiDelta > 0 ? opening : closing).add(usd);
});
chart.onBar(() => {
// Trades reach back to the start of the UTC day before yesterday; older bars stay empty.
if (!tape.available) return;
openingBars.set(opening.value, color.withAlpha(opening.value >= 0 ? color.up : color.down, 0.75));
closingLine.set(closing.value);
});
```
## Next step
See the next example, [Squeeze or new positions](/terminal/examples/squeeze-or-new-positions).
This documentation is built and hosted on [Mintlify](https://mintlify.com), a developer documentation platform.
Load it on BTC 5m in the terminal, then change its settings or open it in the script editor.
Every trade on Hyperliquid, HIP-3 and Lighter changes open interest by a known amount, and 0xArchive records it on the print as `oiDelta`. Its sign says what the trade did:
| Taker trade | What happened |
| - | - |
| Buy, open interest up | A new long |
| Buy, open interest down | A short bought back |
| Sell, open interest up | A new short |
| Sell, open interest down | A long sold out |
The bars are **opening flow**: new longs less new shorts, in USD. The line is **closing flow**: shorts bought back less longs sold out. A rally on closing flow is shorts running for the exit; a rally on opening flow is new money taking a side.
## How it works
Two [tallies](/terminal/guides/state#tallies) collect the bar's trades as they arrive, one for each kind. A trade with an `oiDelta` of 0 moved no open interest (one side opened while the other closed), so it counts in neither. `tape.available` is false on bars older than the trade history, which reaches back to the start of the UTC day before yesterday, so those bars stay empty.
## Try changing
* Raise **Smallest trade** to see only the larger players' flow.
* Plot `opening.value + closing.value` as well: that is the bar's ordinary taker delta, which mixes both.
## The script
```ts opening-closing-flow.ts theme={"theme":"github-dark"}
// Taker flow split by what each trade did to open interest. A buy that raised open interest opened
// a long; a buy that lowered it closed a short. Opening flow is new longs less new shorts, closing
// flow is shorts bought back less longs sold out, in USD per bar: opening as the bars, closing as
// the line. From each trade's own change in open interest (`oiDelta`), which 0xArchive records on
// every print.
indicator('Opening and closing flow', { shortName: 'Open/close flow' });
const minUsd = input.float('Smallest trade ($)', 0, { min: 0 });
const chart = bars();
const tape = trades({ minNotional: minUsd });
const opening = tally();
const closing = tally();
const openingBars = plot.histogram('Opening flow $');
const closingLine = plot.line('Closing flow $', { color: color.study(12), width: 1 });
tape.onTrade((t) => {
// 0: one side opened and the other closed, so open interest did not move. na: the venue did not say.
if (isNa(t.oiDelta) || t.oiDelta === 0) return;
const usd = t.side === 'buy' ? t.notional : -t.notional;
(t.oiDelta > 0 ? opening : closing).add(usd);
});
chart.onBar(() => {
// Trades reach back to the start of the UTC day before yesterday; older bars stay empty.
if (!tape.available) return;
openingBars.set(opening.value, color.withAlpha(opening.value >= 0 ? color.up : color.down, 0.75));
closingLine.set(closing.value);
});
```
## Next step
See the next example, [Squeeze or new positions](/terminal/examples/squeeze-or-new-positions).
This documentation is built and hosted on [Mintlify](https://mintlify.com), a developer documentation platform.