> ## Documentation Index
> Fetch the complete documentation index at: https://docs.0xarchive.io/llms.txt
> Use this file to discover all available pages before exploring further.
# Relative strength
> The chart's market against another, both rebased to 100.
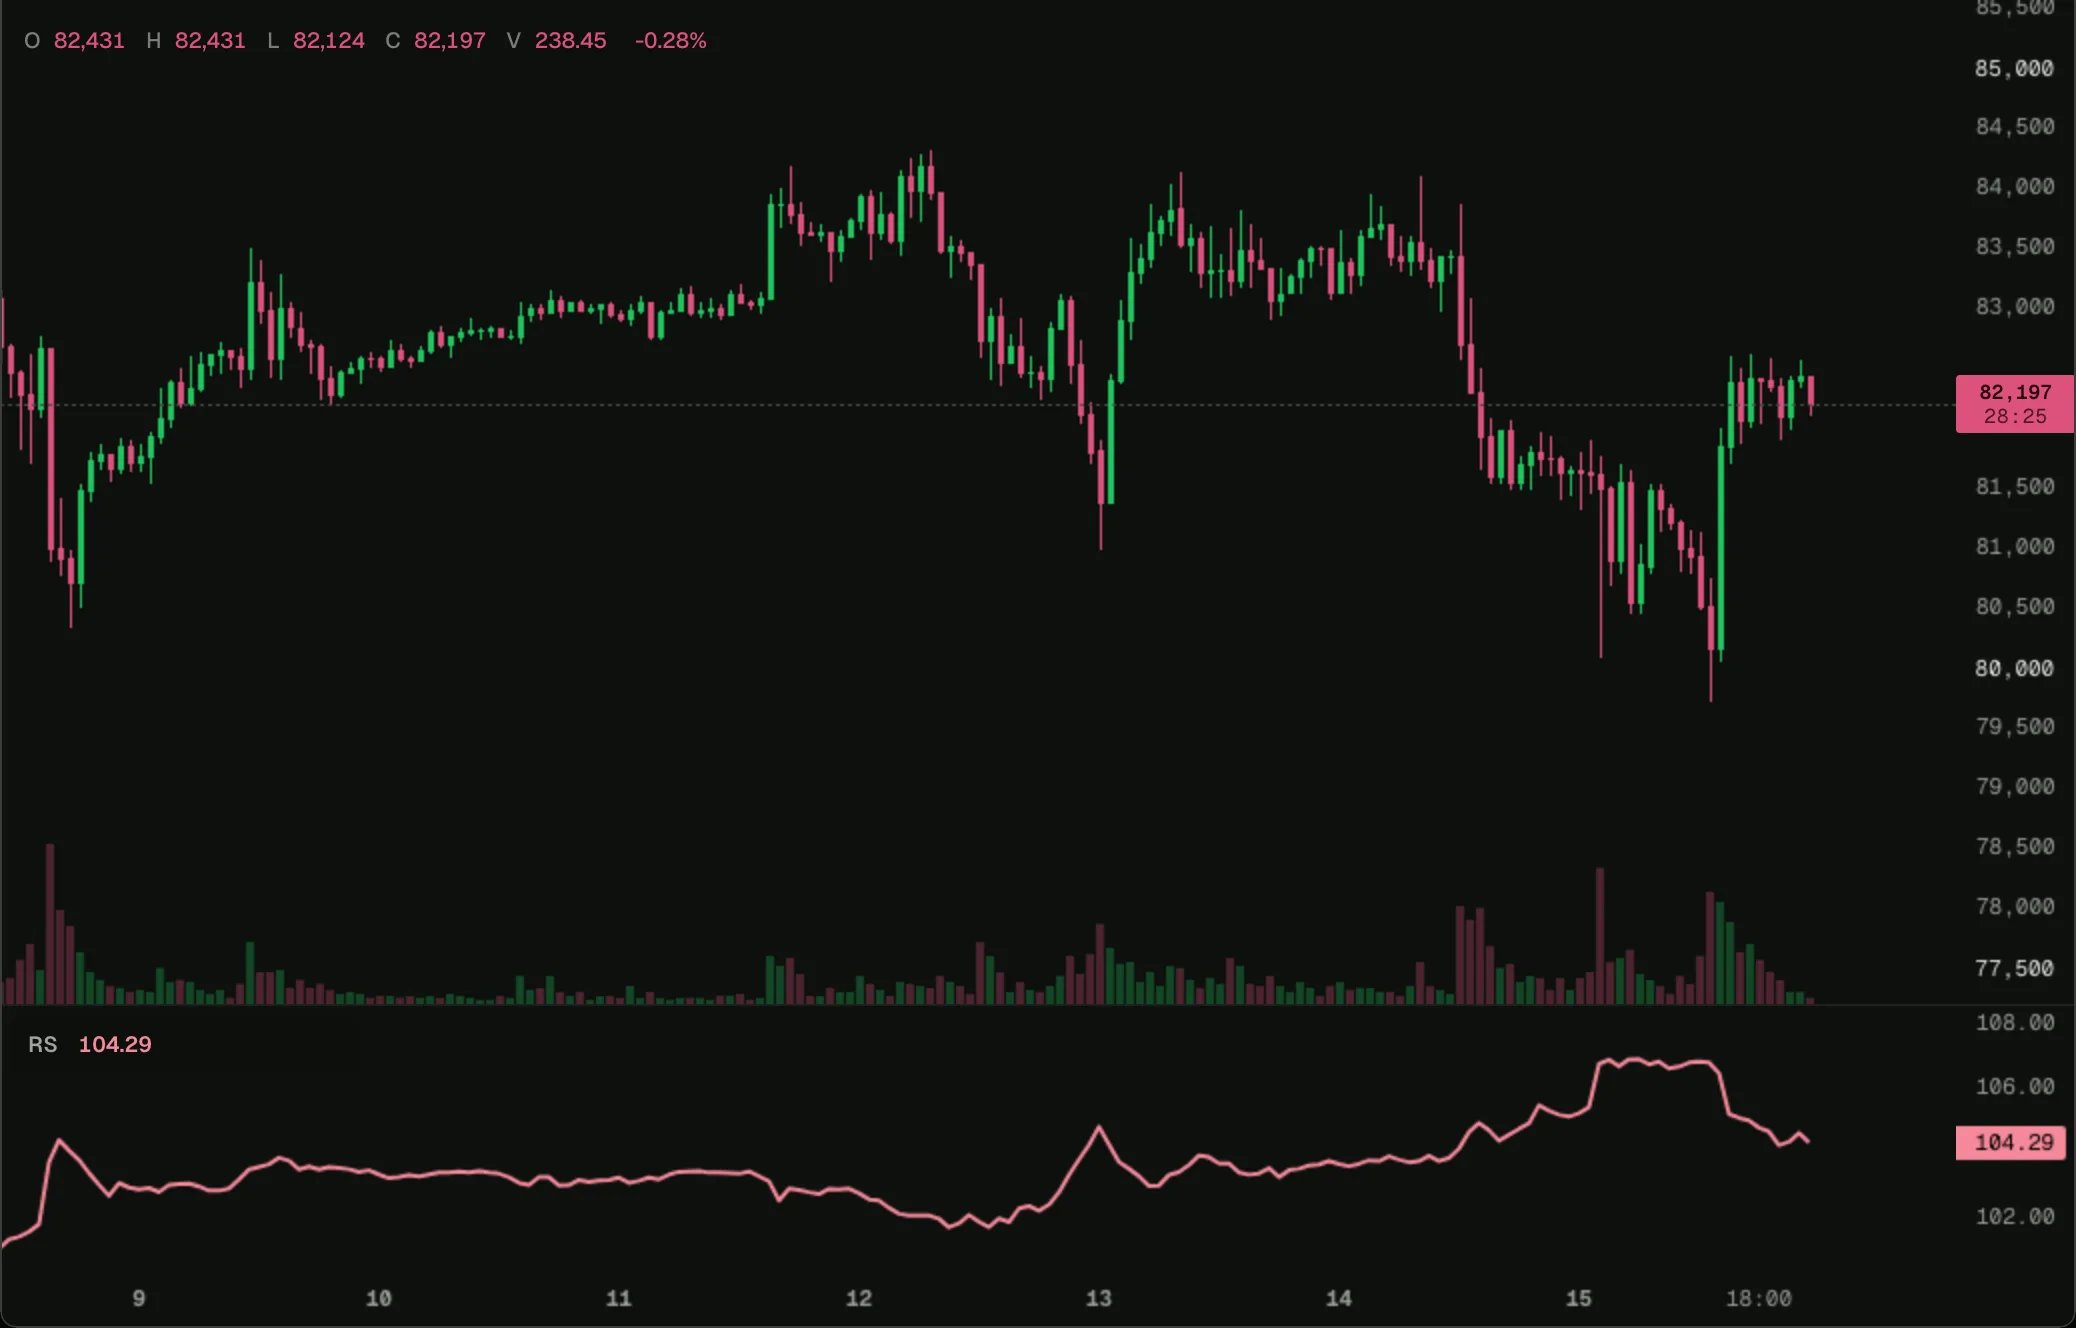 Load it on BTC 1h in the terminal, then change its settings or open it in the script editor.
The chart's market divided by another (ETH by default), rebased to 100 at the first bar they share. Above 100, the chart's market has done better since then.
## How it works
`input.market` picks the other market, and `bars({ market })` reads its bars on the chart's interval. Each stream reads the other as of the same moment, so the two line up bar for bar.
## The script
```ts relative-strength.ts theme={"theme":"github-dark"}
// The chart's market against another, both rebased to 100 at the first bar they share: above
// 100 the chart's market has done better since then. Against ETH by default, so BTC and HYPE,
// the charts most often open, read against something else; on an ETH chart, or with "Chart" in
// the market setting, it compares the market with itself, a flat line at 100.
indicator('Relative strength', { shortName: 'RS', precision: 2 });
const against = input.market('Against', 'ETH');
const chart = bars();
const other = bars(against === null ? {} : { market: against });
const base = state.bar(na);
const ratio = plot.line('Relative strength', { width: 2 });
const par = plot.level('Par', 100, { style: 'dashed' });
chart.onBar(() => {
if (isNa(other.close) || other.close === 0) return;
const value = chart.close / other.close;
if (isNa(base.value)) base.value = value;
ratio.set((100 * value) / base.value);
});
```
## Next step
See the next example, [Trend bars](/terminal/examples/trend-bars).
This documentation is built and hosted on [Mintlify](https://mintlify.com), a developer documentation platform.
Load it on BTC 1h in the terminal, then change its settings or open it in the script editor.
The chart's market divided by another (ETH by default), rebased to 100 at the first bar they share. Above 100, the chart's market has done better since then.
## How it works
`input.market` picks the other market, and `bars({ market })` reads its bars on the chart's interval. Each stream reads the other as of the same moment, so the two line up bar for bar.
## The script
```ts relative-strength.ts theme={"theme":"github-dark"}
// The chart's market against another, both rebased to 100 at the first bar they share: above
// 100 the chart's market has done better since then. Against ETH by default, so BTC and HYPE,
// the charts most often open, read against something else; on an ETH chart, or with "Chart" in
// the market setting, it compares the market with itself, a flat line at 100.
indicator('Relative strength', { shortName: 'RS', precision: 2 });
const against = input.market('Against', 'ETH');
const chart = bars();
const other = bars(against === null ? {} : { market: against });
const base = state.bar(na);
const ratio = plot.line('Relative strength', { width: 2 });
const par = plot.level('Par', 100, { style: 'dashed' });
chart.onBar(() => {
if (isNa(other.close) || other.close === 0) return;
const value = chart.close / other.close;
if (isNa(base.value)) base.value = value;
ratio.set((100 * value) / base.value);
});
```
## Next step
See the next example, [Trend bars](/terminal/examples/trend-bars).
This documentation is built and hosted on [Mintlify](https://mintlify.com), a developer documentation platform.