> ## Documentation Index
> Fetch the complete documentation index at: https://docs.0xarchive.io/llms.txt
> Use this file to discover all available pages before exploring further.
# RSI cross
> An RSI with a mark where it crosses up through 30, written the way the Pine translation writes it.
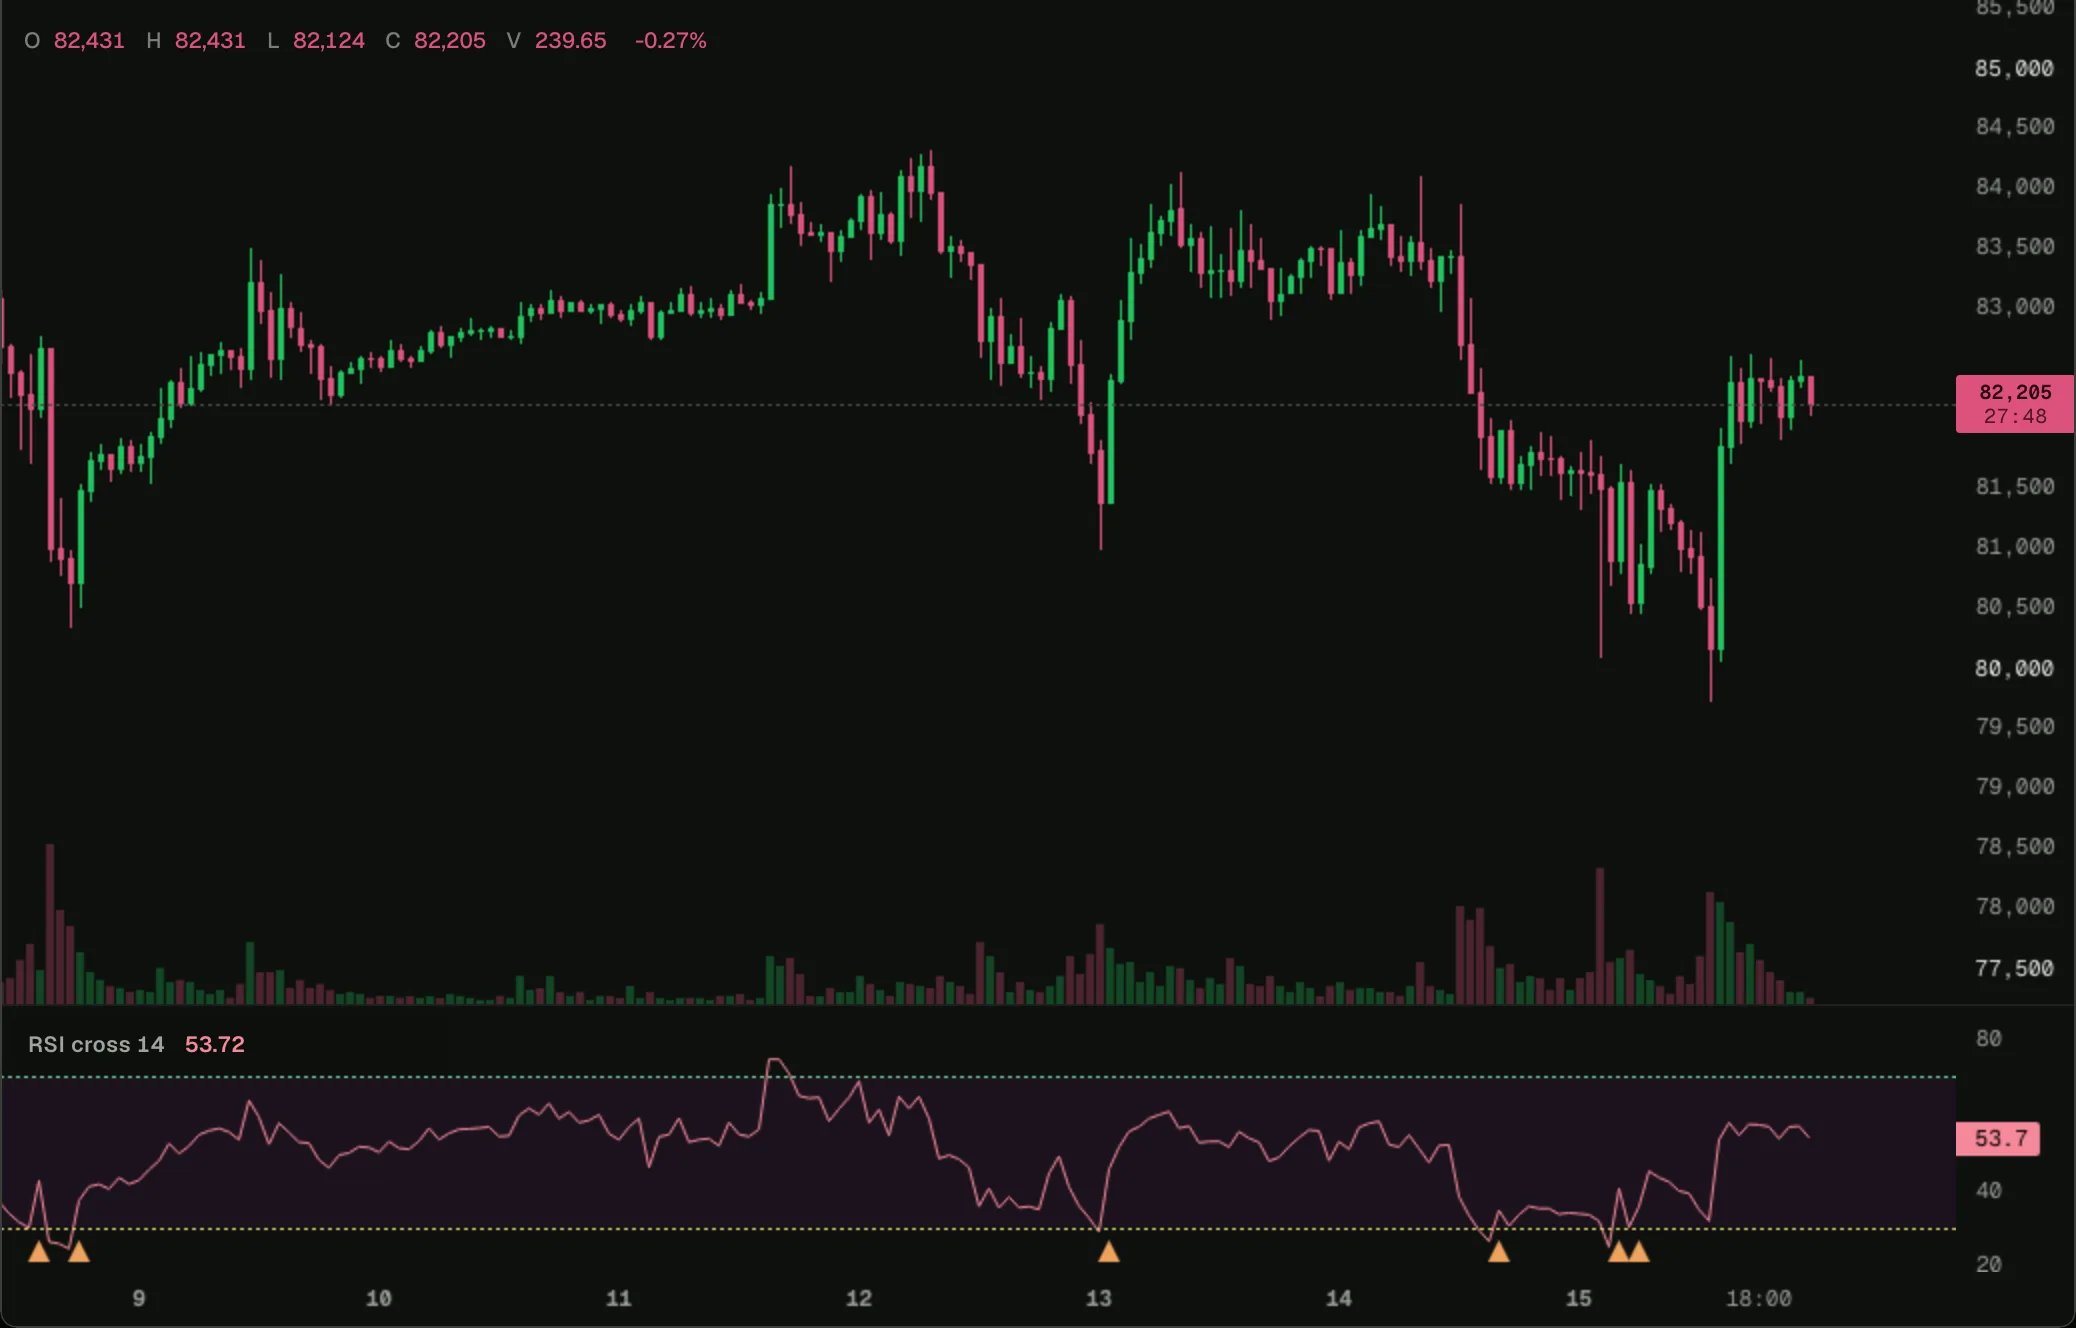 Load it on BTC 1h in the terminal, then change its settings or open it in the script editor.
An RSI in its own pane, with dashed levels at 30 and 70, the band between them shaded, and a triangle where the RSI crosses up through 30.
## How it works
This is what the [Pine translation](/terminal/guides/pine) makes of a small Pine script, shown at the top of the source. Each Pine call to a stateful function, such as `ta.crossover`, becomes an instance of its own, because each call keeps its own history.
## The script
```ts rsi-cross.ts theme={"theme":"github-dark"}
// What the Pine front end would emit for a small RSI script (docs/scripting.md, "Pine").
//
// //@version=5
// indicator("RSI cross")
// len = input.int(14, "Length")
// r = ta.rsi(close, len)
// var int crosses = 0
// if ta.crossover(r, 30)
// crosses += 1
// plot(r, "RSI")
// plotshape(ta.crossover(r, 30), "Up", shape.triangleup, location.bottom)
// lower = hline(30, "Oversold")
// upper = hline(70, "Overbought")
// fill(upper, lower, color=color.new(color.purple, 90))
indicator('RSI cross');
const len = input.int('Length', 14);
const chart = bars();
const rsi = ta.rsi(len);
const crossInIf = ta.crossover();
const crossInPlot = ta.crossover();
const crosses = state.bar(0);
const history = series(2);
const p0 = plot.line('RSI');
const s0 = plot.shape('Up', { shape: 'triangleUp', location: 'bottom' });
const lower = plot.level('Oversold', 30, { style: 'dashed' });
const upper = plot.level('Overbought', 70, { style: 'dashed' });
const band = plot.fill('Band', upper, lower, { color: '#9c27b01a' });
chart.onBar(() => {
const r = rsi.update(chart.close);
history.set(r);
if (crossInIf.update(r, 30)) crosses.value += 1;
p0.set(r);
s0.set(crossInPlot.update(r, 30));
});
```
## Next step
See the next example, [RSI cross, pasted Pine](/terminal/examples/rsi-pine).
This documentation is built and hosted on [Mintlify](https://mintlify.com), a developer documentation platform.
Load it on BTC 1h in the terminal, then change its settings or open it in the script editor.
An RSI in its own pane, with dashed levels at 30 and 70, the band between them shaded, and a triangle where the RSI crosses up through 30.
## How it works
This is what the [Pine translation](/terminal/guides/pine) makes of a small Pine script, shown at the top of the source. Each Pine call to a stateful function, such as `ta.crossover`, becomes an instance of its own, because each call keeps its own history.
## The script
```ts rsi-cross.ts theme={"theme":"github-dark"}
// What the Pine front end would emit for a small RSI script (docs/scripting.md, "Pine").
//
// //@version=5
// indicator("RSI cross")
// len = input.int(14, "Length")
// r = ta.rsi(close, len)
// var int crosses = 0
// if ta.crossover(r, 30)
// crosses += 1
// plot(r, "RSI")
// plotshape(ta.crossover(r, 30), "Up", shape.triangleup, location.bottom)
// lower = hline(30, "Oversold")
// upper = hline(70, "Overbought")
// fill(upper, lower, color=color.new(color.purple, 90))
indicator('RSI cross');
const len = input.int('Length', 14);
const chart = bars();
const rsi = ta.rsi(len);
const crossInIf = ta.crossover();
const crossInPlot = ta.crossover();
const crosses = state.bar(0);
const history = series(2);
const p0 = plot.line('RSI');
const s0 = plot.shape('Up', { shape: 'triangleUp', location: 'bottom' });
const lower = plot.level('Oversold', 30, { style: 'dashed' });
const upper = plot.level('Overbought', 70, { style: 'dashed' });
const band = plot.fill('Band', upper, lower, { color: '#9c27b01a' });
chart.onBar(() => {
const r = rsi.update(chart.close);
history.set(r);
if (crossInIf.update(r, 30)) crosses.value += 1;
p0.set(r);
s0.set(crossInPlot.update(r, 30));
});
```
## Next step
See the next example, [RSI cross, pasted Pine](/terminal/examples/rsi-pine).
This documentation is built and hosted on [Mintlify](https://mintlify.com), a developer documentation platform.