> ## Documentation Index
> Fetch the complete documentation index at: https://docs.0xarchive.io/llms.txt
> Use this file to discover all available pages before exploring further.
# Return after RSI
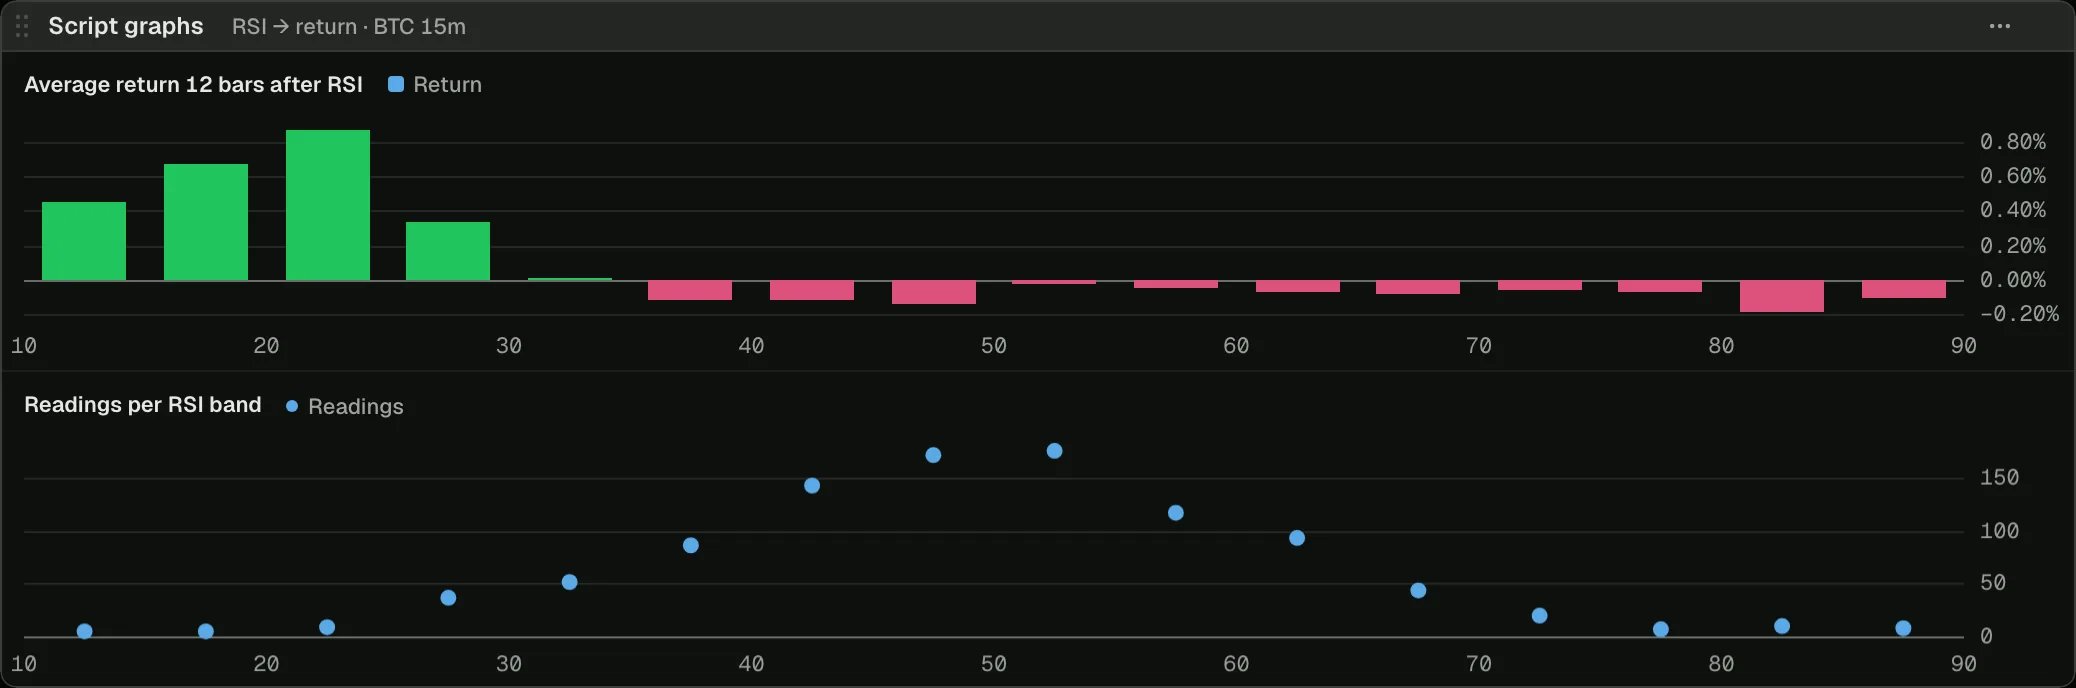
> The average return over the next bars after each RSI band, with how many readings each band had, in graphs of their own.
 Load it on BTC 15m in the terminal, then change its settings or open it in the script editor.
What came after an RSI reading on this market: for each band of RSI five points wide, the average return over the next 12 bars, green where it rose and red where it fell, and a second graph of how many readings each band had. RSI is on the graphs' own axis rather than the chart's time, so they show in a **Script graphs** panel, which the script's **Graphs** button on the chart opens.
## How it works
[`graph(title)`](/terminal/guides/outputs#graphs) spaces its keys by value, so each band sits at its middle (32.5 for 30 to 35). Each bar looks back `Bars ahead` bars through [series](/terminal/guides/state#series) of RSI and close, adds what price did since to that reading's band, and sets the band's average, coloured by its sign. A band with few readings is noise: read the second graph before the first.
## The script
```ts rsi-forward-returns.ts theme={"theme":"github-dark"}
// What came after an RSI reading on this market: for each band of RSI five points wide, the average
// return over the next bars, up where it rose and down where it fell. RSI is on the graph's own
// axis rather than the chart's time, so it shows in a Script graphs panel, which the legend's
// Graphs button opens. Points mark how many readings each band had, on a second graph.
indicator('Return after RSI', { overlay: true, shortName: 'RSI → return' });
const length = input.int('RSI length', 14, { min: 2 });
const ahead = input.int('Bars ahead', 12, { min: 1, max: 500 });
const chart = bars();
const rsi = ta.rsi(length);
const pastRsi = series(501);
const pastClose = series(501);
// A sum and a count per band.
const sums = state.map(20);
const counts = state.map(20);
const returns = graph(`Average return ${ahead} bars after RSI`, { format: 'percent', precision: 2 });
const average = returns.bars('Return');
const samples = graph('Readings per RSI band', { precision: 0 });
const count = samples.points('Readings', { size: 4 });
chart.onBar(() => {
pastRsi.set(rsi.update(chart.close));
pastClose.set(chart.close);
// The reading `ahead` bars ago, and what price did since.
const then = pastRsi.ago(ahead);
const from = pastClose.ago(ahead);
if (isNa(then) || isNa(from)) return;
const band = Math.min(19, Math.floor(then / 5));
const key = String(band);
const change = (chart.close / from - 1) * 100;
const n = (counts.get(key) ?? 0) + 1;
counts.set(key, n);
sums.set(key, (sums.get(key) ?? 0) + change);
const mean = sums.get(key)! / n;
// Each band at its middle: 32.5 for RSI 30 to 35.
const middle = band * 5 + 2.5;
average.set(middle, mean, mean >= 0 ? color.up : color.down);
count.set(middle, n);
});
```
## Next step
See the next example, [RSI cross, pasted Pine](/terminal/examples/rsi-pine).
This documentation is built and hosted on [Mintlify](https://mintlify.com), a developer documentation platform.
Load it on BTC 15m in the terminal, then change its settings or open it in the script editor.
What came after an RSI reading on this market: for each band of RSI five points wide, the average return over the next 12 bars, green where it rose and red where it fell, and a second graph of how many readings each band had. RSI is on the graphs' own axis rather than the chart's time, so they show in a **Script graphs** panel, which the script's **Graphs** button on the chart opens.
## How it works
[`graph(title)`](/terminal/guides/outputs#graphs) spaces its keys by value, so each band sits at its middle (32.5 for 30 to 35). Each bar looks back `Bars ahead` bars through [series](/terminal/guides/state#series) of RSI and close, adds what price did since to that reading's band, and sets the band's average, coloured by its sign. A band with few readings is noise: read the second graph before the first.
## The script
```ts rsi-forward-returns.ts theme={"theme":"github-dark"}
// What came after an RSI reading on this market: for each band of RSI five points wide, the average
// return over the next bars, up where it rose and down where it fell. RSI is on the graph's own
// axis rather than the chart's time, so it shows in a Script graphs panel, which the legend's
// Graphs button opens. Points mark how many readings each band had, on a second graph.
indicator('Return after RSI', { overlay: true, shortName: 'RSI → return' });
const length = input.int('RSI length', 14, { min: 2 });
const ahead = input.int('Bars ahead', 12, { min: 1, max: 500 });
const chart = bars();
const rsi = ta.rsi(length);
const pastRsi = series(501);
const pastClose = series(501);
// A sum and a count per band.
const sums = state.map(20);
const counts = state.map(20);
const returns = graph(`Average return ${ahead} bars after RSI`, { format: 'percent', precision: 2 });
const average = returns.bars('Return');
const samples = graph('Readings per RSI band', { precision: 0 });
const count = samples.points('Readings', { size: 4 });
chart.onBar(() => {
pastRsi.set(rsi.update(chart.close));
pastClose.set(chart.close);
// The reading `ahead` bars ago, and what price did since.
const then = pastRsi.ago(ahead);
const from = pastClose.ago(ahead);
if (isNa(then) || isNa(from)) return;
const band = Math.min(19, Math.floor(then / 5));
const key = String(band);
const change = (chart.close / from - 1) * 100;
const n = (counts.get(key) ?? 0) + 1;
counts.set(key, n);
sums.set(key, (sums.get(key) ?? 0) + change);
const mean = sums.get(key)! / n;
// Each band at its middle: 32.5 for RSI 30 to 35.
const middle = band * 5 + 2.5;
average.set(middle, mean, mean >= 0 ? color.up : color.down);
count.set(middle, n);
});
```
## Next step
See the next example, [RSI cross, pasted Pine](/terminal/examples/rsi-pine).
This documentation is built and hosted on [Mintlify](https://mintlify.com), a developer documentation platform.