> ## Documentation Index
> Fetch the complete documentation index at: https://docs.0xarchive.io/llms.txt
> Use this file to discover all available pages before exploring further.
# RSI cross, pasted Pine
> The RSI cross as Pine Script, translated when it loads.
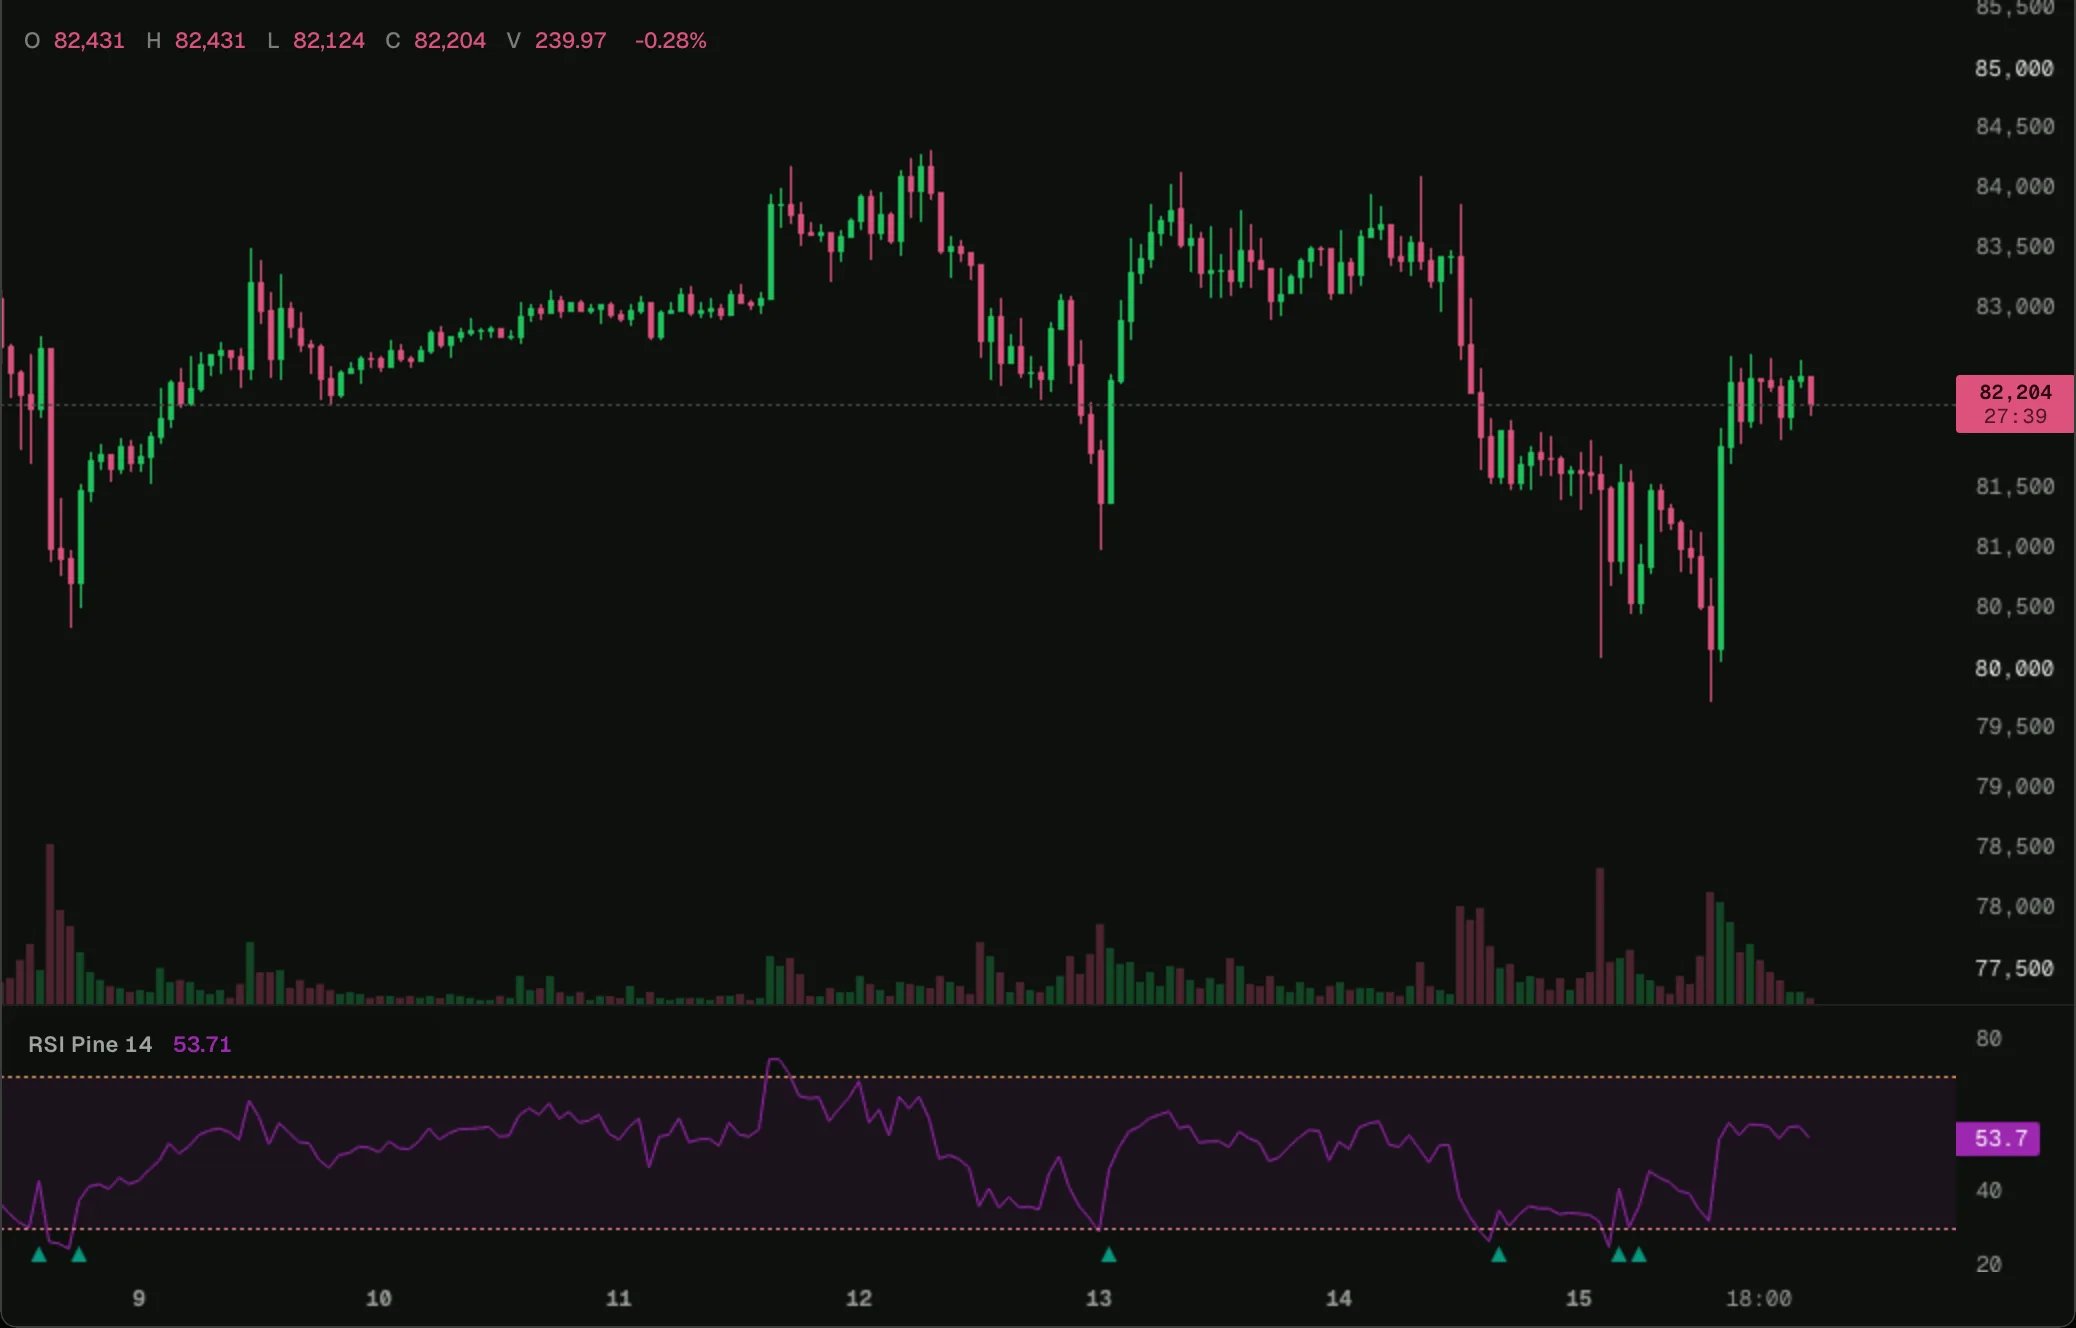 Load it on BTC 1h in the terminal, then change its settings or open it in the script editor.
The same RSI cross, as Pine Script v5 pasted from TradingView. The terminal translates it to a TypeScript script when it loads; in the script editor, **Show as TypeScript** shows the translation.
## How it translates
* `var int crosses = 0` becomes a `state.bar(0)` cell, kept across bars and rolled back while the bar forms.
* `ta.rsi(close, len)` and `ta.crossover(r, 30)` each become an instance created at the top and updated on every bar, as Pine keeps one history per call.
* `hline` becomes `plot.level`, and the `fill` between the two levels a `plot.fill` between their handles.
* `plotshape` becomes `plot.shape`, with `shape.triangleup` as `triangleUp`.
Compare it with [RSI cross](/terminal/examples/rsi-cross), the same script written by hand.
## The script
```pine rsi-pine.pine theme={"theme":"github-dark"}
//@version=5
// The RSI cross example (rsi-cross.ts) as pasted from TradingView.
indicator("RSI cross, pasted Pine", shorttitle="RSI Pine")
len = input.int(14, "Length", minval=1)
r = ta.rsi(close, len)
var int crosses = 0
up = ta.crossover(r, 30)
if up
crosses += 1
plot(r, "RSI", color=color.purple)
plotshape(up, "Up", shape.triangleup, location.bottom, color=color.teal)
lower = hline(30, "Oversold", linestyle=hline.style_dashed)
upper = hline(70, "Overbought", linestyle=hline.style_dashed)
fill(upper, lower, color=color.new(color.purple, 90), title="Band")
```
## Next step
See the next example, [Ichimoku, pasted Pine](/terminal/examples/ichimoku-pine).
This documentation is built and hosted on [Mintlify](https://mintlify.com), a developer documentation platform.
Load it on BTC 1h in the terminal, then change its settings or open it in the script editor.
The same RSI cross, as Pine Script v5 pasted from TradingView. The terminal translates it to a TypeScript script when it loads; in the script editor, **Show as TypeScript** shows the translation.
## How it translates
* `var int crosses = 0` becomes a `state.bar(0)` cell, kept across bars and rolled back while the bar forms.
* `ta.rsi(close, len)` and `ta.crossover(r, 30)` each become an instance created at the top and updated on every bar, as Pine keeps one history per call.
* `hline` becomes `plot.level`, and the `fill` between the two levels a `plot.fill` between their handles.
* `plotshape` becomes `plot.shape`, with `shape.triangleup` as `triangleUp`.
Compare it with [RSI cross](/terminal/examples/rsi-cross), the same script written by hand.
## The script
```pine rsi-pine.pine theme={"theme":"github-dark"}
//@version=5
// The RSI cross example (rsi-cross.ts) as pasted from TradingView.
indicator("RSI cross, pasted Pine", shorttitle="RSI Pine")
len = input.int(14, "Length", minval=1)
r = ta.rsi(close, len)
var int crosses = 0
up = ta.crossover(r, 30)
if up
crosses += 1
plot(r, "RSI", color=color.purple)
plotshape(up, "Up", shape.triangleup, location.bottom, color=color.teal)
lower = hline(30, "Oversold", linestyle=hline.style_dashed)
upper = hline(70, "Overbought", linestyle=hline.style_dashed)
fill(upper, lower, color=color.new(color.purple, 90), title="Band")
```
## Next step
See the next example, [Ichimoku, pasted Pine](/terminal/examples/ichimoku-pine).
This documentation is built and hosted on [Mintlify](https://mintlify.com), a developer documentation platform.