> ## Documentation Index
> Fetch the complete documentation index at: https://docs.0xarchive.io/llms.txt
> Use this file to discover all available pages before exploring further.
# Session table
> The last price, change, high and low since 00:00 UTC, in a table in a corner of the chart.
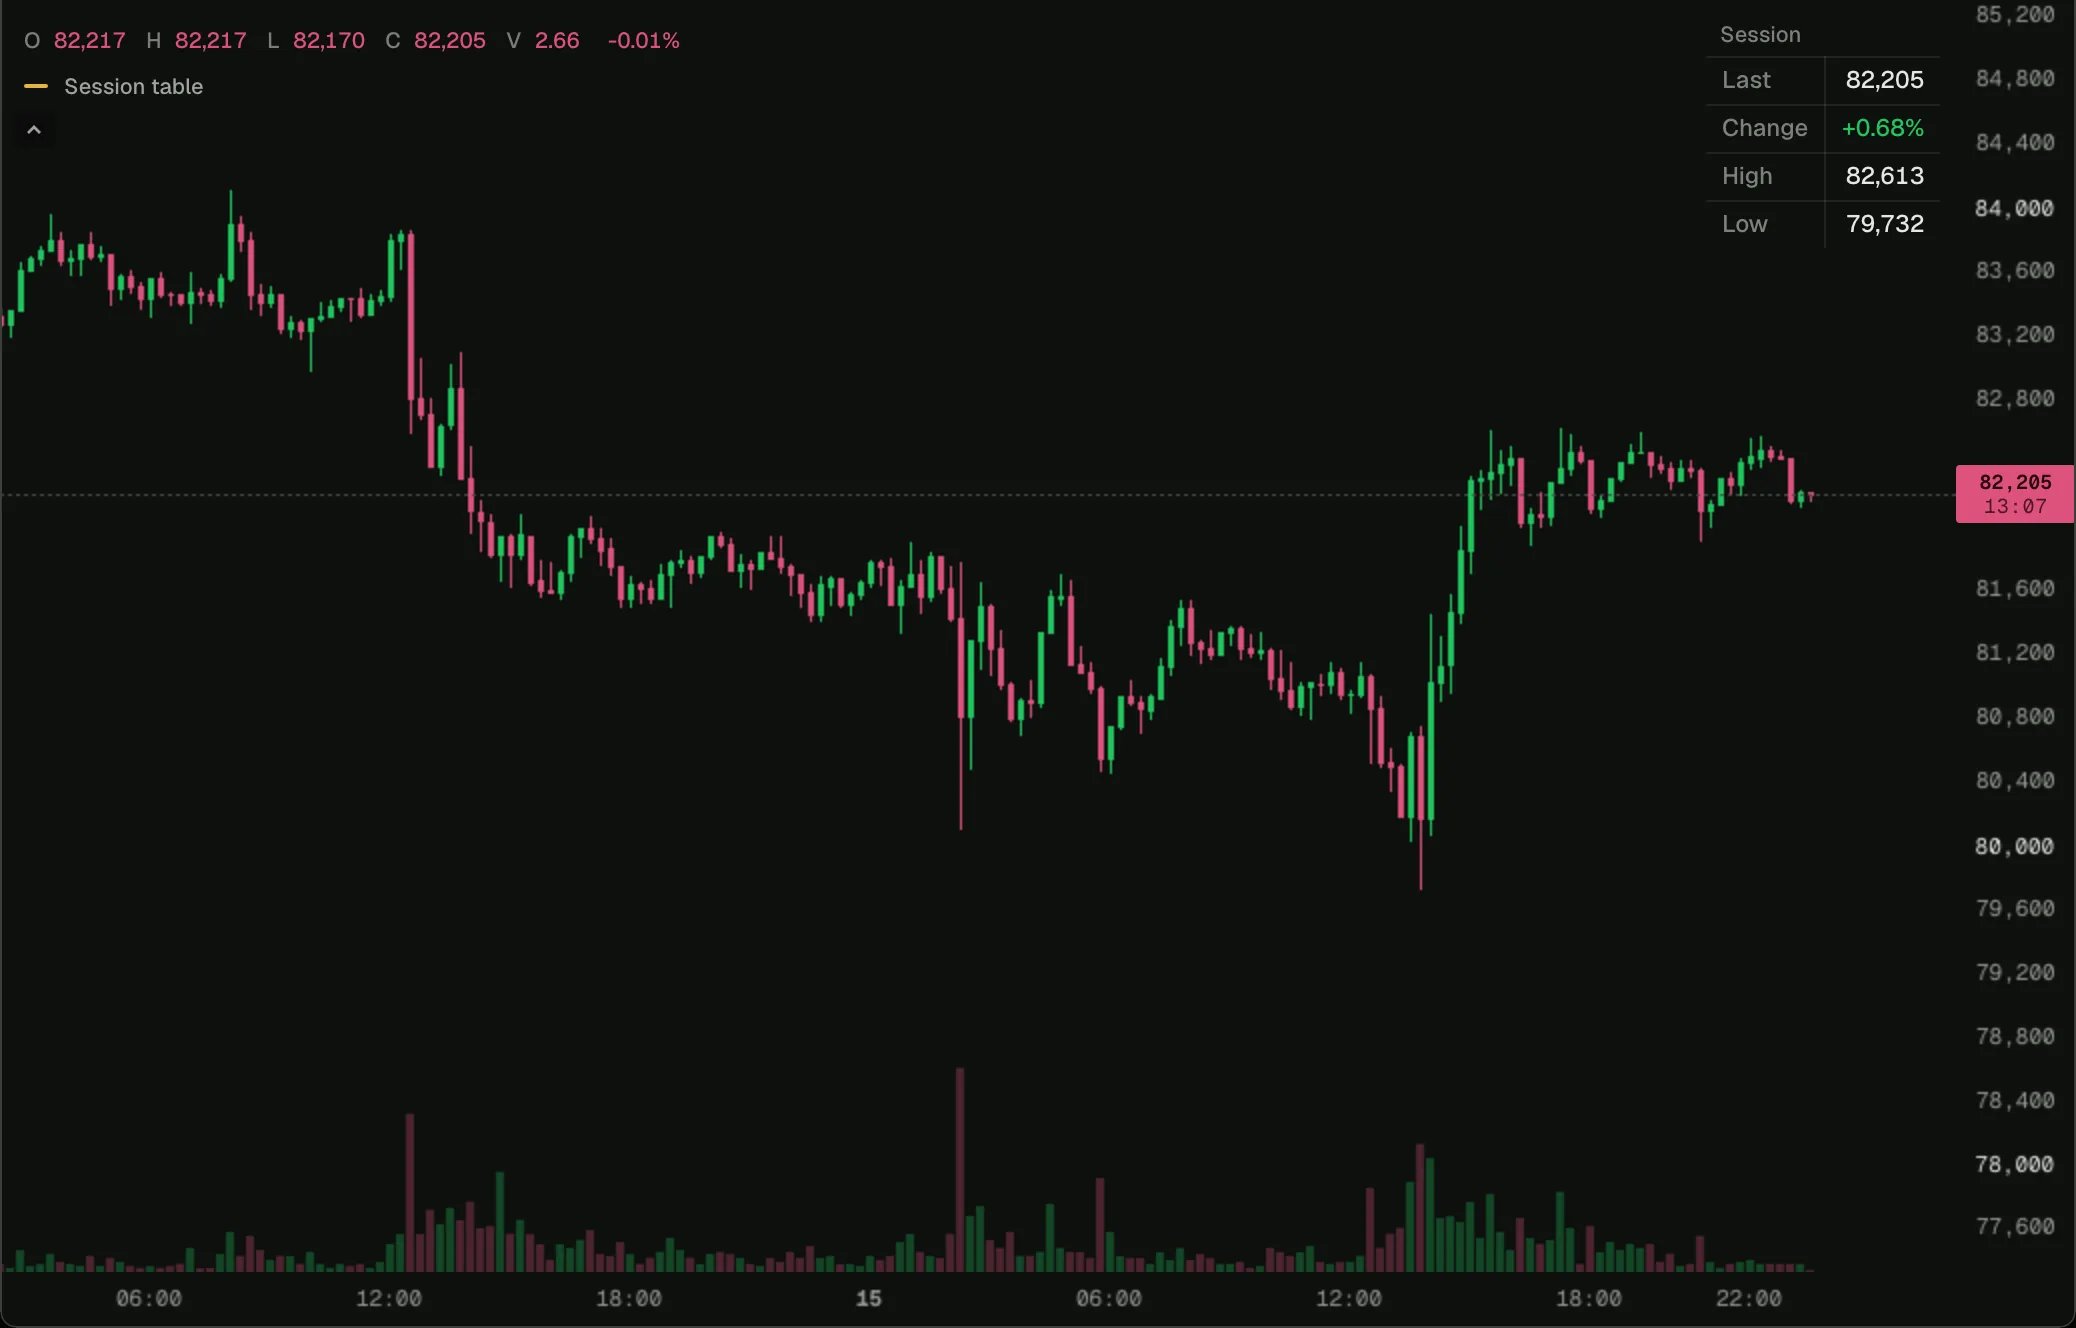 Load it on BTC 15m in the terminal, then change its settings or open it in the script editor.
A table of the session so far: last price, change since 00:00 UTC, high and low.
## How it works
A table is made once with `draw.table` at the top, and its cells are written on the newest bar only (`chart.isLast`). `fmt.price` writes prices to the market's own precision, so the table reads like the price axis beside it. The **Position** input says where the table sits; `legend: false` keeps it out of the script's name in the legend.
## The script
```ts session-table.ts theme={"theme":"github-dark"}
// The session so far, in a table in a corner of the chart: the last price, the change since the
// session opened at 00:00 UTC, and the session's high and low. The title is an input, shown as
// text only, and the corner is a choice of Pine's nine positions.
indicator('Session table', { overlay: true });
const title = input.string('Title', 'Session');
// Where the table sits is not what it computes, so it stays out of the name in the legend.
const position = input.choice('Position', 'top-right', ['top-left', 'top-center', 'top-right', 'middle-left', 'middle-center', 'middle-right', 'bottom-left', 'bottom-center', 'bottom-right'], { legend: false });
const chart = bars();
const day = state.bar(na);
const open = state.bar(na);
const high = state.bar(na);
const low = state.bar(na);
const table = draw.table({ position, columns: 2, rows: 5, background: color.withAlpha(color.panel, 0.92), border: color.withAlpha(color.neutral, 0.14), frame: color.withAlpha(color.neutral, 0.28) });
chart.onBar(() => {
const start = clock.startOf(chart.time, 'day');
if (start !== day.value) {
day.value = start;
open.value = chart.open;
high.value = chart.high;
low.value = chart.low;
}
high.value = Math.max(high.value, chart.high);
low.value = Math.min(low.value, chart.low);
if (!chart.isLast) return;
const change = chart.close / open.value - 1;
// The title spans both columns.
table.merge(0, 0, 1, 0);
table.cell(0, 0, title, { align: 'left', size: 'small', color: color.withAlpha(color.neutral, 0.8) });
table.cell(0, 1, 'Last', { align: 'left', color: color.withAlpha(color.neutral, 0.8) });
table.cell(1, 1, fmt.price(chart.close), { align: 'right' });
table.cell(0, 2, 'Change', { align: 'left', color: color.withAlpha(color.neutral, 0.8), tooltip: 'Since the session opened at 00:00 UTC' });
table.cell(1, 2, `${change >= 0 ? '+' : ''}${fmt.pct(change)}`, { align: 'right', color: change >= 0 ? color.up : color.down });
table.cell(0, 3, 'High', { align: 'left', color: color.withAlpha(color.neutral, 0.8) });
table.cell(1, 3, fmt.price(high.value), { align: 'right' });
table.cell(0, 4, 'Low', { align: 'left', color: color.withAlpha(color.neutral, 0.8) });
table.cell(1, 4, fmt.price(low.value), { align: 'right' });
});
```
## Next step
See the next example, [Ichimoku](/terminal/examples/ichimoku).
This documentation is built and hosted on [Mintlify](https://mintlify.com), a developer documentation platform.
Load it on BTC 15m in the terminal, then change its settings or open it in the script editor.
A table of the session so far: last price, change since 00:00 UTC, high and low.
## How it works
A table is made once with `draw.table` at the top, and its cells are written on the newest bar only (`chart.isLast`). `fmt.price` writes prices to the market's own precision, so the table reads like the price axis beside it. The **Position** input says where the table sits; `legend: false` keeps it out of the script's name in the legend.
## The script
```ts session-table.ts theme={"theme":"github-dark"}
// The session so far, in a table in a corner of the chart: the last price, the change since the
// session opened at 00:00 UTC, and the session's high and low. The title is an input, shown as
// text only, and the corner is a choice of Pine's nine positions.
indicator('Session table', { overlay: true });
const title = input.string('Title', 'Session');
// Where the table sits is not what it computes, so it stays out of the name in the legend.
const position = input.choice('Position', 'top-right', ['top-left', 'top-center', 'top-right', 'middle-left', 'middle-center', 'middle-right', 'bottom-left', 'bottom-center', 'bottom-right'], { legend: false });
const chart = bars();
const day = state.bar(na);
const open = state.bar(na);
const high = state.bar(na);
const low = state.bar(na);
const table = draw.table({ position, columns: 2, rows: 5, background: color.withAlpha(color.panel, 0.92), border: color.withAlpha(color.neutral, 0.14), frame: color.withAlpha(color.neutral, 0.28) });
chart.onBar(() => {
const start = clock.startOf(chart.time, 'day');
if (start !== day.value) {
day.value = start;
open.value = chart.open;
high.value = chart.high;
low.value = chart.low;
}
high.value = Math.max(high.value, chart.high);
low.value = Math.min(low.value, chart.low);
if (!chart.isLast) return;
const change = chart.close / open.value - 1;
// The title spans both columns.
table.merge(0, 0, 1, 0);
table.cell(0, 0, title, { align: 'left', size: 'small', color: color.withAlpha(color.neutral, 0.8) });
table.cell(0, 1, 'Last', { align: 'left', color: color.withAlpha(color.neutral, 0.8) });
table.cell(1, 1, fmt.price(chart.close), { align: 'right' });
table.cell(0, 2, 'Change', { align: 'left', color: color.withAlpha(color.neutral, 0.8), tooltip: 'Since the session opened at 00:00 UTC' });
table.cell(1, 2, `${change >= 0 ? '+' : ''}${fmt.pct(change)}`, { align: 'right', color: change >= 0 ? color.up : color.down });
table.cell(0, 3, 'High', { align: 'left', color: color.withAlpha(color.neutral, 0.8) });
table.cell(1, 3, fmt.price(high.value), { align: 'right' });
table.cell(0, 4, 'Low', { align: 'left', color: color.withAlpha(color.neutral, 0.8) });
table.cell(1, 4, fmt.price(low.value), { align: 'right' });
});
```
## Next step
See the next example, [Ichimoku](/terminal/examples/ichimoku).
This documentation is built and hosted on [Mintlify](https://mintlify.com), a developer documentation platform.