> ## Documentation Index
> Fetch the complete documentation index at: https://docs.0xarchive.io/llms.txt
> Use this file to discover all available pages before exploring further.
# Squeeze or new positions
> Label every big candle by whether it was driven by positions closing (a squeeze or a flush) or by new positions opening.
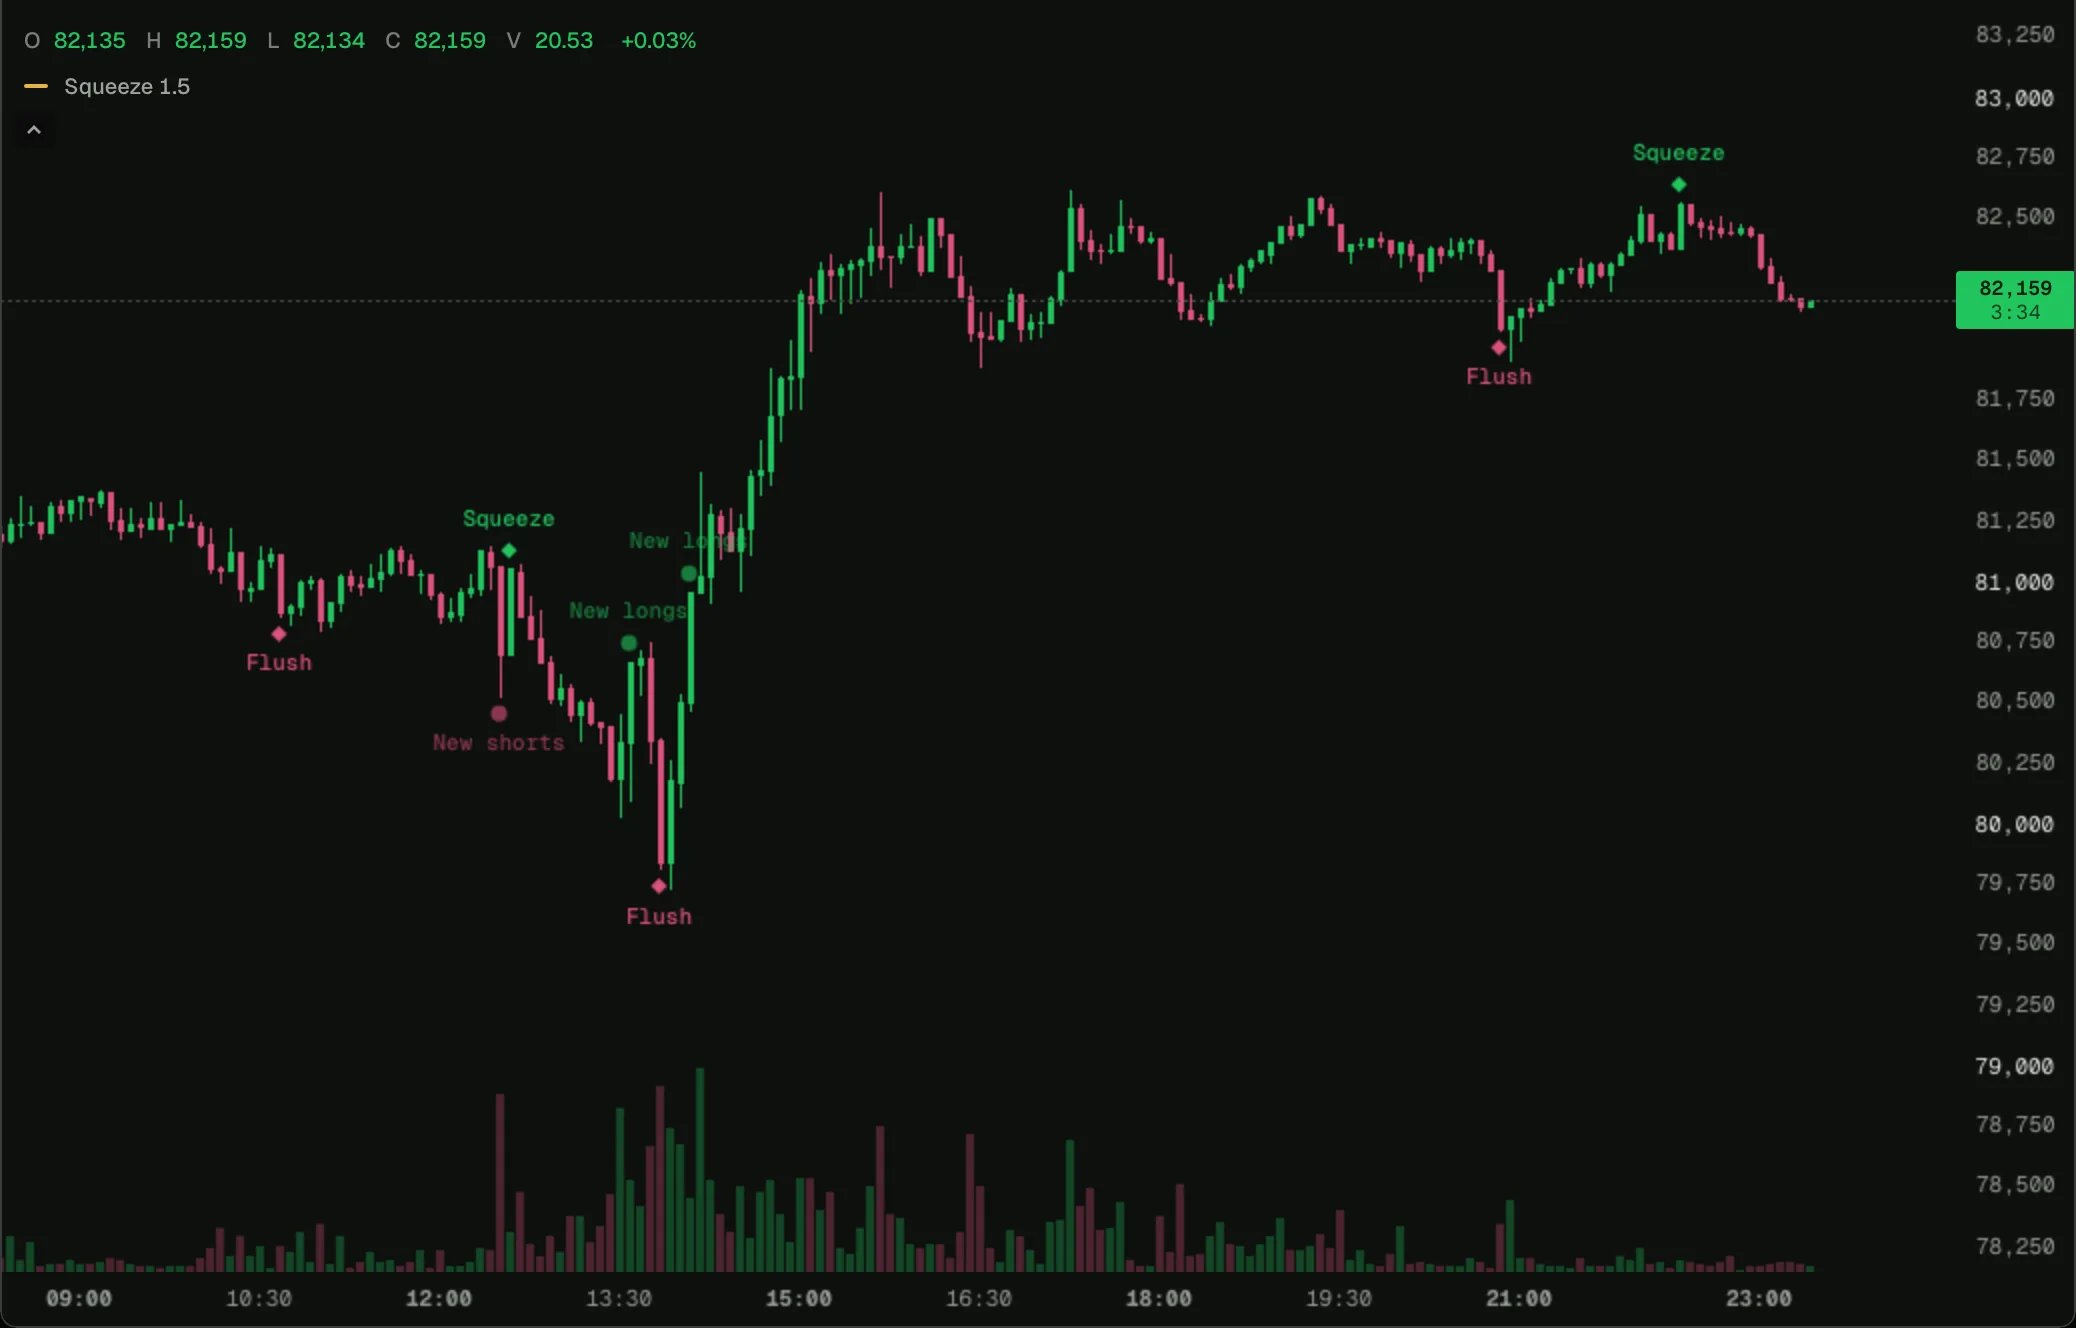 Load it on BTC 5m in the terminal, then change its settings or open it in the script editor.
A candle whose body is more than 1.5 times the 14-bar ATR gets a label:
* **Squeeze**: a rally where shorts buying back outweighed new longs.
* **New longs**: a rally carried by positions opening.
* **Flush**: a drop where longs selling out outweighed new shorts.
* **New shorts**: a drop carried by positions opening.
Diamonds mark the moves driven by exits, circles the ones driven by entries. Moves driven by exits tend to run out once the trapped side is gone; moves on new positions leave those positions behind as fuel, or as the next squeeze.
## How it works
The trades are sorted exactly as in [Opening and closing flow](/terminal/examples/opening-closing-flow). The labels are decided in `onClose`, once per closed bar, so they never repaint. The ATR is updated before the early `return`, because an [indicator](/terminal/guides/state#indicators) only advances on the bars it is updated on.
## Try changing
* Lower **Body over ATR** to label more candles.
* Add an [alert](/terminal/guides/outputs#alerts) that fires on a squeeze.
## The script
```ts squeeze-or-new-positions.ts theme={"theme":"github-dark"}
// Big candles labelled by what drove them: a rally that bought back shorts (a squeeze) or one that
// opened longs, a drop that sold out longs (a flush) or one that opened shorts. A candle is big when
// its body is more than `size` times the 14-bar ATR. Each trade is sorted by its change in open
// interest (`oiDelta`), as Opening and closing flow does.
indicator('Squeeze or new positions', { overlay: true, shortName: 'Squeeze' });
const size = input.float('Body over ATR', 1.5, { min: 0.1, step: 0.1 });
const chart = bars();
const tape = trades();
const atr = ta.atr(14);
const opening = tally();
const closing = tally();
const marks = plot.markers('Drivers');
tape.onTrade((t) => {
if (isNa(t.oiDelta) || t.oiDelta === 0) return;
(t.oiDelta > 0 ? opening : closing).add(t.side === 'buy' ? t.notional : -t.notional);
});
chart.onClose(() => {
// Updated on every bar, before any return: an indicator only advances when `update` runs.
const range = atr.update(chart);
const body = chart.close - chart.open;
if (!tape.available || !(Math.abs(body) > size * range)) return;
const up = body > 0;
// In the direction of the candle: positions closed against positions opened.
const exits = up ? closing.value : -closing.value;
const entries = up ? opening.value : -opening.value;
const squeeze = exits > entries;
const text = up ? (squeeze ? 'Squeeze' : 'New longs') : (squeeze ? 'Flush' : 'New shorts');
const ink = up ? color.up : color.down;
marks.add({ position: up ? 'above' : 'below', shape: squeeze ? 'diamond' : 'circle', text, color: squeeze ? ink : color.withAlpha(ink, 0.6) });
});
```
## Next step
See the next example, [Most-liquidated wallets](/terminal/examples/liquidated-wallets).
This documentation is built and hosted on [Mintlify](https://mintlify.com), a developer documentation platform.
Load it on BTC 5m in the terminal, then change its settings or open it in the script editor.
A candle whose body is more than 1.5 times the 14-bar ATR gets a label:
* **Squeeze**: a rally where shorts buying back outweighed new longs.
* **New longs**: a rally carried by positions opening.
* **Flush**: a drop where longs selling out outweighed new shorts.
* **New shorts**: a drop carried by positions opening.
Diamonds mark the moves driven by exits, circles the ones driven by entries. Moves driven by exits tend to run out once the trapped side is gone; moves on new positions leave those positions behind as fuel, or as the next squeeze.
## How it works
The trades are sorted exactly as in [Opening and closing flow](/terminal/examples/opening-closing-flow). The labels are decided in `onClose`, once per closed bar, so they never repaint. The ATR is updated before the early `return`, because an [indicator](/terminal/guides/state#indicators) only advances on the bars it is updated on.
## Try changing
* Lower **Body over ATR** to label more candles.
* Add an [alert](/terminal/guides/outputs#alerts) that fires on a squeeze.
## The script
```ts squeeze-or-new-positions.ts theme={"theme":"github-dark"}
// Big candles labelled by what drove them: a rally that bought back shorts (a squeeze) or one that
// opened longs, a drop that sold out longs (a flush) or one that opened shorts. A candle is big when
// its body is more than `size` times the 14-bar ATR. Each trade is sorted by its change in open
// interest (`oiDelta`), as Opening and closing flow does.
indicator('Squeeze or new positions', { overlay: true, shortName: 'Squeeze' });
const size = input.float('Body over ATR', 1.5, { min: 0.1, step: 0.1 });
const chart = bars();
const tape = trades();
const atr = ta.atr(14);
const opening = tally();
const closing = tally();
const marks = plot.markers('Drivers');
tape.onTrade((t) => {
if (isNa(t.oiDelta) || t.oiDelta === 0) return;
(t.oiDelta > 0 ? opening : closing).add(t.side === 'buy' ? t.notional : -t.notional);
});
chart.onClose(() => {
// Updated on every bar, before any return: an indicator only advances when `update` runs.
const range = atr.update(chart);
const body = chart.close - chart.open;
if (!tape.available || !(Math.abs(body) > size * range)) return;
const up = body > 0;
// In the direction of the candle: positions closed against positions opened.
const exits = up ? closing.value : -closing.value;
const entries = up ? opening.value : -opening.value;
const squeeze = exits > entries;
const text = up ? (squeeze ? 'Squeeze' : 'New longs') : (squeeze ? 'Flush' : 'New shorts');
const ink = up ? color.up : color.down;
marks.add({ position: up ? 'above' : 'below', shape: squeeze ? 'diamond' : 'circle', text, color: squeeze ? ink : color.withAlpha(ink, 0.6) });
});
```
## Next step
See the next example, [Most-liquidated wallets](/terminal/examples/liquidated-wallets).
This documentation is built and hosted on [Mintlify](https://mintlify.com), a developer documentation platform.