> ## Documentation Index
> Fetch the complete documentation index at: https://docs.0xarchive.io/llms.txt
> Use this file to discover all available pages before exploring further.
# Stopped-out footprint
> Where stops ran, at each price: the longs and shorts closed at a loss or forced out, drawn by the footprint chart type.
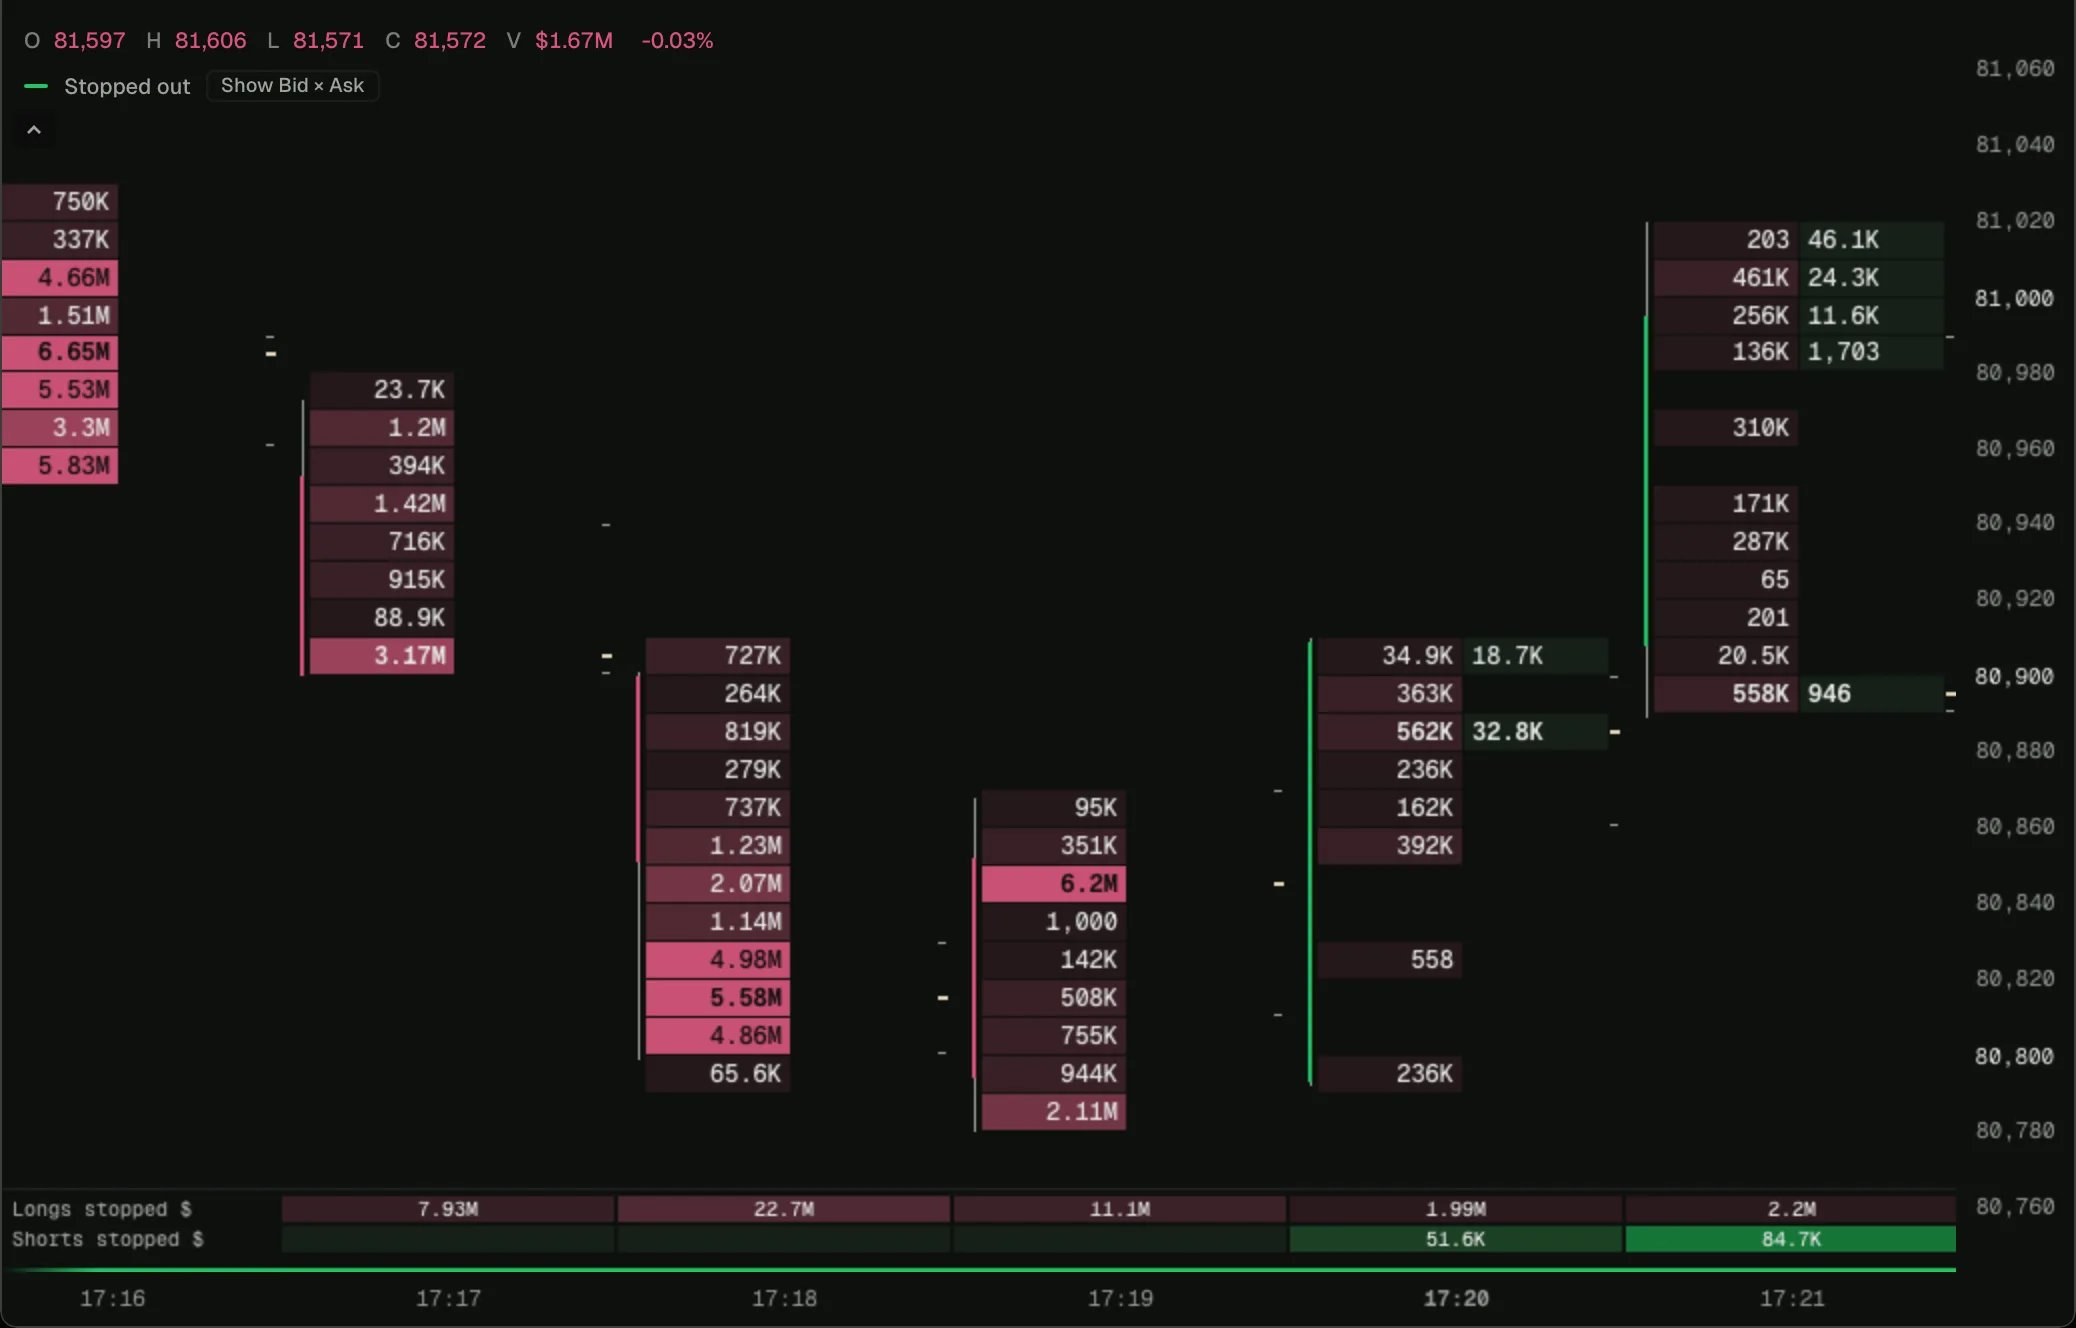 Load it on BTC 1m in the terminal, then change its settings or open it in the script editor.
A footprint of stop runs: at each price, the **longs stopped** (left, the sell side) and the **shorts stopped** (right, the buy side). A stop run shows at the exact prices where it happened, and most rows are empty, so an empty lane draws nothing rather than a row of zeros.
It draws on the footprint chart type, as a **Script** choice under **Data**, beside Bid × Ask. The footprint's own row sizes, shapes, colours, statistics rows and row readout all apply. On a candle chart the legend says **Footprint chart only**, and **Switch** goes there.
## How it works
Each fill's [`takerWhy`](/terminal/guides/order-flow#why-each-side-traded) says what the taker's position did. `stop_long` and `stop_short` are closes at a loss, or forced by a liquidation or auto-deleveraging. [`plot.footprint`](/terminal/guides/outputs#footprints) declares two lanes, and `fp.add` in `onTrade` adds each stopped fill's size at its price. The footprint groups the prices into its rows as you zoom, as it does for Bid × Ask.
## Try changing
* Add `tp_long` and `tp_short` as two more lanes, **Longs taking profit** and **Shorts taking profit**, to see stops beside profit taking.
* Use `t.notional` in place of `t.size`, with `measure: 'count'`, to print dollars whatever the chart's unit.
## The script
```ts stopped-out-footprint.ts theme={"theme":"github-dark"}
// Where stops ran: at each price, the longs and the shorts that were closed at a loss or forced out,
// from each fill's `takerWhy`. A long is stopped by selling and a short by buying, so each lane sits on
// the side its trades did. It draws on the footprint chart type, as a Data choice beside Bid × Ask.
indicator('Stopped-out footprint', { overlay: true, shortName: 'Stopped out' });
const tape = trades();
const fp = plot.footprint('Stopped out', {
lanes: [
{ id: 'longsStopped', label: 'Longs stopped', side: 'left', color: color.down },
{ id: 'shortsStopped', label: 'Shorts stopped', side: 'right', color: color.up },
],
});
tape.onTrade((t) => {
if (t.takerWhy === 'stop_long') fp.add('longsStopped', t.price, t.size);
else if (t.takerWhy === 'stop_short') fp.add('shortsStopped', t.price, t.size);
});
```
## Next step
See the next example, [Opens and closes footprint](/terminal/examples/opens-closes-footprint).
This documentation is built and hosted on [Mintlify](https://mintlify.com), a developer documentation platform.
Load it on BTC 1m in the terminal, then change its settings or open it in the script editor.
A footprint of stop runs: at each price, the **longs stopped** (left, the sell side) and the **shorts stopped** (right, the buy side). A stop run shows at the exact prices where it happened, and most rows are empty, so an empty lane draws nothing rather than a row of zeros.
It draws on the footprint chart type, as a **Script** choice under **Data**, beside Bid × Ask. The footprint's own row sizes, shapes, colours, statistics rows and row readout all apply. On a candle chart the legend says **Footprint chart only**, and **Switch** goes there.
## How it works
Each fill's [`takerWhy`](/terminal/guides/order-flow#why-each-side-traded) says what the taker's position did. `stop_long` and `stop_short` are closes at a loss, or forced by a liquidation or auto-deleveraging. [`plot.footprint`](/terminal/guides/outputs#footprints) declares two lanes, and `fp.add` in `onTrade` adds each stopped fill's size at its price. The footprint groups the prices into its rows as you zoom, as it does for Bid × Ask.
## Try changing
* Add `tp_long` and `tp_short` as two more lanes, **Longs taking profit** and **Shorts taking profit**, to see stops beside profit taking.
* Use `t.notional` in place of `t.size`, with `measure: 'count'`, to print dollars whatever the chart's unit.
## The script
```ts stopped-out-footprint.ts theme={"theme":"github-dark"}
// Where stops ran: at each price, the longs and the shorts that were closed at a loss or forced out,
// from each fill's `takerWhy`. A long is stopped by selling and a short by buying, so each lane sits on
// the side its trades did. It draws on the footprint chart type, as a Data choice beside Bid × Ask.
indicator('Stopped-out footprint', { overlay: true, shortName: 'Stopped out' });
const tape = trades();
const fp = plot.footprint('Stopped out', {
lanes: [
{ id: 'longsStopped', label: 'Longs stopped', side: 'left', color: color.down },
{ id: 'shortsStopped', label: 'Shorts stopped', side: 'right', color: color.up },
],
});
tape.onTrade((t) => {
if (t.takerWhy === 'stop_long') fp.add('longsStopped', t.price, t.size);
else if (t.takerWhy === 'stop_short') fp.add('shortsStopped', t.price, t.size);
});
```
## Next step
See the next example, [Opens and closes footprint](/terminal/examples/opens-closes-footprint).
This documentation is built and hosted on [Mintlify](https://mintlify.com), a developer documentation platform.