> ## Documentation Index
> Fetch the complete documentation index at: https://docs.0xarchive.io/llms.txt
> Use this file to discover all available pages before exploring further.
# Tape speed heat
> How fast the tape printed at each price, as a heat behind the candles, carried into later bars so fast levels stay lit and cool.
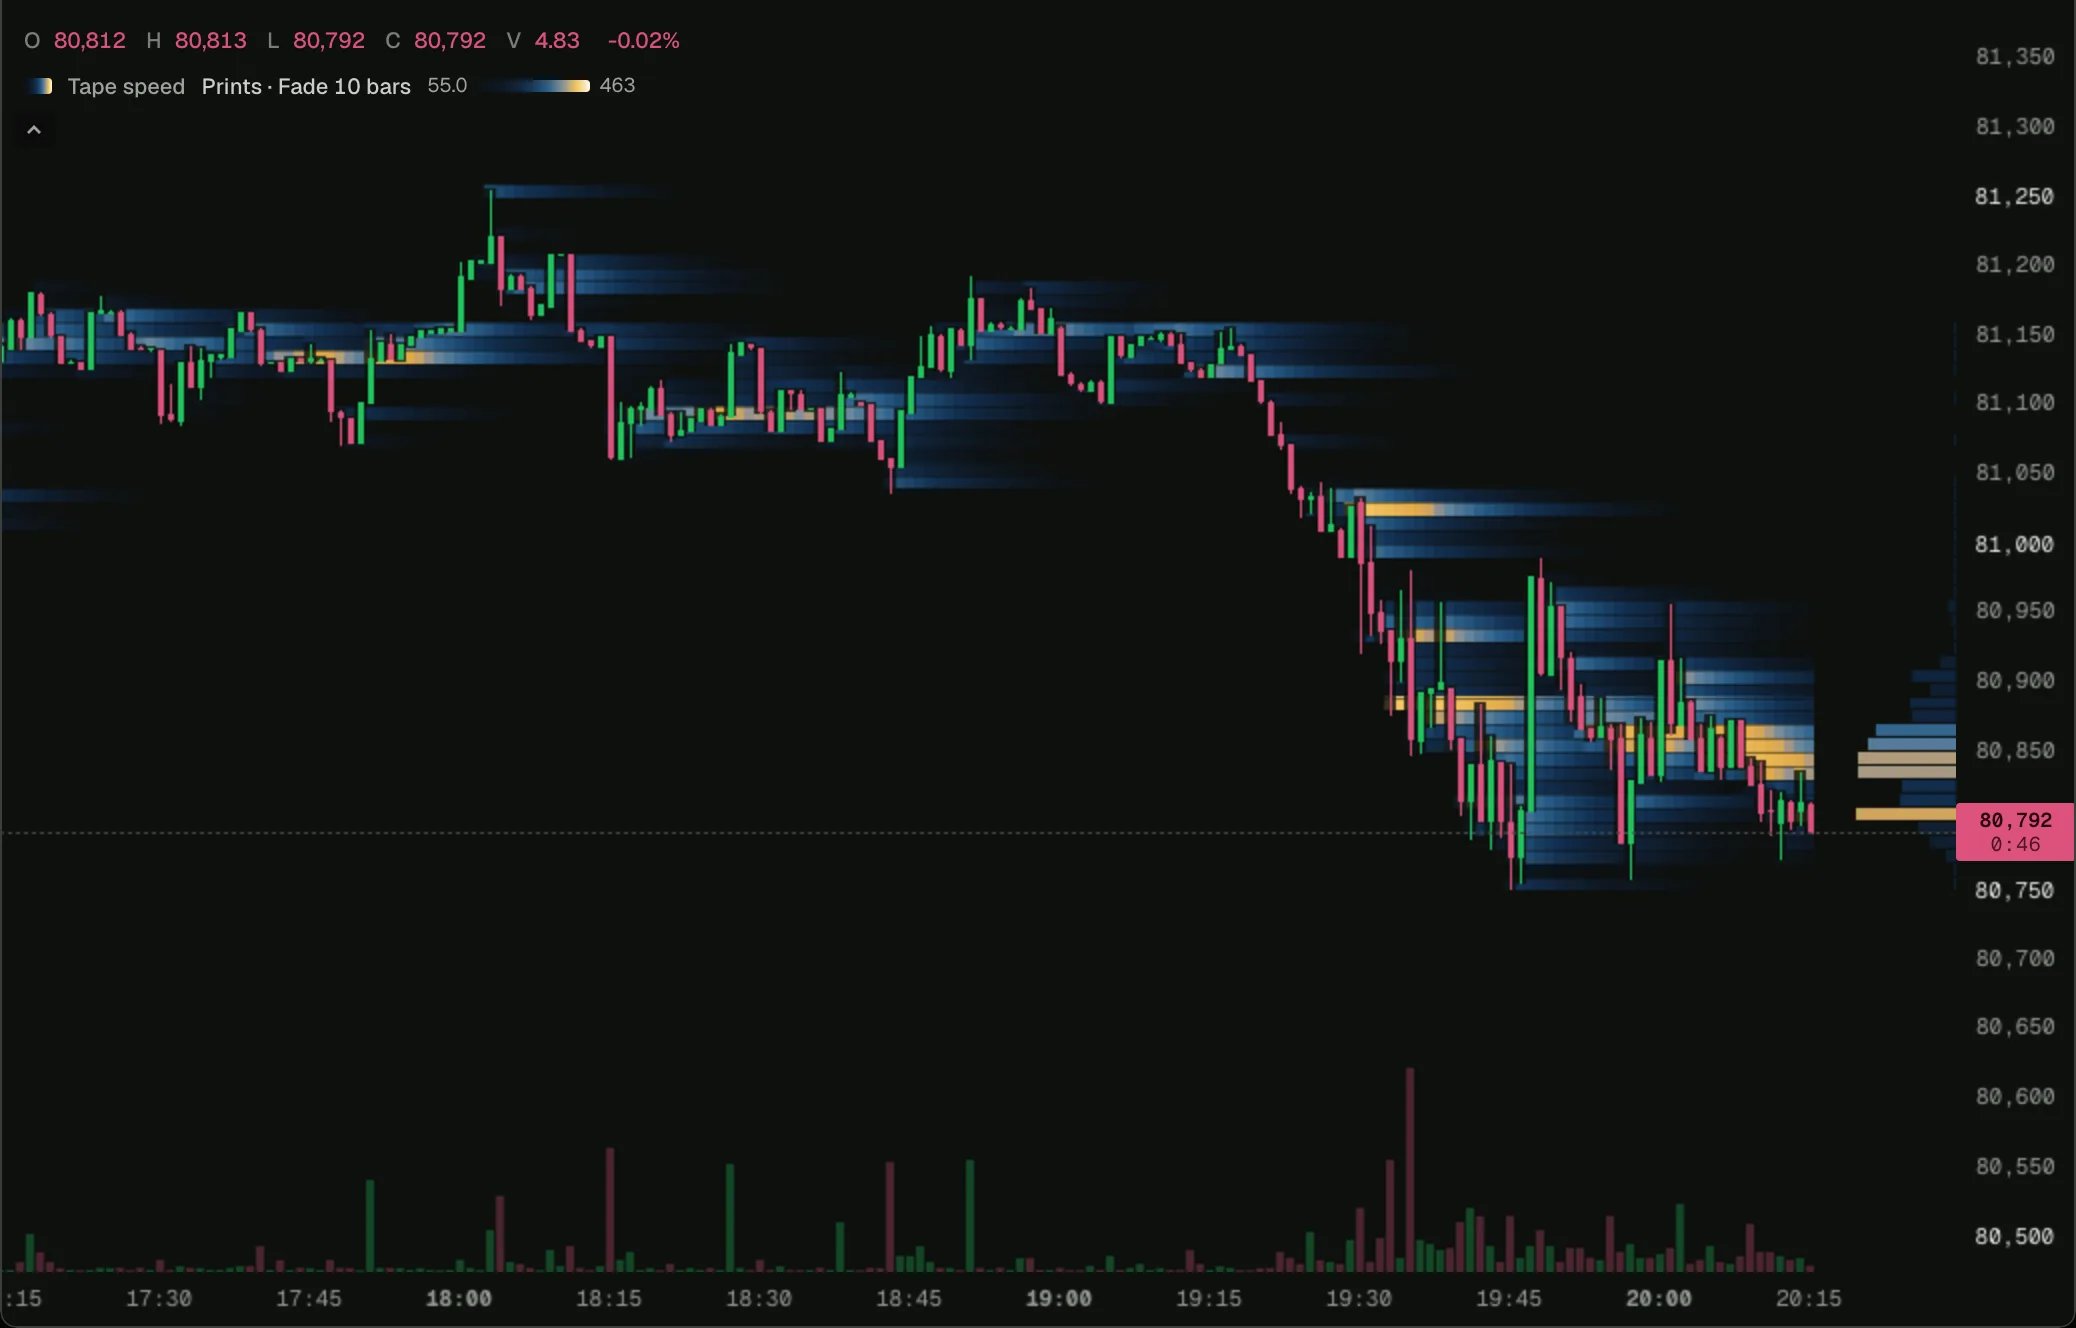 Load it on BTC 1m in the terminal, then change its settings or open it in the script editor.
A heat of **prints per price row per bar**: where the tape ran fastest. That is often not where the dollars were: at a breakout the fastest rows are many small prints, the crowd chasing, while the largest volume sits a row or two away where positions closed in size. The tone is the view's own scale, as on the order book heatmap, so a quiet market reads as well as a busy one with nothing to set.
A bar's own trades sit inside its range, behind its candle, so each value is **carried** into later bars and halves every 10 bars. A level where the tape was fast stays lit while price moves on, then cools. Change **Carry** in the heat's settings to fade faster or slower, to **Hold** (each value stays until price trades back through it) or to **Off**; nothing reruns.
## Inputs
* **Count**: **Prints**, each fill, or **Taker orders**, an order once at each price it filled at. One order fills against several makers, so prints run about 1.5 to 1.8 times the orders.
* **Against**: **Nothing**, or **Last hour**, which divides each print by the last hour's prints a bar. On a long window that lights a quiet session's bursts as brightly as a busy one's. It needs an hour of bars before it draws.
* **By side**: each row in its faster side's colour, sellers or buyers, at the row's total speed.
## How it works
[`plot.heat`](/terminal/guides/outputs#heats) declares a one-sided heat measured in counts, and `heat.add(t.price, 1)` in `onTrade` counts each print at its price. The chart carries the values, groups the rows with the zoom and colours them on the order book heatmap's ramp. Against the last hour keeps each bar's count in a [`tally`](/terminal/guides/state#tallies), averages an hour of them in `onClose`, and adds `1 / pace` per print instead of 1.
## Try changing
* Count only large prints: `if (t.notional < 50_000) return;` at the top of `onTrade`.
* Use `measure: 'size'` and add `t.size` to draw traded volume the same way, for comparison.
## The script
```ts tape-speed-heat.ts theme={"theme":"github-dark"}
// How fast the tape printed at each price, as a heat behind the candles: the rows where the crowd
// hit fastest, which are often not where the dollars were. Each value is carried into later bars
// and fades, so a fast level stays lit while price moves on. Taker orders count an order once at
// each price it filled at. Against the last hour divides by the last hour's prints a bar, so a quiet
// session's bursts light up as brightly as a busy one's. By side draws each row in its faster side's colour.
indicator('Tape speed heat', { overlay: true, shortName: 'Tape speed' });
// These inputs' ids (in0, in1, in2) and values stay as they are: the chart's built-in Tape speed keeps them.
// The heat's label says what it counts, so the legend's name leaves the inputs out.
const count = input.choice('Count', 'prints', ['prints', 'orders'], { labels: { prints: 'Prints', orders: 'Taker orders' }, legend: false });
const against = input.choice('Against', 'none', ['none', 'lastHour'], { labels: { none: 'Nothing', lastHour: 'Last hour' }, legend: false });
const bySide = input.bool('By side', false);
const chart = bars();
const tape = trades();
const what = `${count === 'orders' ? 'Taker orders' : 'Prints'}${against === 'lastHour' ? ' against the last hour' : ''}`;
const heat = bySide
? plot.heat('Tape speed', {
sides: [
{ id: 'sells', label: `${what}, sellers`, color: color.down },
{ id: 'buys', label: `${what}, buyers`, color: color.up },
],
measure: 'count',
combine: 'larger',
})
: plot.heat('Tape speed', { label: what, measure: 'count' });
// The last hour's pace: what each bar counted, averaged over an hour of bars.
const perBar = tally();
const pace = ta.sma(Math.max(1, Math.round(3_600_000 / chart.interval.ms)));
// The price the previous fill printed at: an order's next fill at the same price is the same order there.
const lastPrice = state.live(0);
tape.onTrade((t) => {
const counted = count === 'prints' || !t.sameOrder || t.price !== lastPrice.value;
lastPrice.value = t.price;
if (!counted) return;
perBar.add(1);
let amount = 1;
if (against === 'lastHour') {
const normal = pace.confirmed;
if (isNa(normal) || normal <= 0) return;
amount = 1 / normal;
}
if (bySide) heat.add(t.side === 'sell' ? 'sells' : 'buys', t.price, amount);
else heat.add(t.price, amount);
});
chart.onClose(() => {
pace.update(perBar.count);
});
```
## Next step
See the next example, [Stopped-out heat](/terminal/examples/stopped-out-heat).
This documentation is built and hosted on [Mintlify](https://mintlify.com), a developer documentation platform.
Load it on BTC 1m in the terminal, then change its settings or open it in the script editor.
A heat of **prints per price row per bar**: where the tape ran fastest. That is often not where the dollars were: at a breakout the fastest rows are many small prints, the crowd chasing, while the largest volume sits a row or two away where positions closed in size. The tone is the view's own scale, as on the order book heatmap, so a quiet market reads as well as a busy one with nothing to set.
A bar's own trades sit inside its range, behind its candle, so each value is **carried** into later bars and halves every 10 bars. A level where the tape was fast stays lit while price moves on, then cools. Change **Carry** in the heat's settings to fade faster or slower, to **Hold** (each value stays until price trades back through it) or to **Off**; nothing reruns.
## Inputs
* **Count**: **Prints**, each fill, or **Taker orders**, an order once at each price it filled at. One order fills against several makers, so prints run about 1.5 to 1.8 times the orders.
* **Against**: **Nothing**, or **Last hour**, which divides each print by the last hour's prints a bar. On a long window that lights a quiet session's bursts as brightly as a busy one's. It needs an hour of bars before it draws.
* **By side**: each row in its faster side's colour, sellers or buyers, at the row's total speed.
## How it works
[`plot.heat`](/terminal/guides/outputs#heats) declares a one-sided heat measured in counts, and `heat.add(t.price, 1)` in `onTrade` counts each print at its price. The chart carries the values, groups the rows with the zoom and colours them on the order book heatmap's ramp. Against the last hour keeps each bar's count in a [`tally`](/terminal/guides/state#tallies), averages an hour of them in `onClose`, and adds `1 / pace` per print instead of 1.
## Try changing
* Count only large prints: `if (t.notional < 50_000) return;` at the top of `onTrade`.
* Use `measure: 'size'` and add `t.size` to draw traded volume the same way, for comparison.
## The script
```ts tape-speed-heat.ts theme={"theme":"github-dark"}
// How fast the tape printed at each price, as a heat behind the candles: the rows where the crowd
// hit fastest, which are often not where the dollars were. Each value is carried into later bars
// and fades, so a fast level stays lit while price moves on. Taker orders count an order once at
// each price it filled at. Against the last hour divides by the last hour's prints a bar, so a quiet
// session's bursts light up as brightly as a busy one's. By side draws each row in its faster side's colour.
indicator('Tape speed heat', { overlay: true, shortName: 'Tape speed' });
// These inputs' ids (in0, in1, in2) and values stay as they are: the chart's built-in Tape speed keeps them.
// The heat's label says what it counts, so the legend's name leaves the inputs out.
const count = input.choice('Count', 'prints', ['prints', 'orders'], { labels: { prints: 'Prints', orders: 'Taker orders' }, legend: false });
const against = input.choice('Against', 'none', ['none', 'lastHour'], { labels: { none: 'Nothing', lastHour: 'Last hour' }, legend: false });
const bySide = input.bool('By side', false);
const chart = bars();
const tape = trades();
const what = `${count === 'orders' ? 'Taker orders' : 'Prints'}${against === 'lastHour' ? ' against the last hour' : ''}`;
const heat = bySide
? plot.heat('Tape speed', {
sides: [
{ id: 'sells', label: `${what}, sellers`, color: color.down },
{ id: 'buys', label: `${what}, buyers`, color: color.up },
],
measure: 'count',
combine: 'larger',
})
: plot.heat('Tape speed', { label: what, measure: 'count' });
// The last hour's pace: what each bar counted, averaged over an hour of bars.
const perBar = tally();
const pace = ta.sma(Math.max(1, Math.round(3_600_000 / chart.interval.ms)));
// The price the previous fill printed at: an order's next fill at the same price is the same order there.
const lastPrice = state.live(0);
tape.onTrade((t) => {
const counted = count === 'prints' || !t.sameOrder || t.price !== lastPrice.value;
lastPrice.value = t.price;
if (!counted) return;
perBar.add(1);
let amount = 1;
if (against === 'lastHour') {
const normal = pace.confirmed;
if (isNa(normal) || normal <= 0) return;
amount = 1 / normal;
}
if (bySide) heat.add(t.side === 'sell' ? 'sells' : 'buys', t.price, amount);
else heat.add(t.price, amount);
});
chart.onClose(() => {
pace.update(perBar.count);
});
```
## Next step
See the next example, [Stopped-out heat](/terminal/examples/stopped-out-heat).
This documentation is built and hosted on [Mintlify](https://mintlify.com), a developer documentation platform.