> ## Documentation Index
> Fetch the complete documentation index at: https://docs.0xarchive.io/llms.txt
> Use this file to discover all available pages before exploring further.
# Volume by hour
> The average volume and range of each UTC hour of the day, in graphs of their own.
 Load it on BTC 15m in the terminal, then change its settings or open it in the script editor.
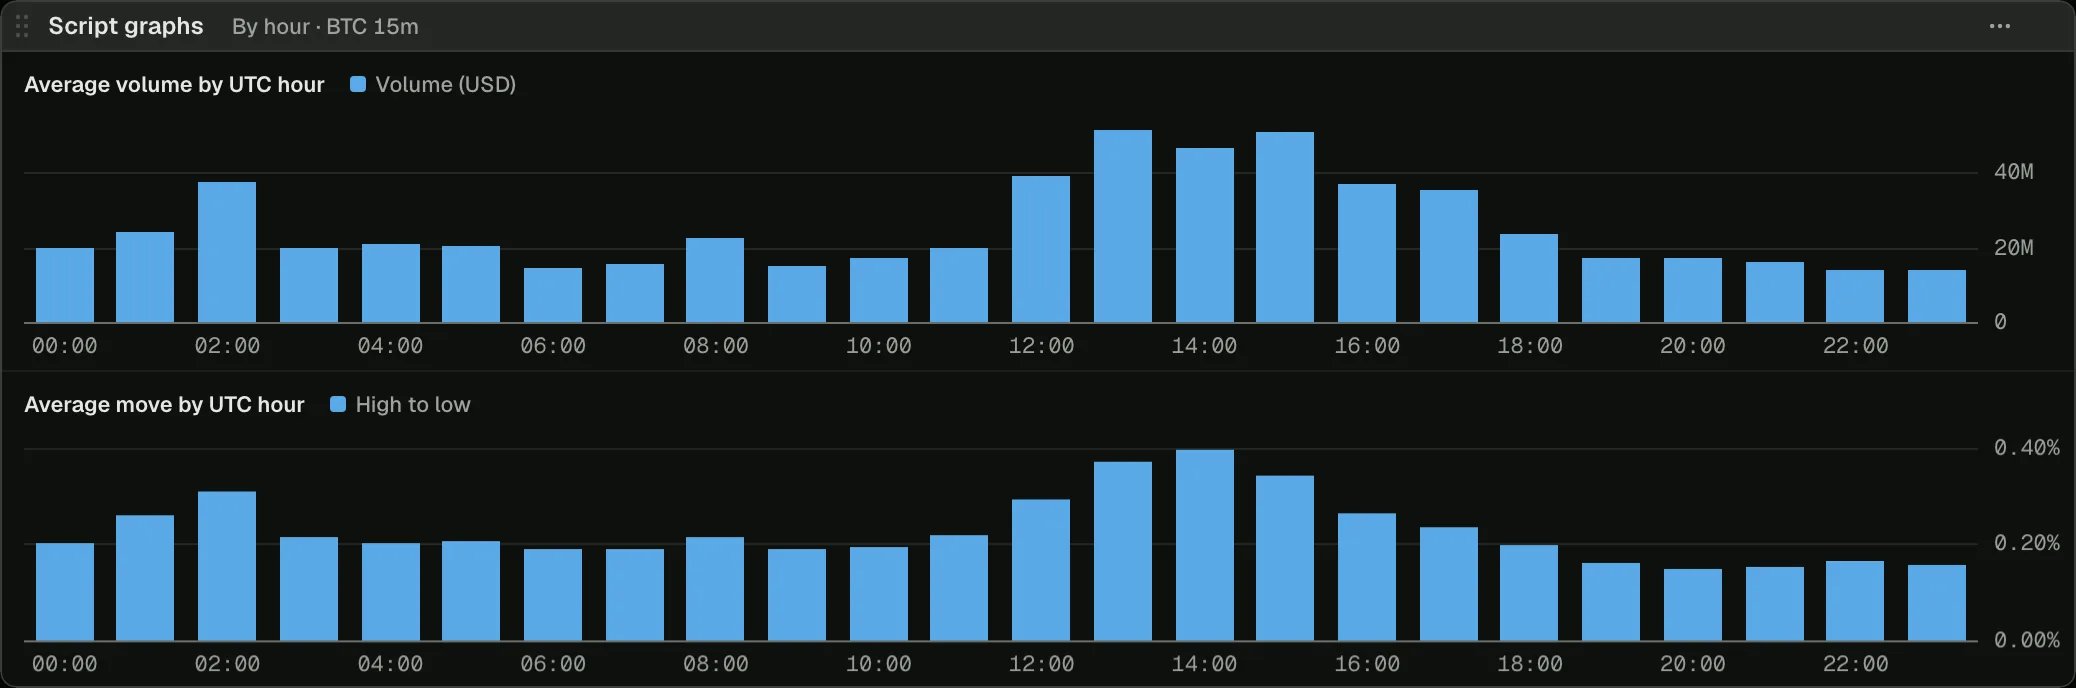
When a market trades: the average volume of each UTC hour of the day, and how far price moves in it, over every bar on the chart. The hours are names on an axis of their own, so the two graphs show in a **Script graphs** panel, which the script's **Graphs** button on the chart opens.
## How it works
[`graph(title, { axis: 'category' })`](/terminal/guides/outputs#graphs) makes a graph whose keys are names. The script sets all 24 hours on its first bar, empty, so they keep their order and a quiet hour keeps its place. A sum and a count per hour sit in [state maps](/terminal/guides/state#lists-and-maps), and each bar sets its hour's average. Hourly bars or shorter give each hour its own bars.
## The script
```ts volume-by-hour.ts theme={"theme":"github-dark"}
// When a market trades: the average volume of each UTC hour of the day, and how far price moves
// in it, over every bar on the chart. The hours are names on an axis of their own, so the graphs
// show in a Script graphs panel, which the legend's Graphs button opens. Best on 1h bars or less.
indicator('Volume by hour', { overlay: true, shortName: 'By hour' });
const chart = bars();
// A sum and a count per hour, for each graph's average.
const volume = state.map(24);
const moves = state.map(24);
const counts = state.map(24);
const started = state.bar(false);
const byVolume = graph('Average volume by UTC hour', { axis: 'category' });
const volumeBars = byVolume.bars('Volume (USD)');
const byMove = graph('Average move by UTC hour', { axis: 'category', format: 'percent', precision: 2 });
const moveBars = byMove.bars('High to low');
const hourName = (hour: number) => `${hour < 10 ? '0' : ''}${hour}:00`;
chart.onBar(() => {
// Every hour on the axis from the start, in order, so a quiet hour still has its place.
if (!started.value) {
started.value = true;
for (let hour = 0; hour < 24; hour += 1) {
volumeBars.set(hourName(hour), na);
moveBars.set(hourName(hour), na);
}
}
const key = hourName(clock.parts(chart.time).hour);
const count = (counts.get(key) ?? 0) + 1;
counts.set(key, count);
volume.set(key, (volume.get(key) ?? 0) + chart.volume * chart.close);
moves.set(key, (moves.get(key) ?? 0) + (chart.high - chart.low) / chart.open);
volumeBars.set(key, volume.get(key)! / count);
moveBars.set(key, (moves.get(key)! / count) * 100);
});
```
## Next step
See the next example, [Return after RSI](/terminal/examples/rsi-forward-returns).
This documentation is built and hosted on [Mintlify](https://mintlify.com), a developer documentation platform.
Load it on BTC 15m in the terminal, then change its settings or open it in the script editor.
When a market trades: the average volume of each UTC hour of the day, and how far price moves in it, over every bar on the chart. The hours are names on an axis of their own, so the two graphs show in a **Script graphs** panel, which the script's **Graphs** button on the chart opens.
## How it works
[`graph(title, { axis: 'category' })`](/terminal/guides/outputs#graphs) makes a graph whose keys are names. The script sets all 24 hours on its first bar, empty, so they keep their order and a quiet hour keeps its place. A sum and a count per hour sit in [state maps](/terminal/guides/state#lists-and-maps), and each bar sets its hour's average. Hourly bars or shorter give each hour its own bars.
## The script
```ts volume-by-hour.ts theme={"theme":"github-dark"}
// When a market trades: the average volume of each UTC hour of the day, and how far price moves
// in it, over every bar on the chart. The hours are names on an axis of their own, so the graphs
// show in a Script graphs panel, which the legend's Graphs button opens. Best on 1h bars or less.
indicator('Volume by hour', { overlay: true, shortName: 'By hour' });
const chart = bars();
// A sum and a count per hour, for each graph's average.
const volume = state.map(24);
const moves = state.map(24);
const counts = state.map(24);
const started = state.bar(false);
const byVolume = graph('Average volume by UTC hour', { axis: 'category' });
const volumeBars = byVolume.bars('Volume (USD)');
const byMove = graph('Average move by UTC hour', { axis: 'category', format: 'percent', precision: 2 });
const moveBars = byMove.bars('High to low');
const hourName = (hour: number) => `${hour < 10 ? '0' : ''}${hour}:00`;
chart.onBar(() => {
// Every hour on the axis from the start, in order, so a quiet hour still has its place.
if (!started.value) {
started.value = true;
for (let hour = 0; hour < 24; hour += 1) {
volumeBars.set(hourName(hour), na);
moveBars.set(hourName(hour), na);
}
}
const key = hourName(clock.parts(chart.time).hour);
const count = (counts.get(key) ?? 0) + 1;
counts.set(key, count);
volume.set(key, (volume.get(key) ?? 0) + chart.volume * chart.close);
moves.set(key, (moves.get(key) ?? 0) + (chart.high - chart.low) / chart.open);
volumeBars.set(key, volume.get(key)! / count);
moveBars.set(key, (moves.get(key)! / count) * 100);
});
```
## Next step
See the next example, [Return after RSI](/terminal/examples/rsi-forward-returns).
This documentation is built and hosted on [Mintlify](https://mintlify.com), a developer documentation platform.