

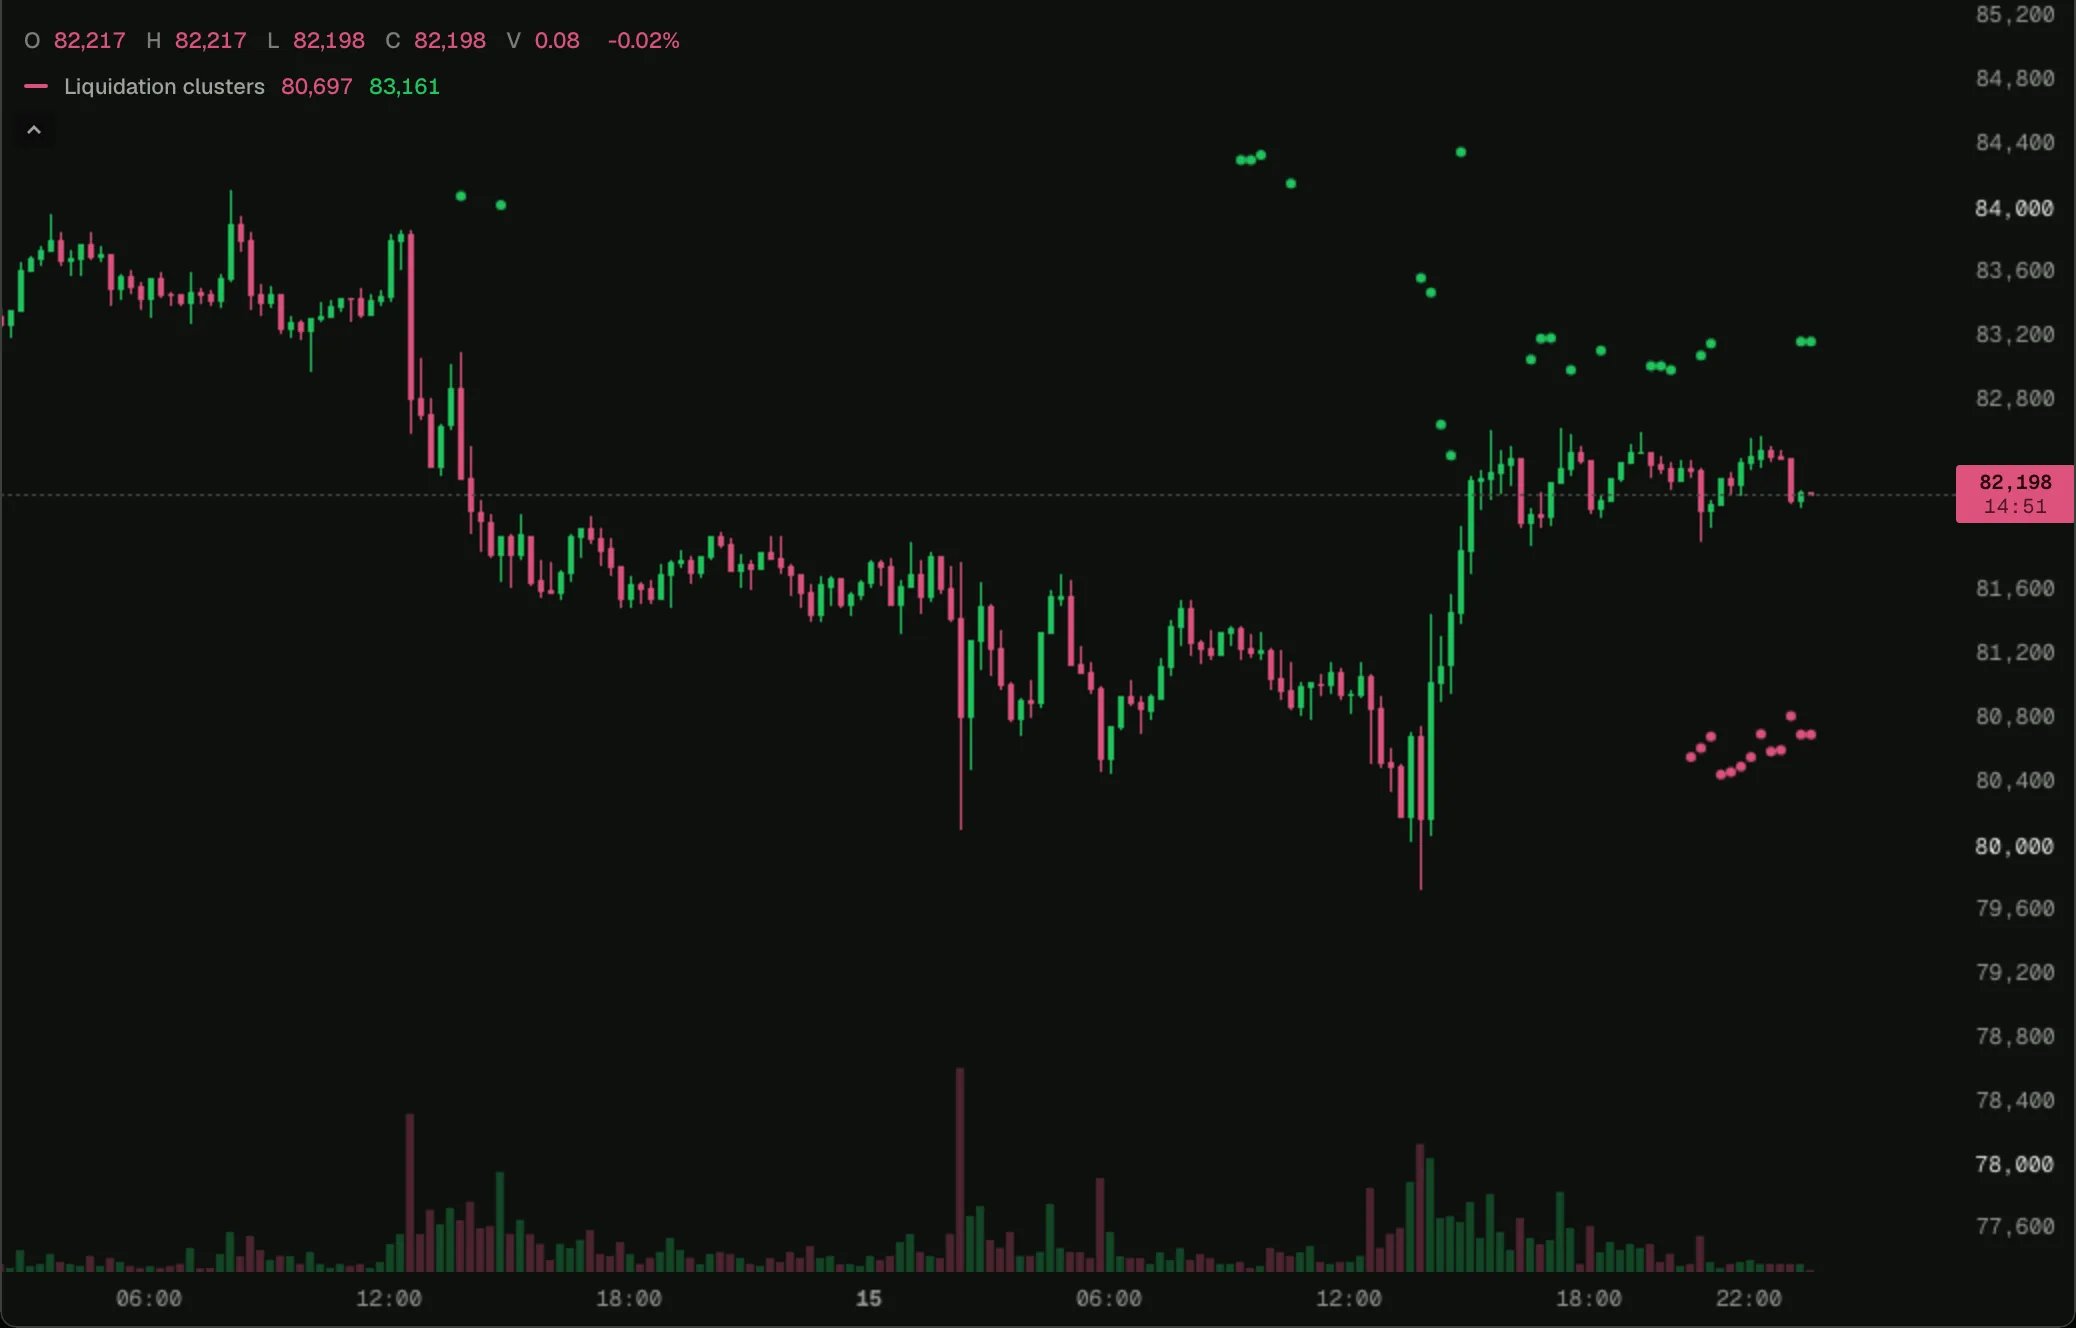
BTC on 15-minute bars in the 0xArchive Terminal, 2026-10-15.
Open on a chart
Load it on BTC 15m in the terminal, then change its settings or open it in the script editor.
How it works
The dots useautoscale: false, so levels up to 10% away do not squash the candles into a line: they are drawn where they fall, and the parts outside the view are simply not seen. See Liquidation levels ahead for the newest snapshot drawn as lines.
The script
liquidation-clusters.ts