

On 0xArchive’s data
Each trade’s change in open interest, liquidated wallets, liquidation levels, the tape, the book and breadth.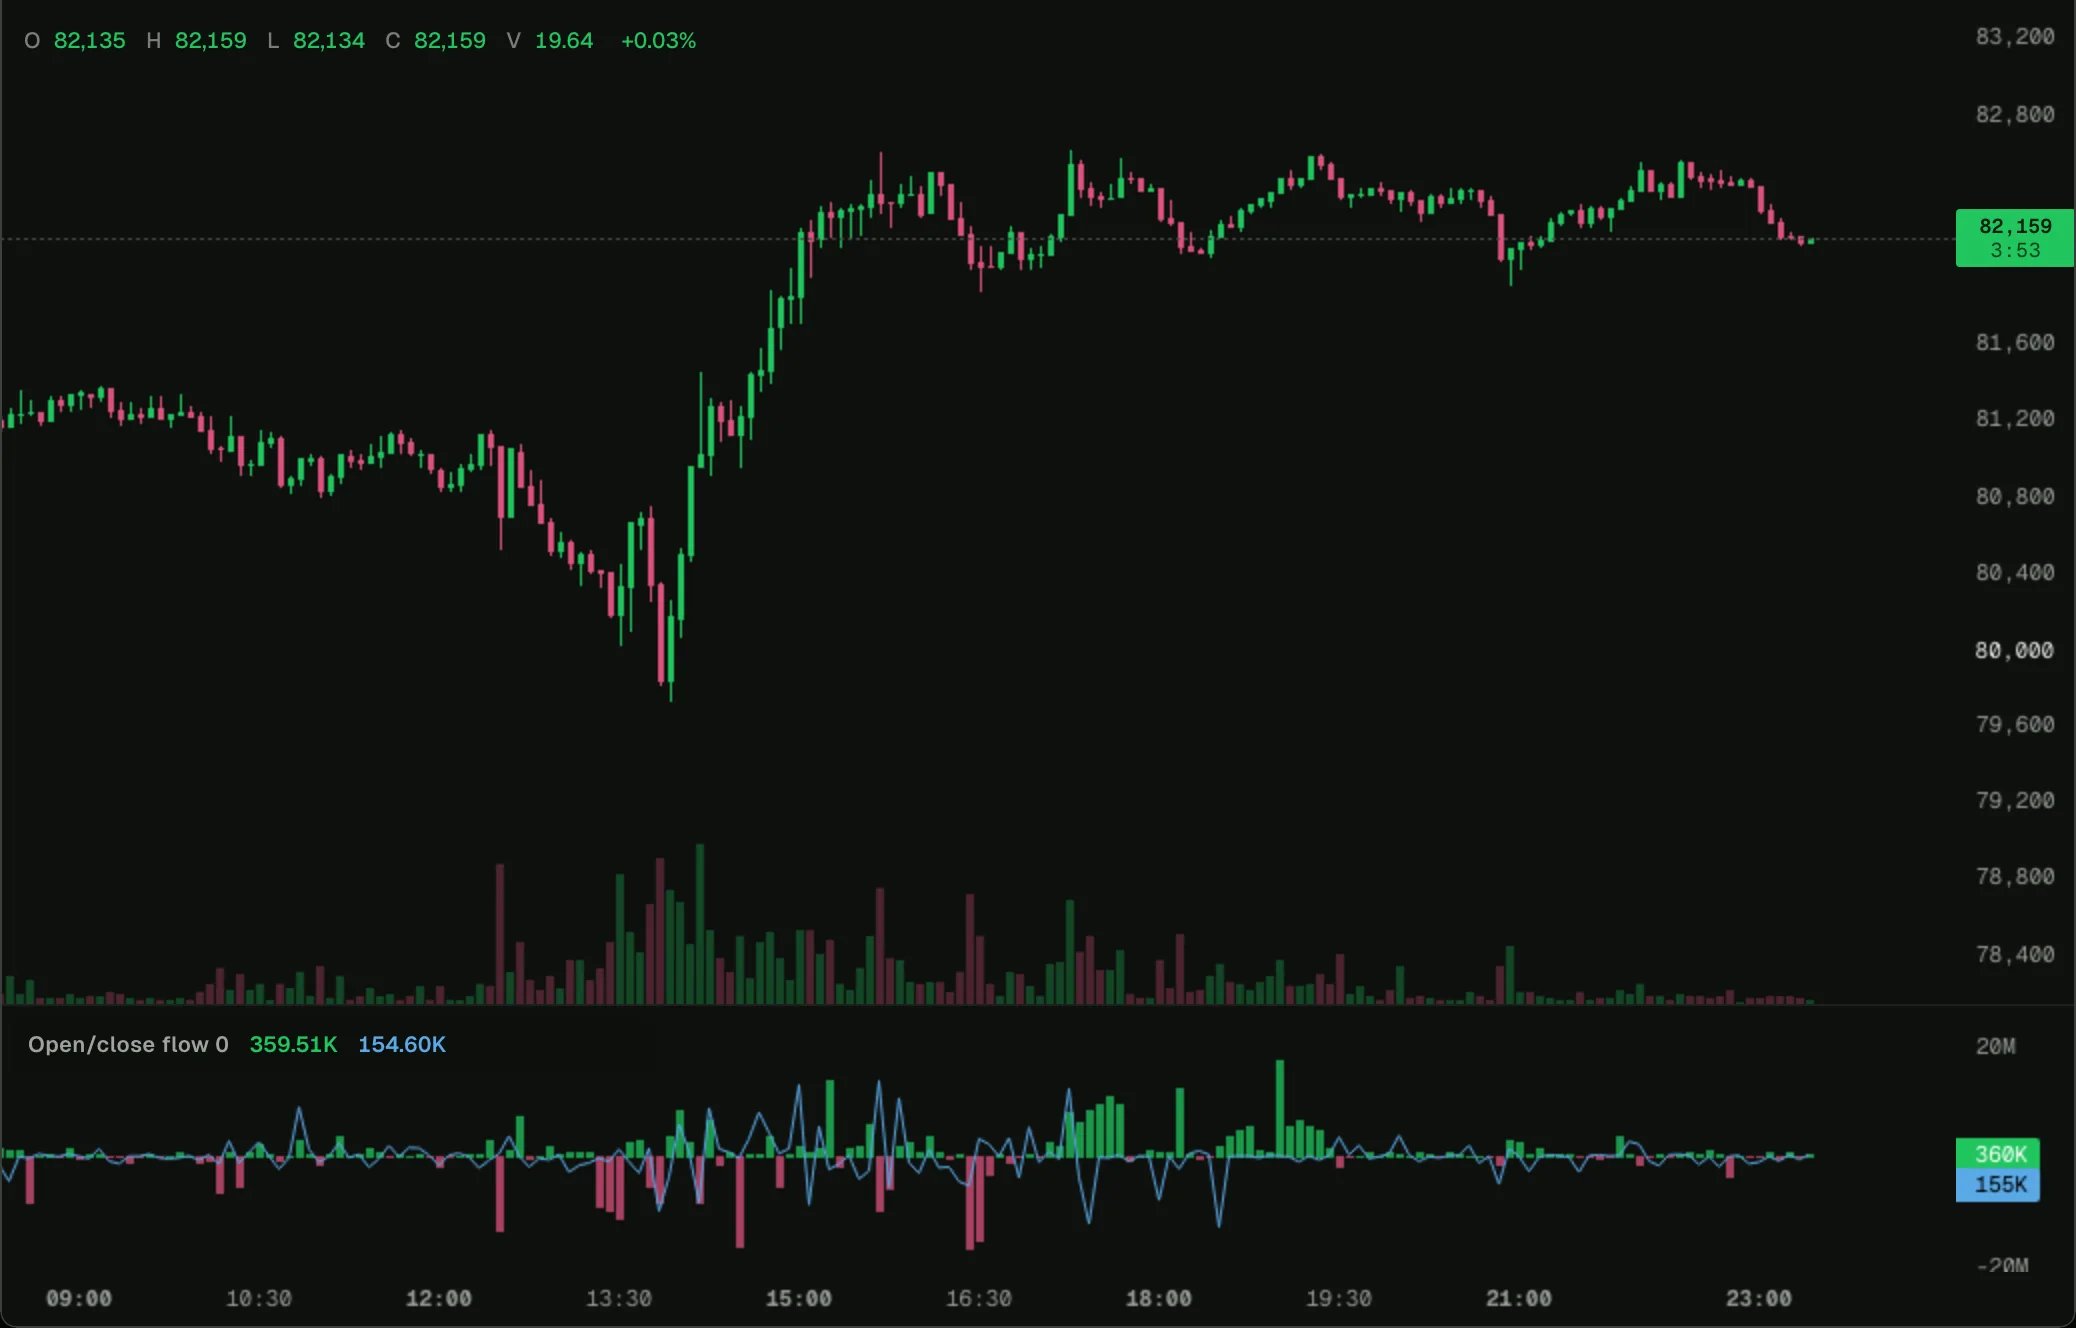
Opening and closing flow
Split taker flow into trades that opened positions and trades that closed them, from each trade’s own change in open interest.
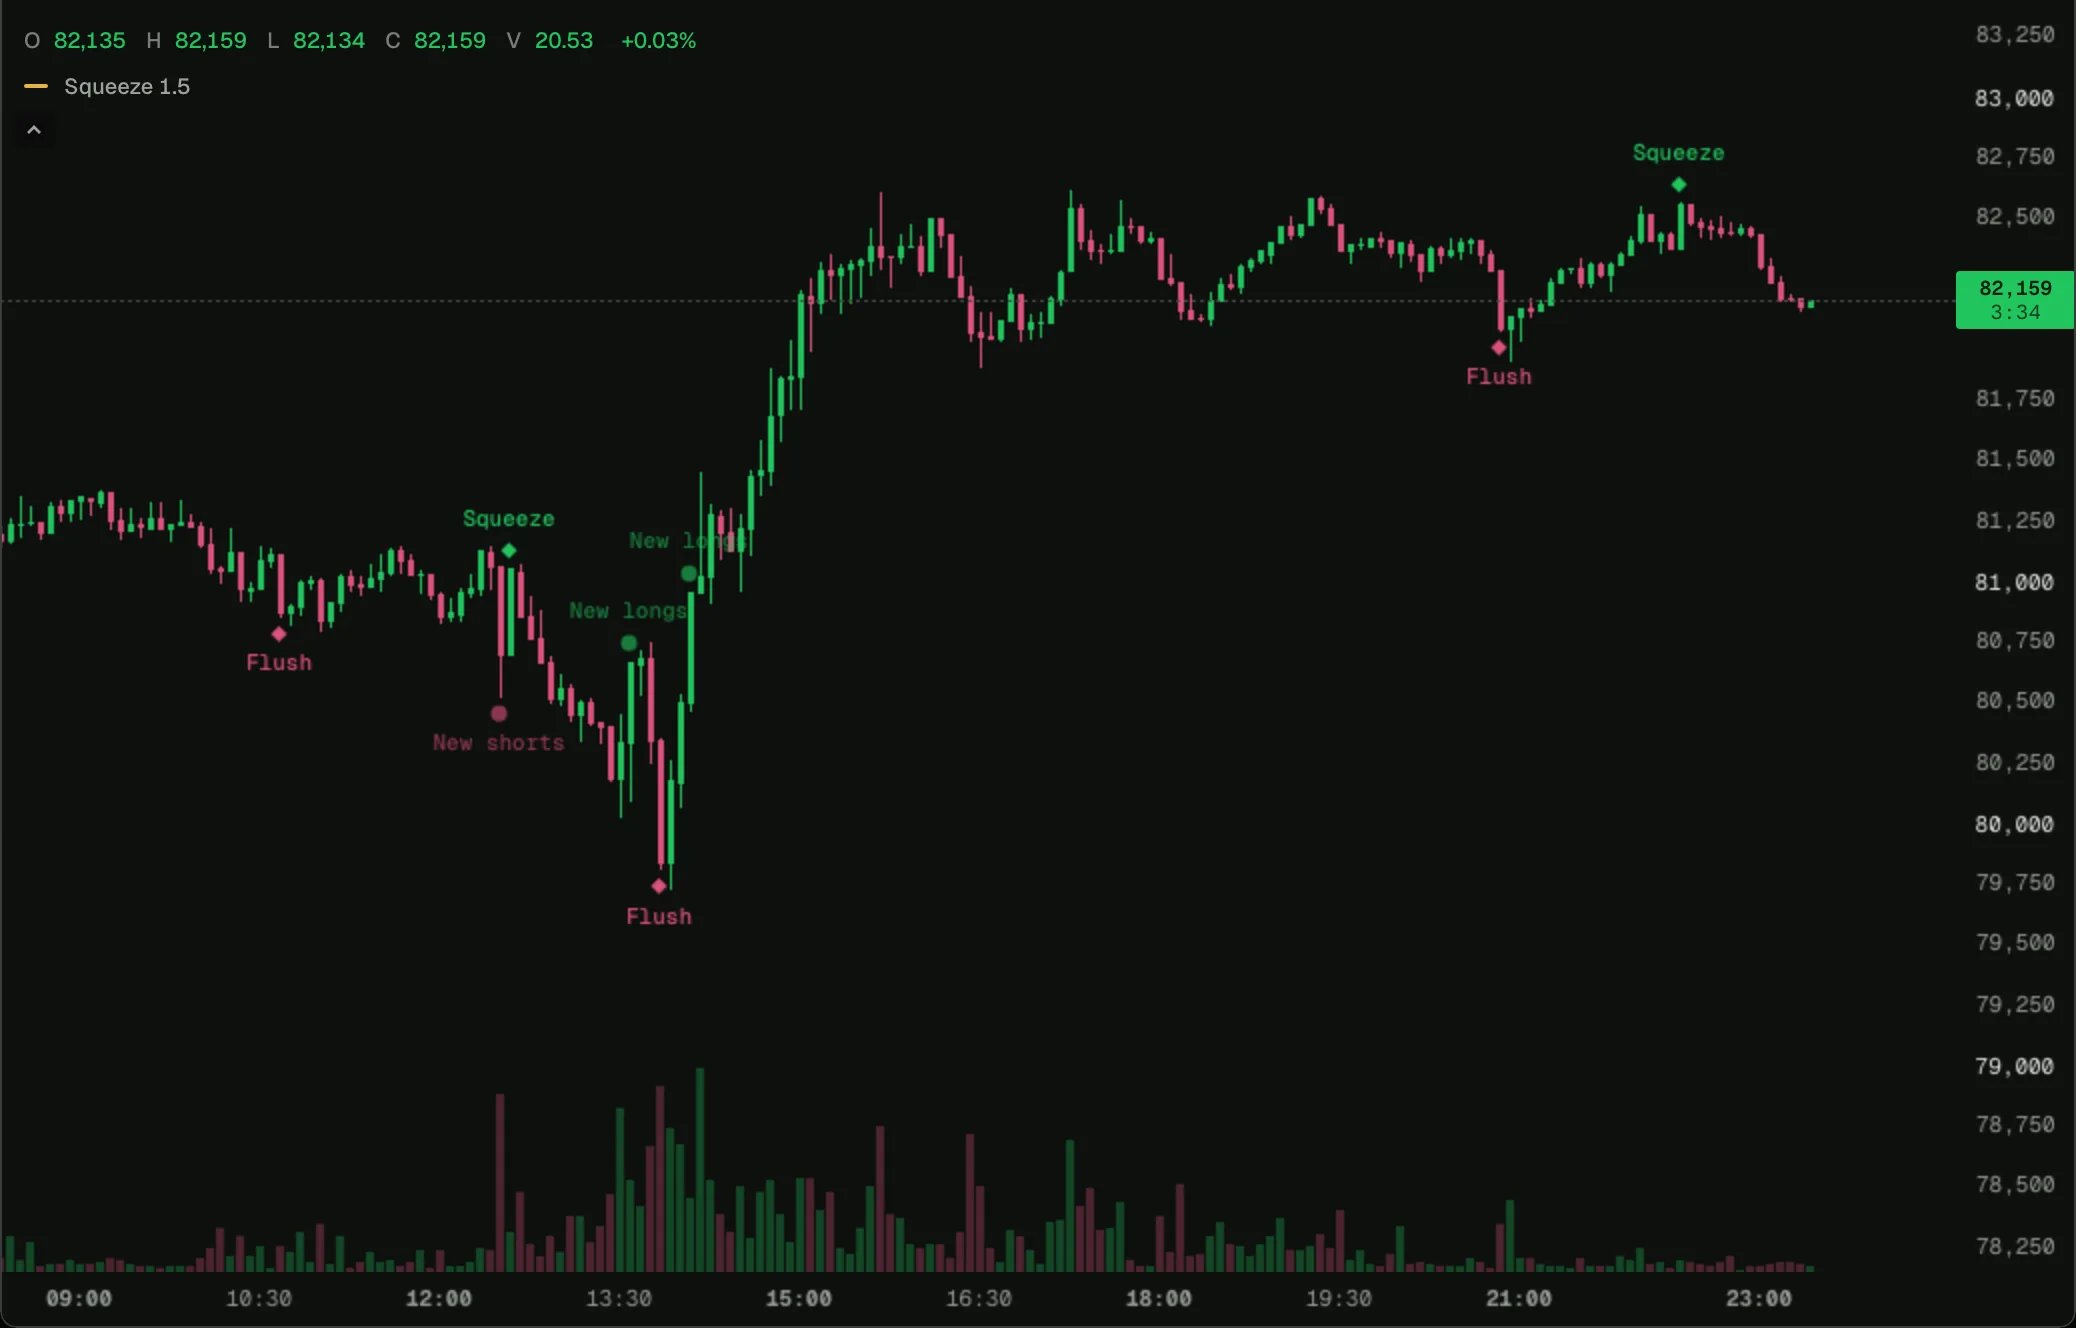
Squeeze or new positions
Label every big candle by whether it was driven by positions closing (a squeeze or a flush) or by new positions opening.
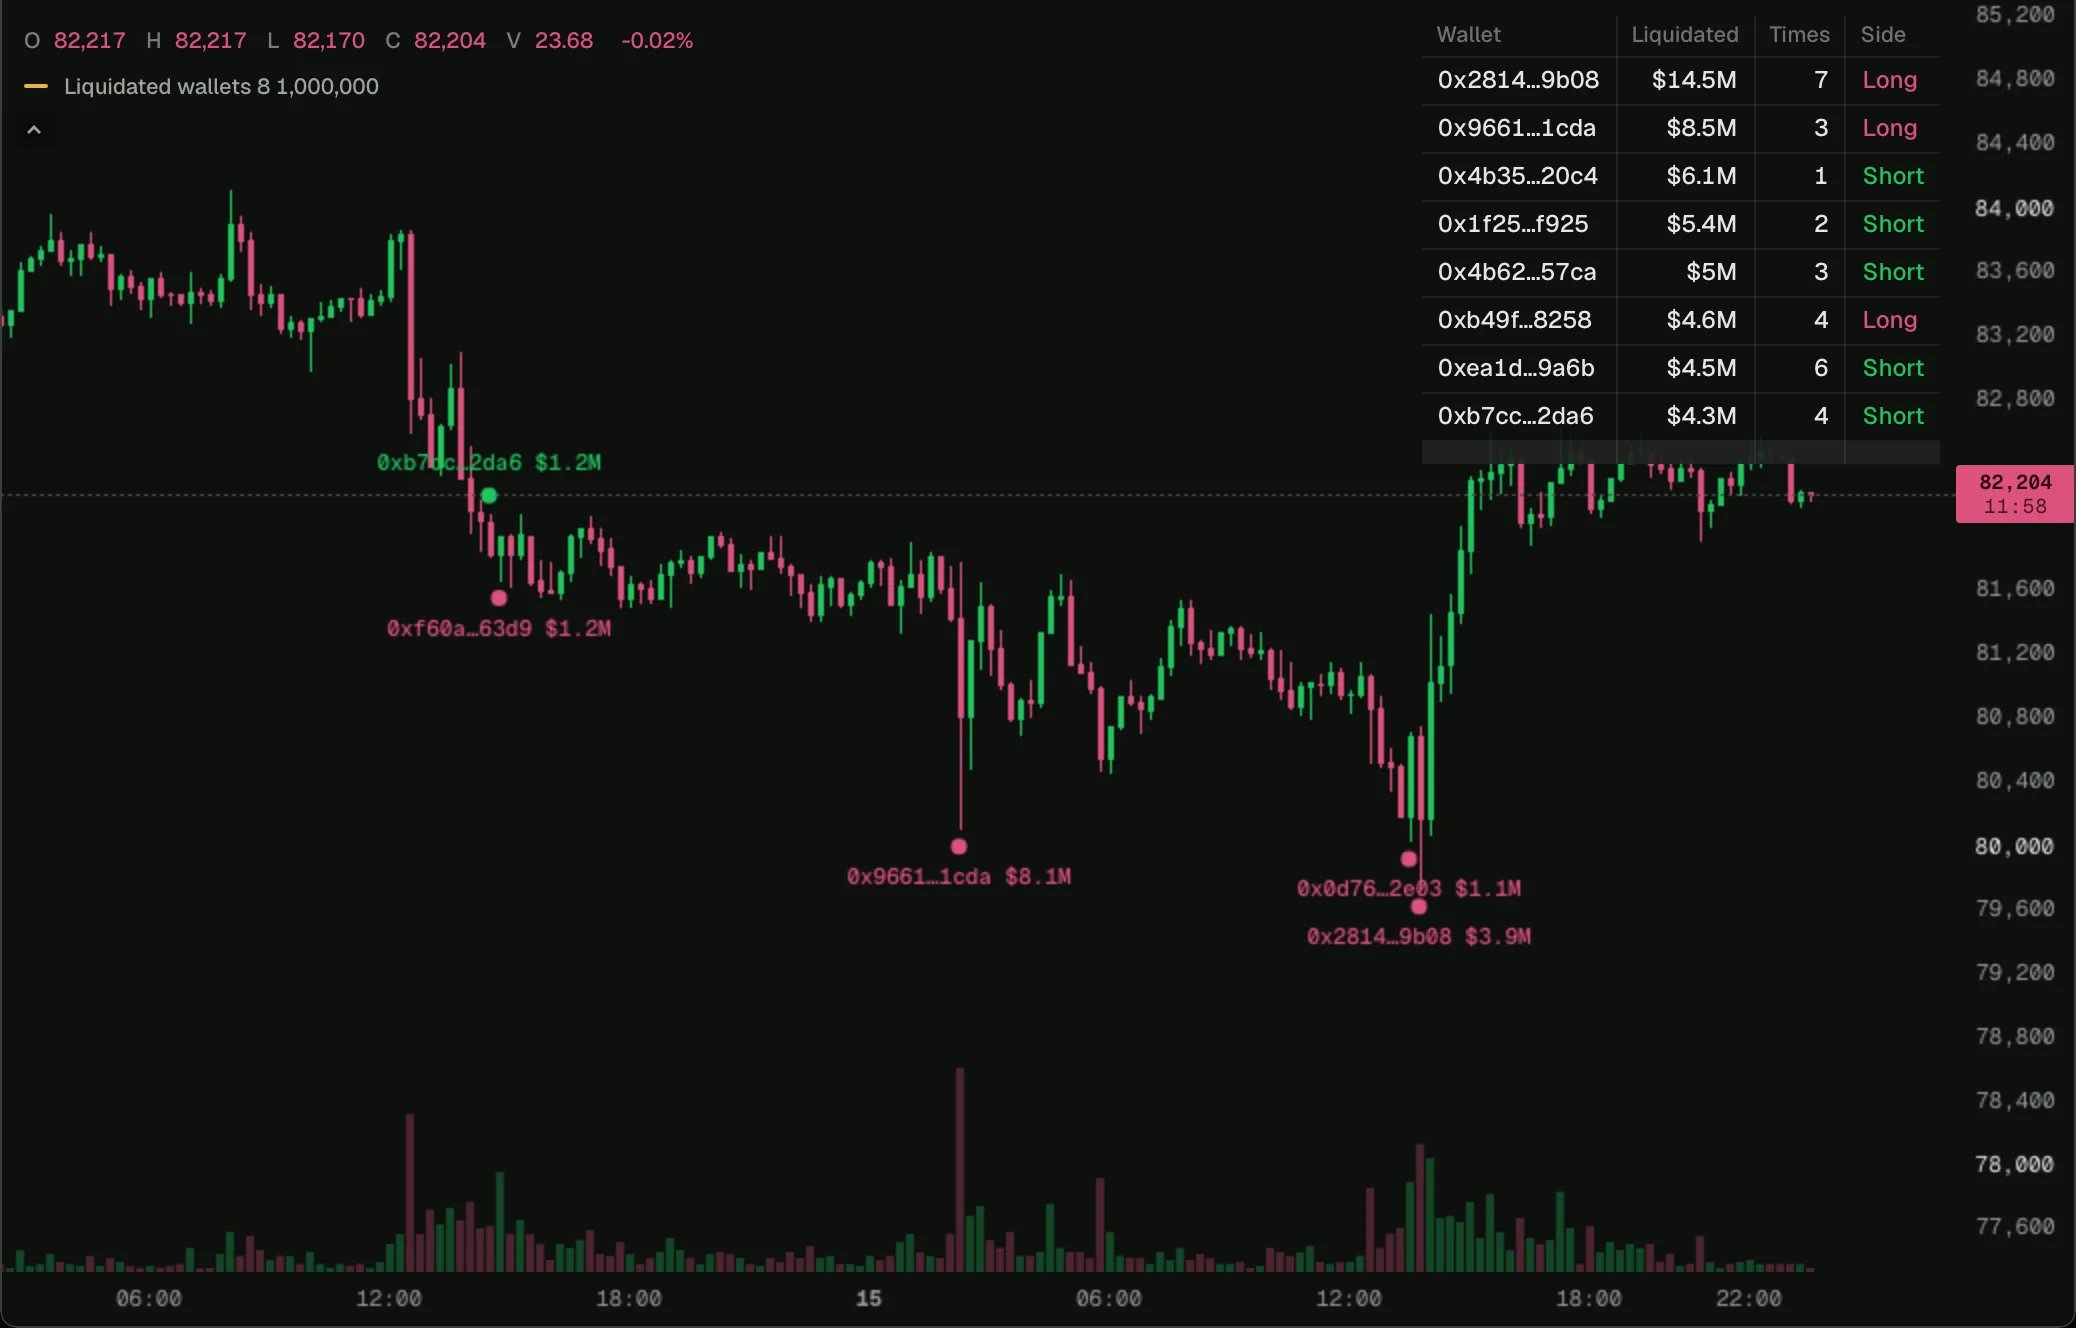
Most-liquidated wallets
Rank the wallets liquidated for the most this week, and mark the biggest one on each bar with its address.
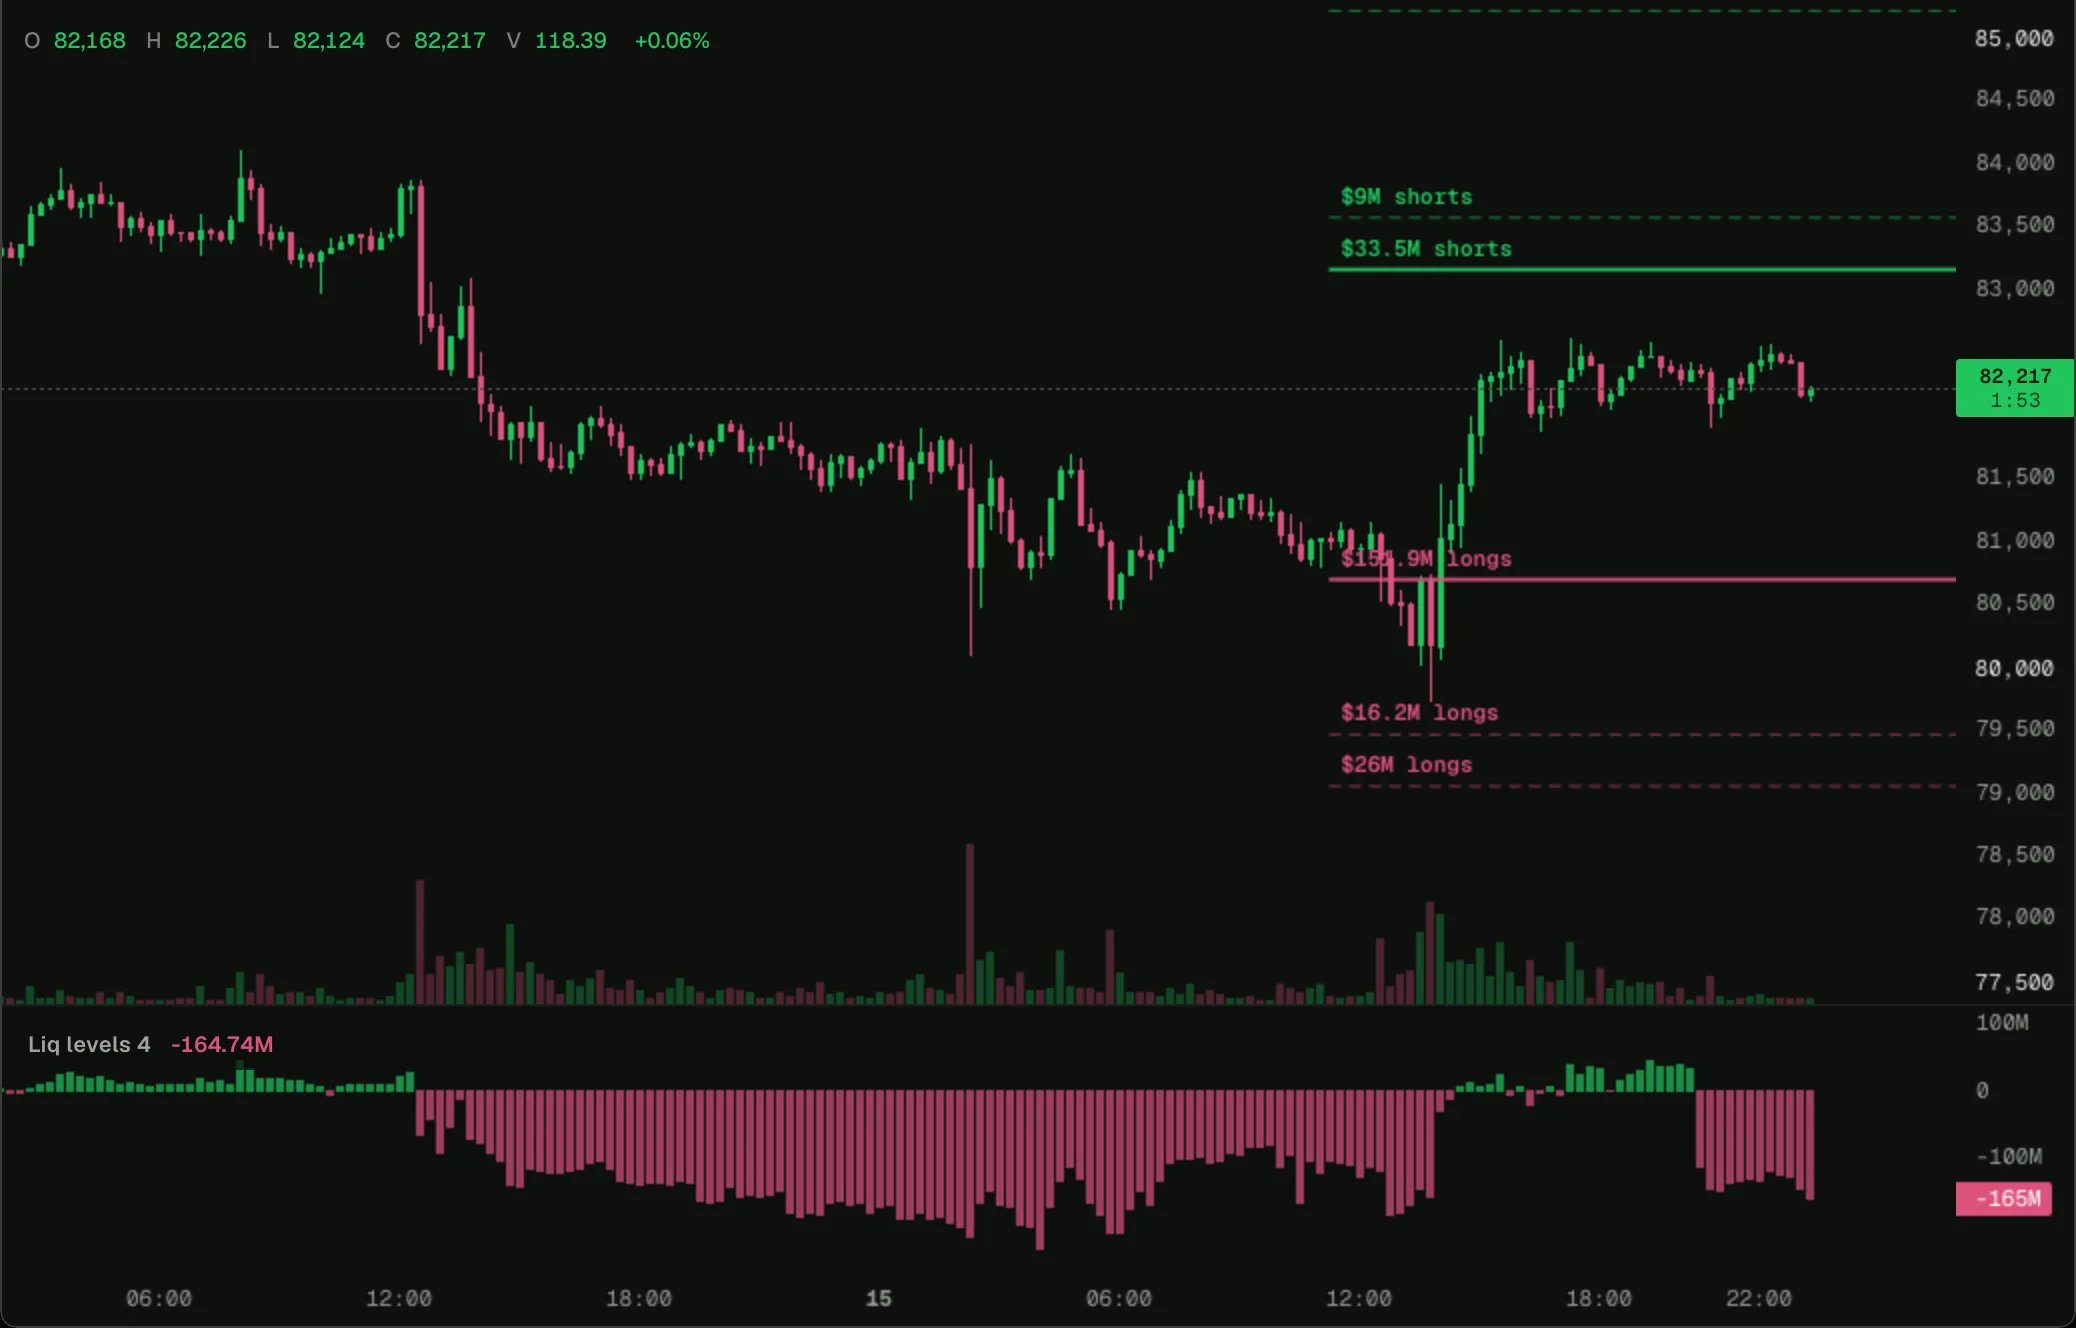
Liquidation levels ahead
Draw the biggest liquidation clusters above and below the price, and the balance of shorts above against longs below on every bar.
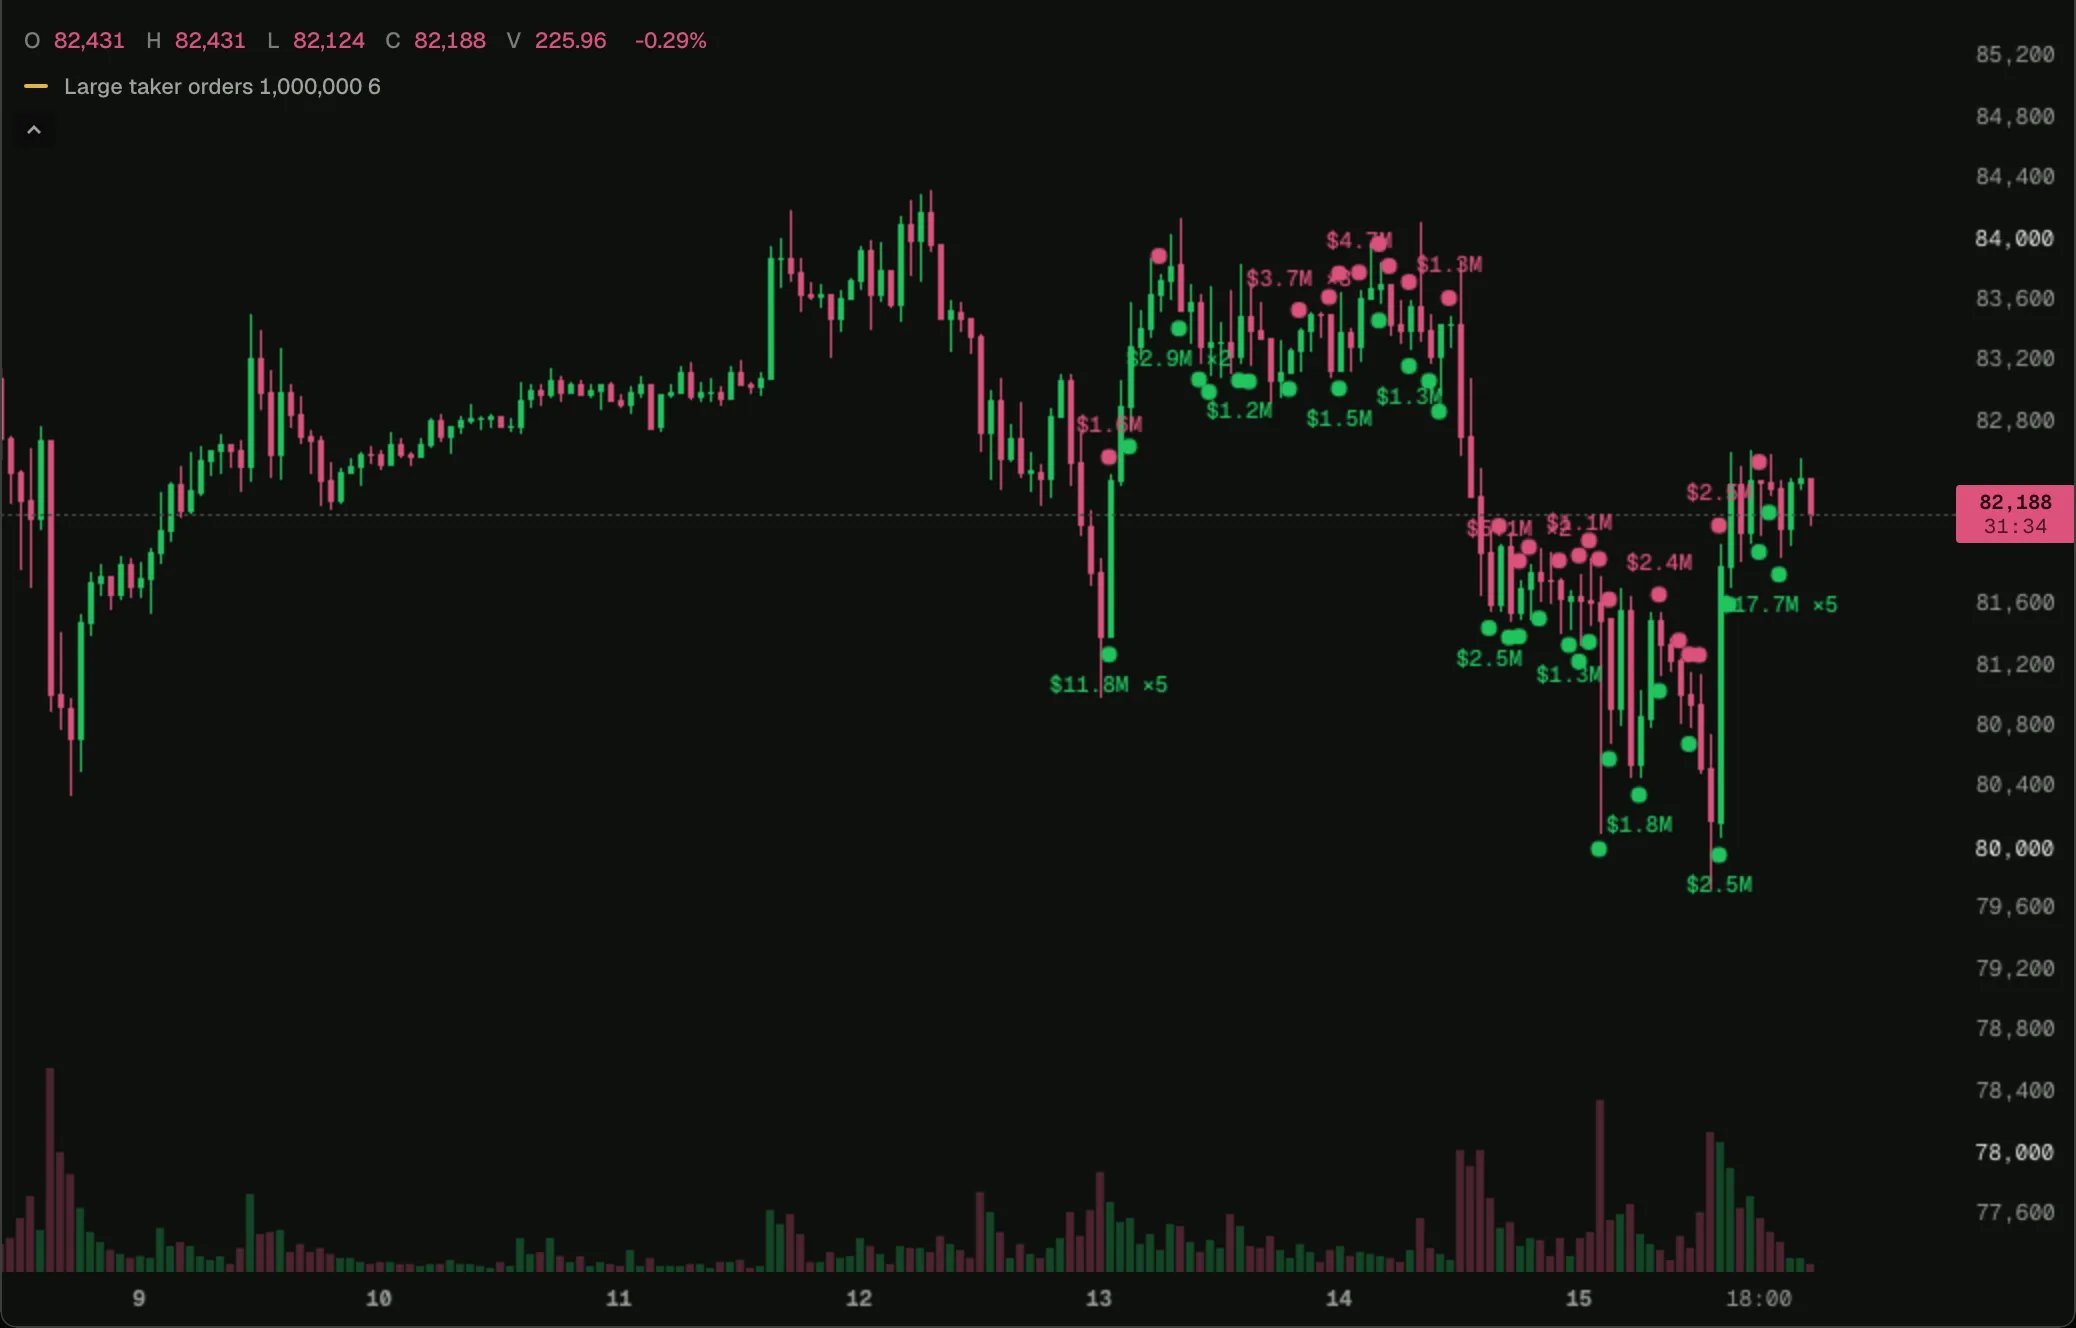
Large taker orders
Mark every bar where a single taker order filled for more than a size, joined from its fills.
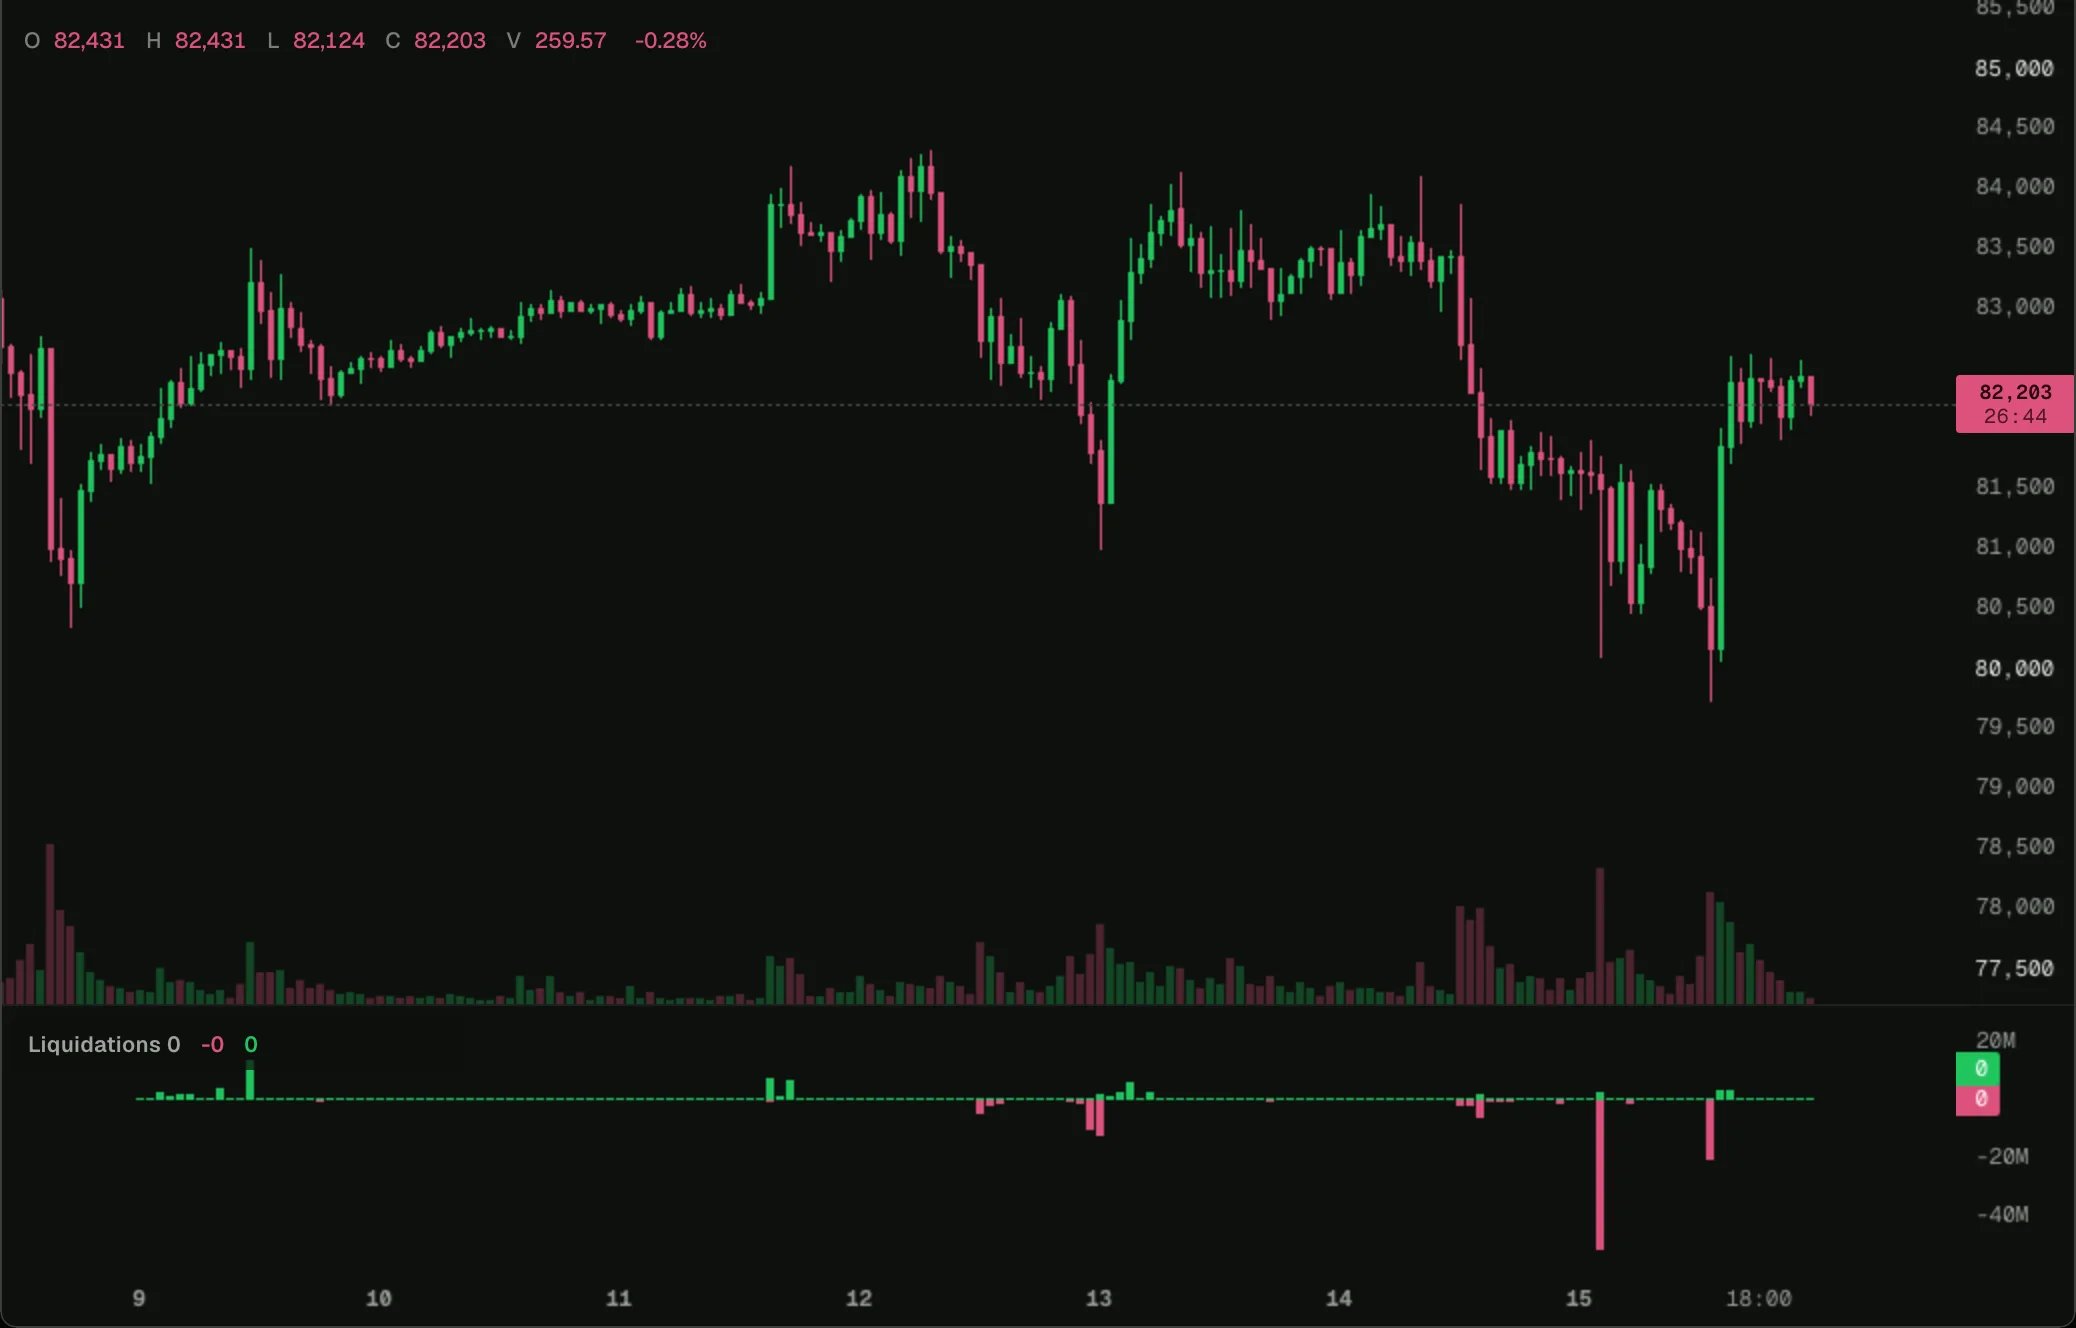
Liquidations
Liquidated USD per bar, longs below zero and shorts above, optionally for chosen wallets only.
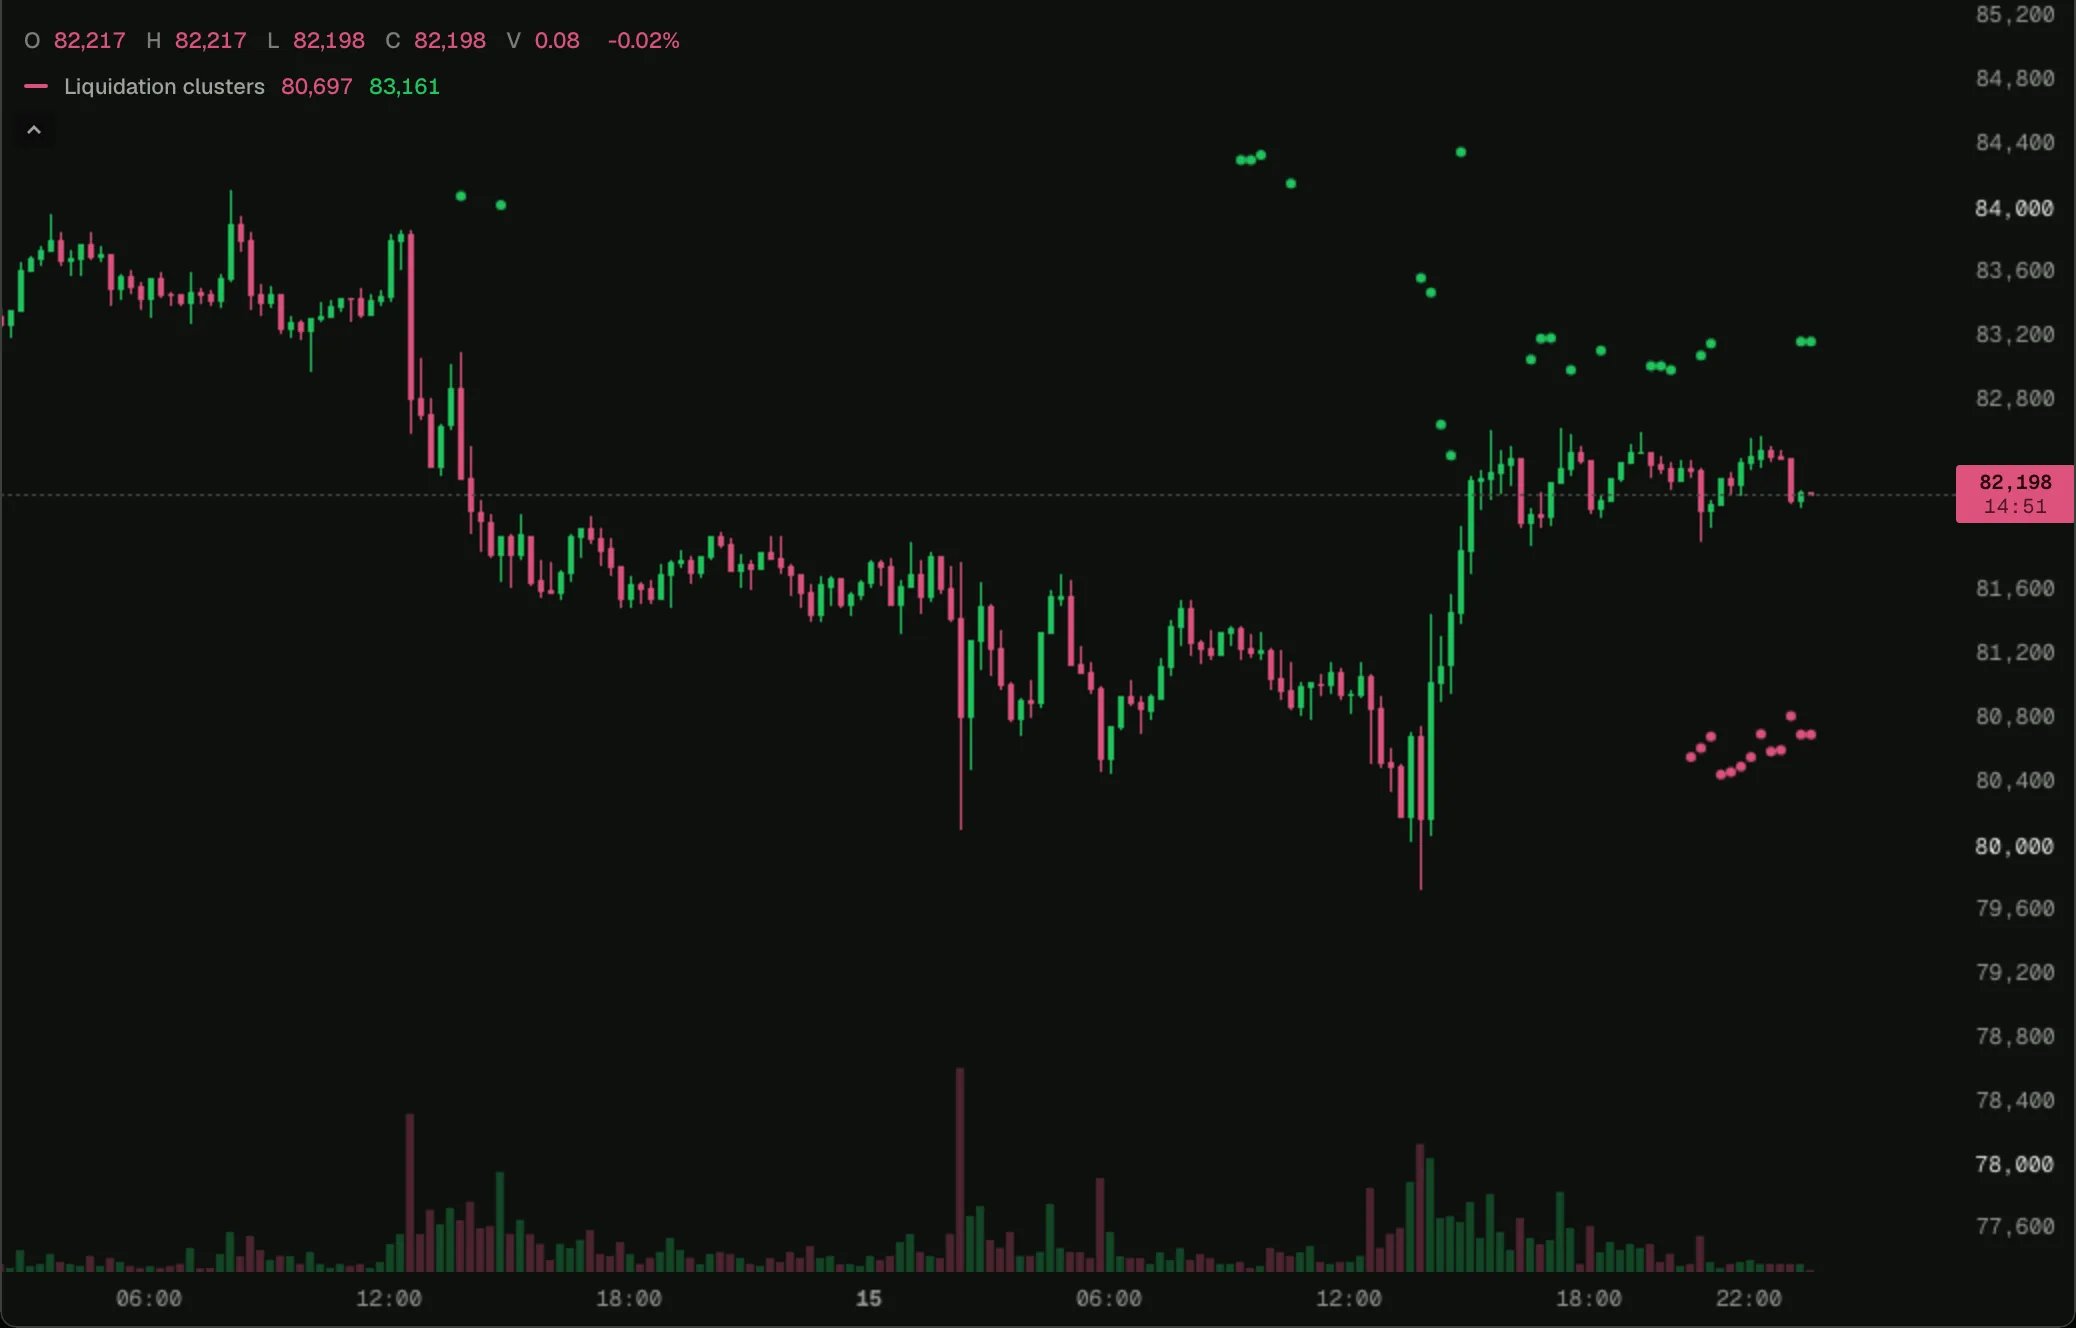
Liquidation clusters
The single biggest long and short liquidation level within 10% of the price, as of each bar.
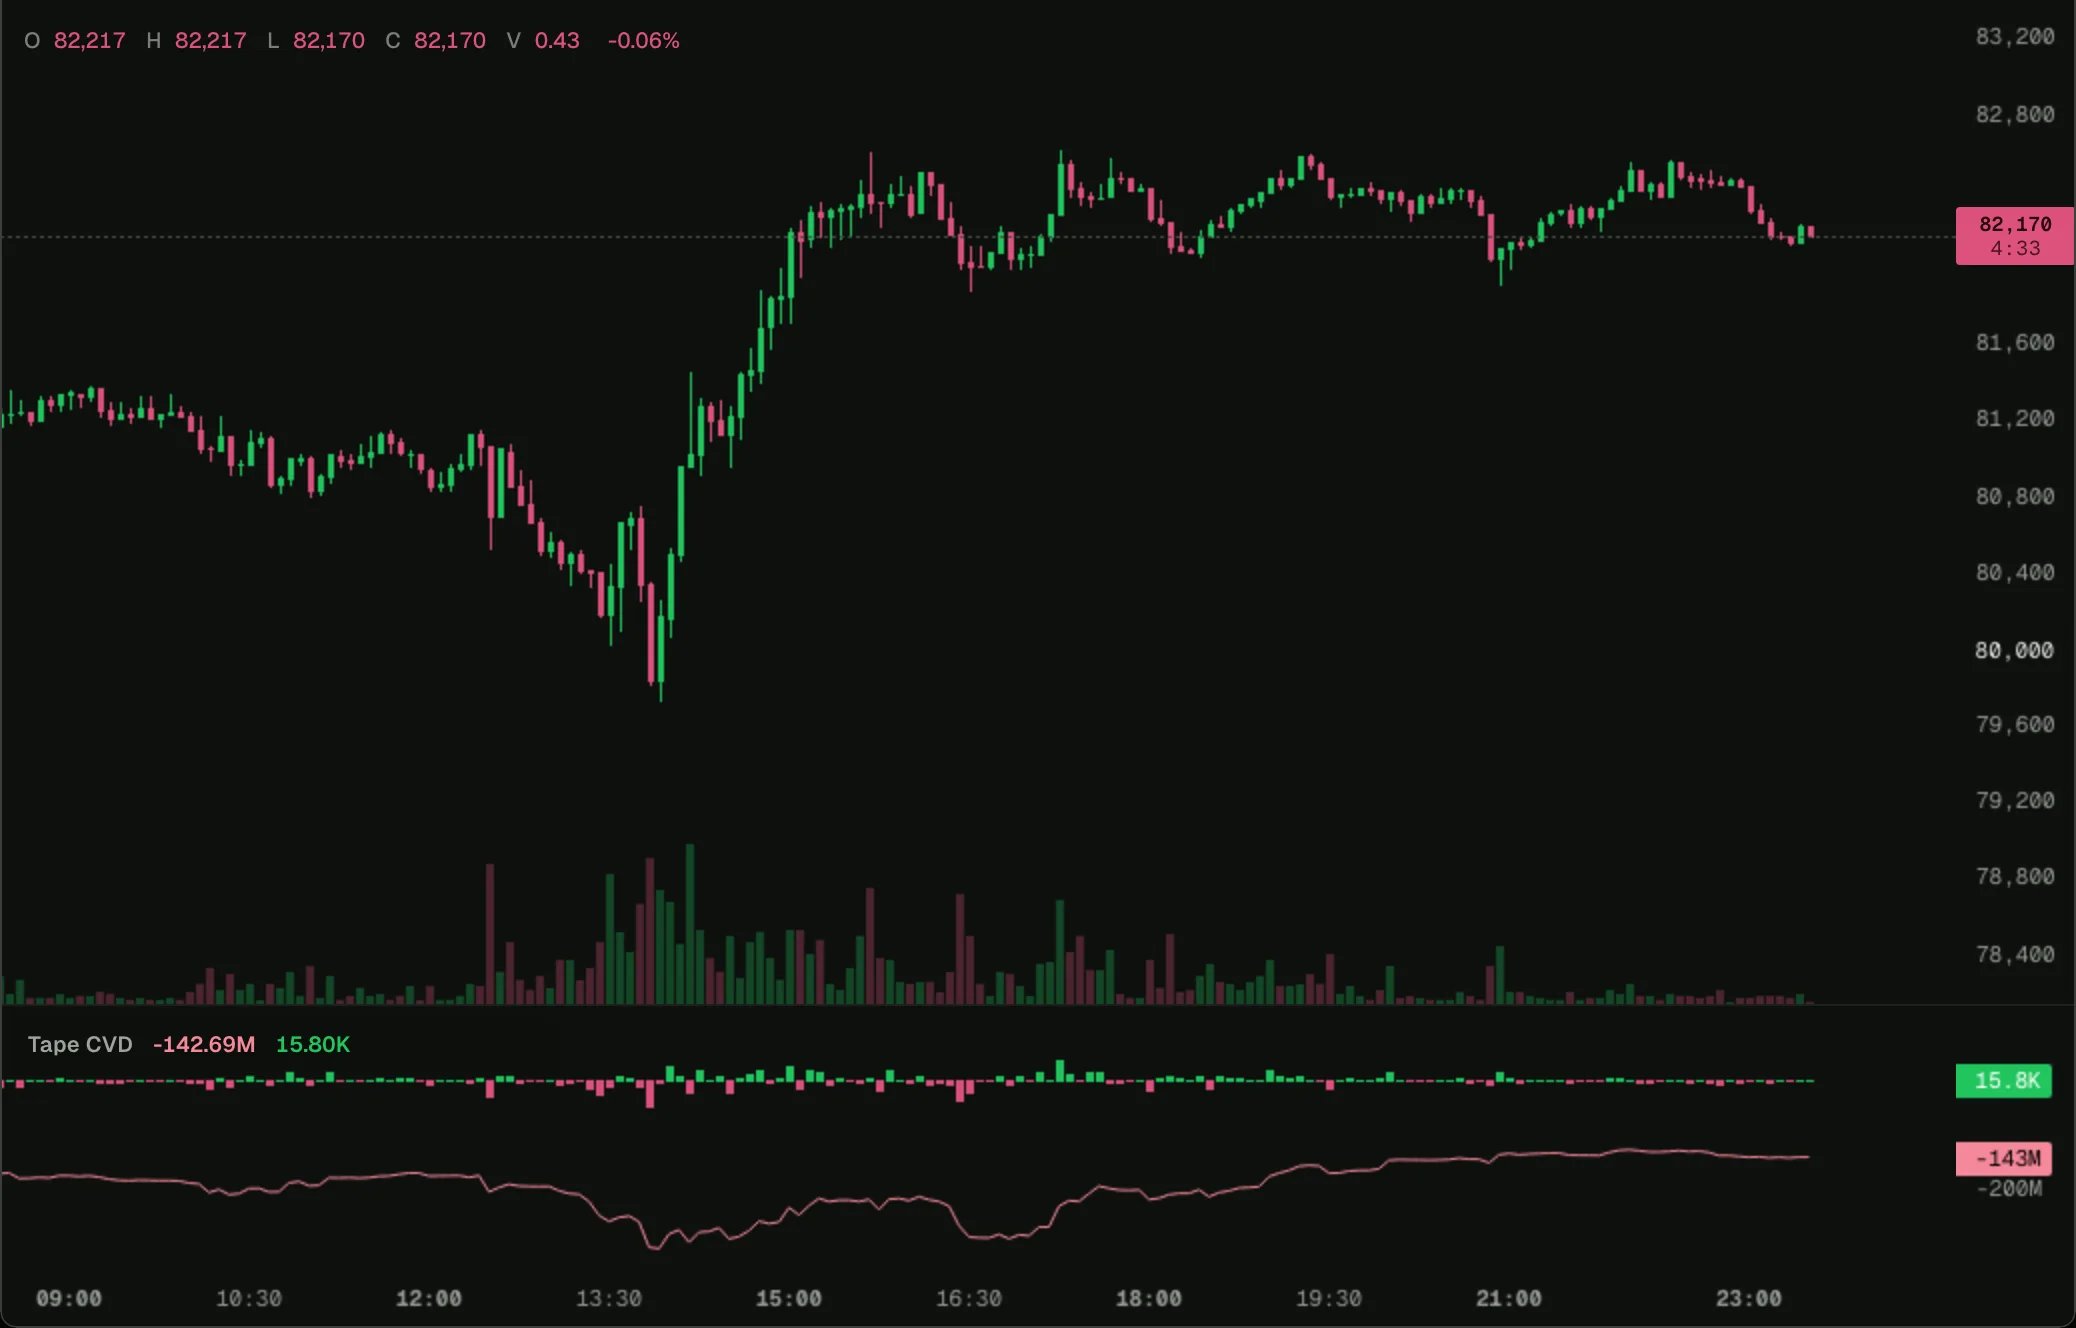
Tape CVD
Cumulative volume delta from the tape, in USD, with each bar’s delta as a histogram.
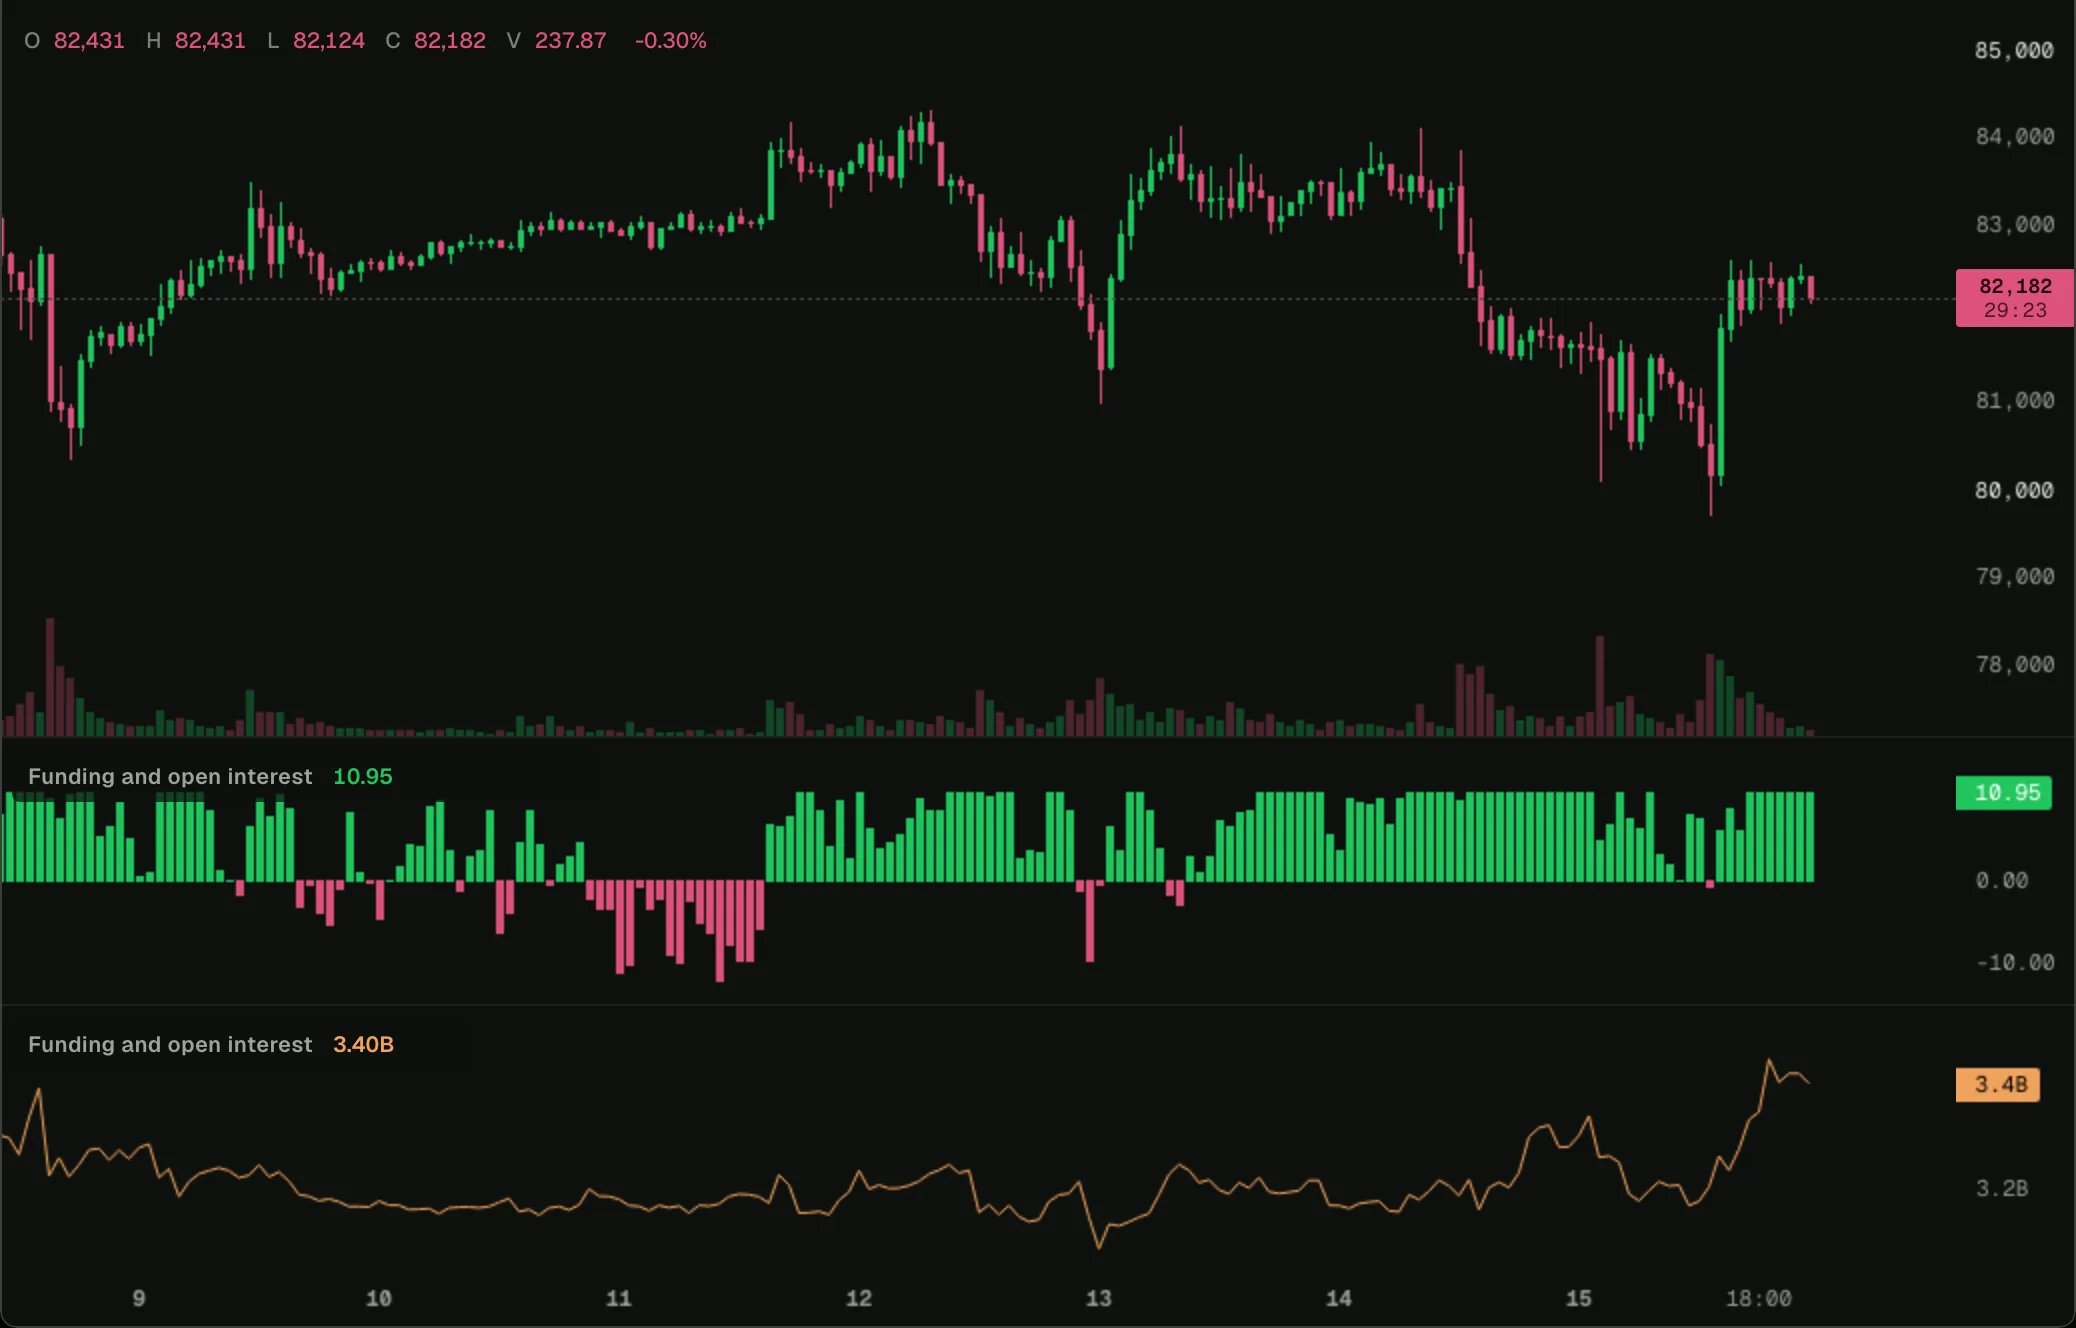
Funding and open interest
Funding annualised from the hourly rate, and open interest in USD, from 5-minute samples.
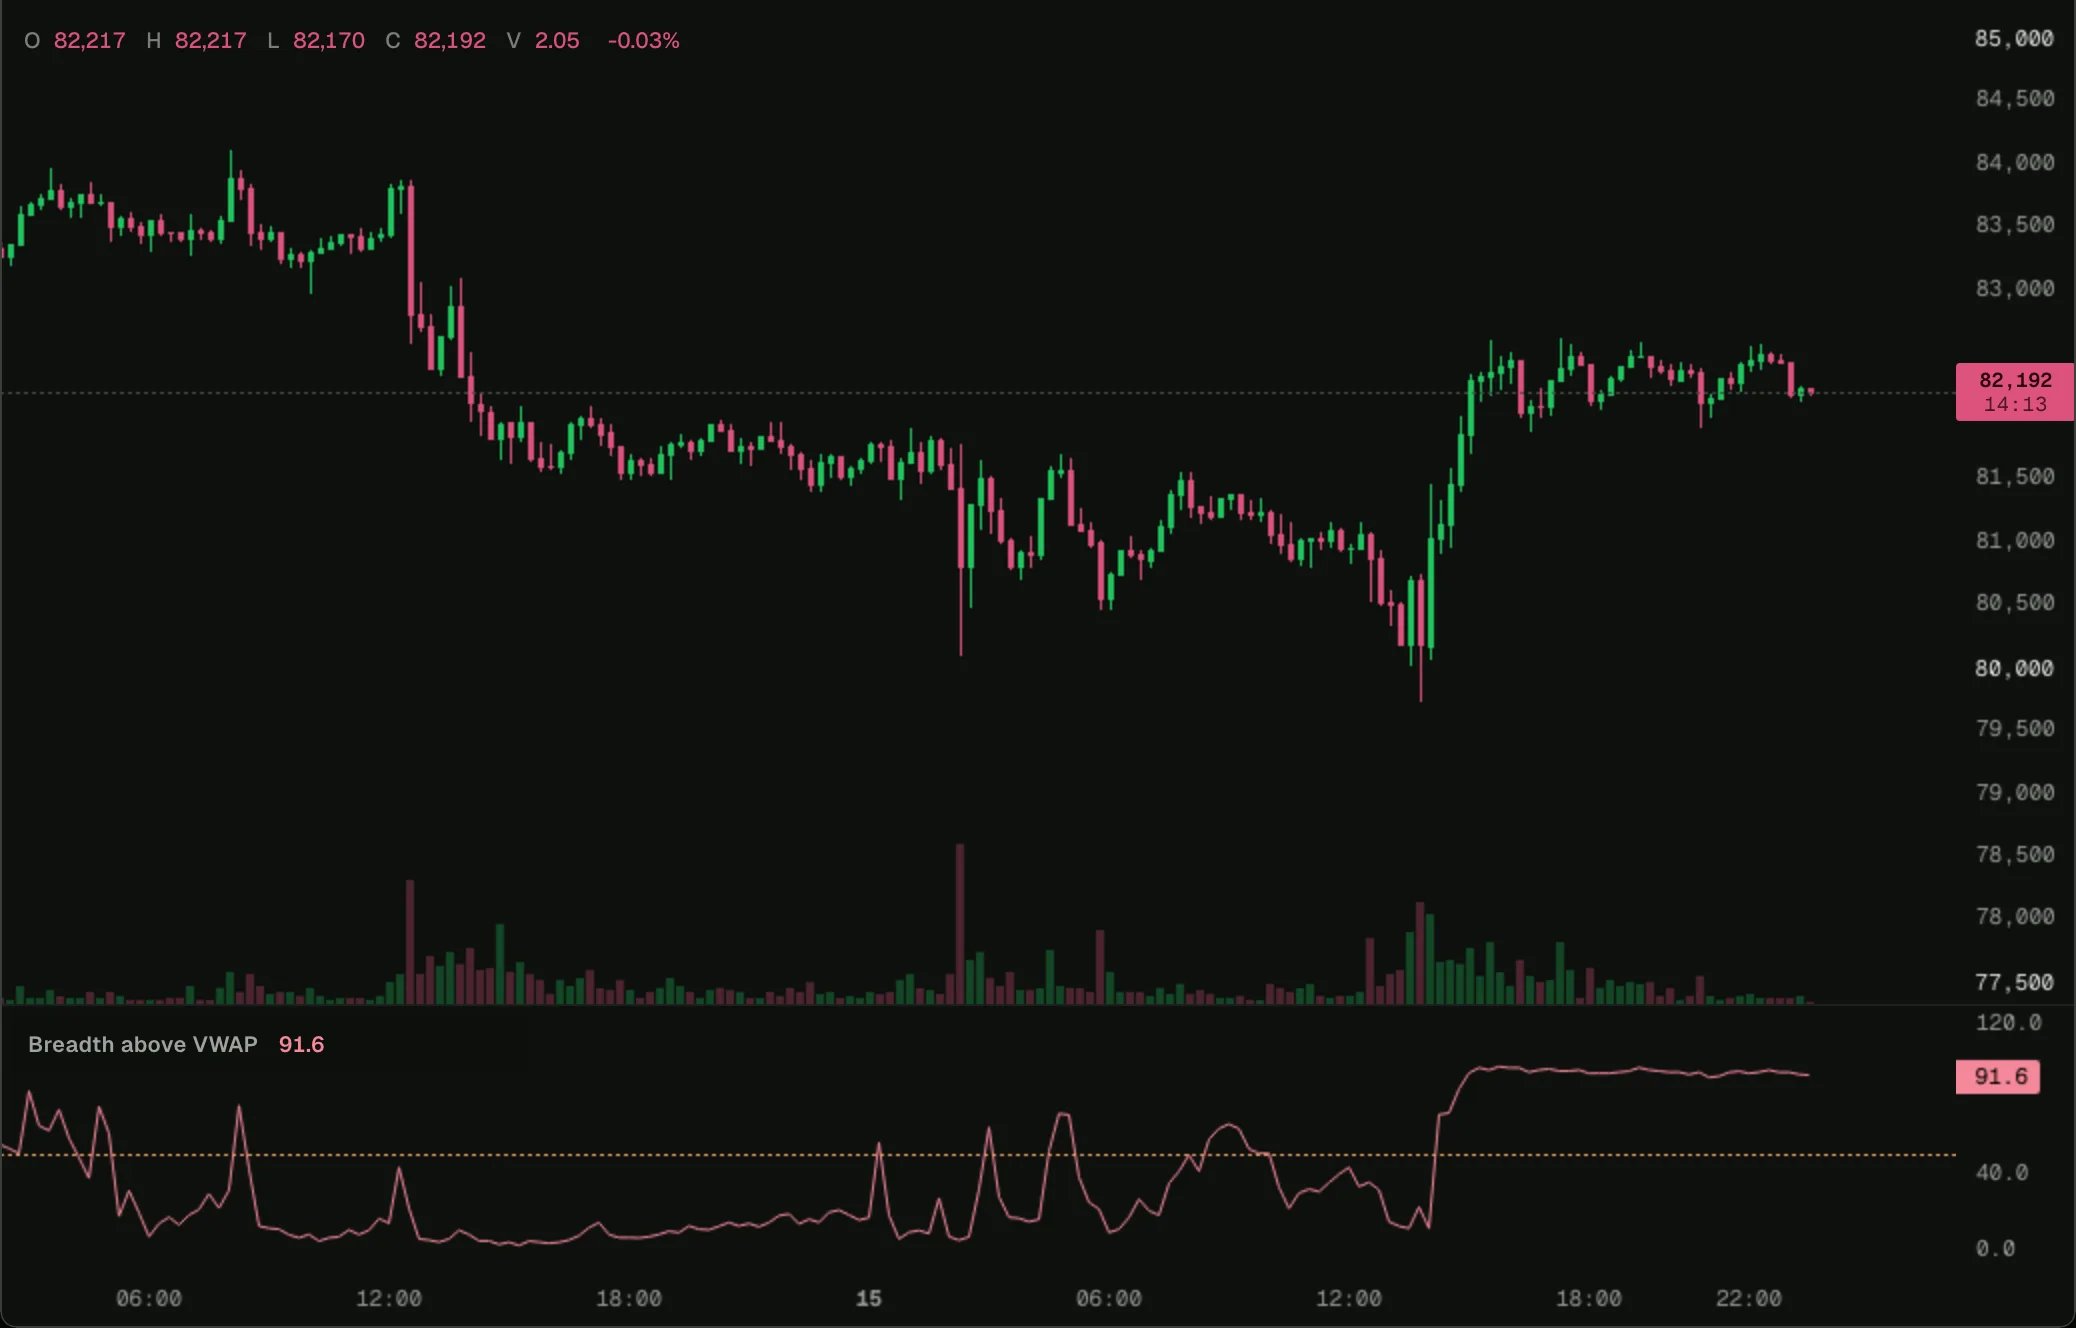
Breadth above VWAP
The share of Hyperliquid’s perps trading above their session VWAP, as of each bar.
Bid share within a band
The share of resting size on the bid within a band around the mid, from the live book.
Indicators and outputs
Moving averages, other timeframes and markets, bar colours, tables and offsets.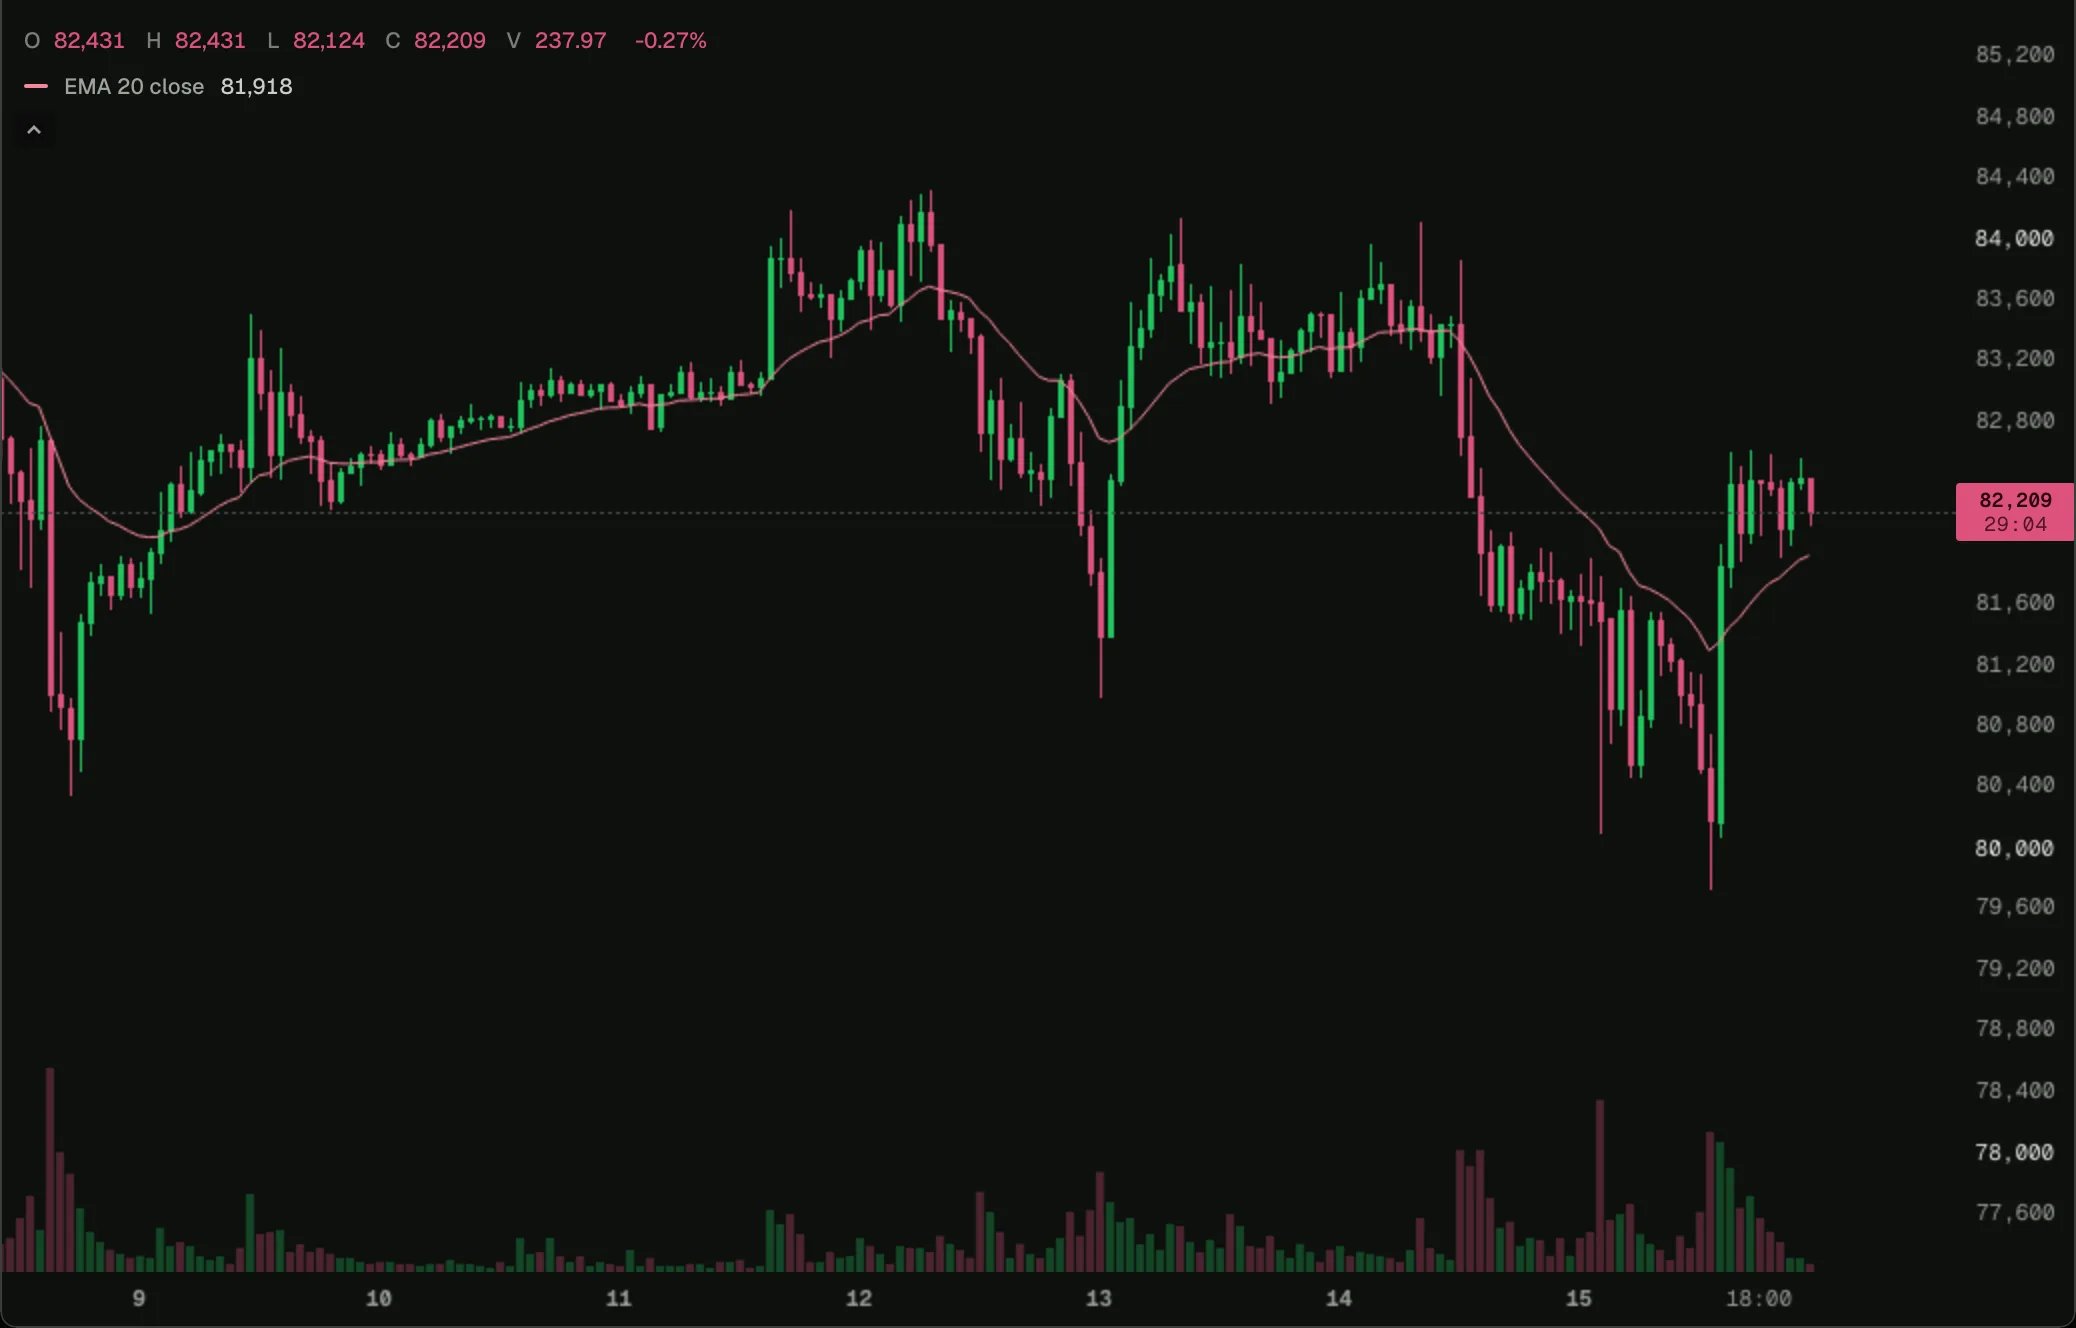
EMA
An exponential moving average, seeded the way TradingView seeds it.
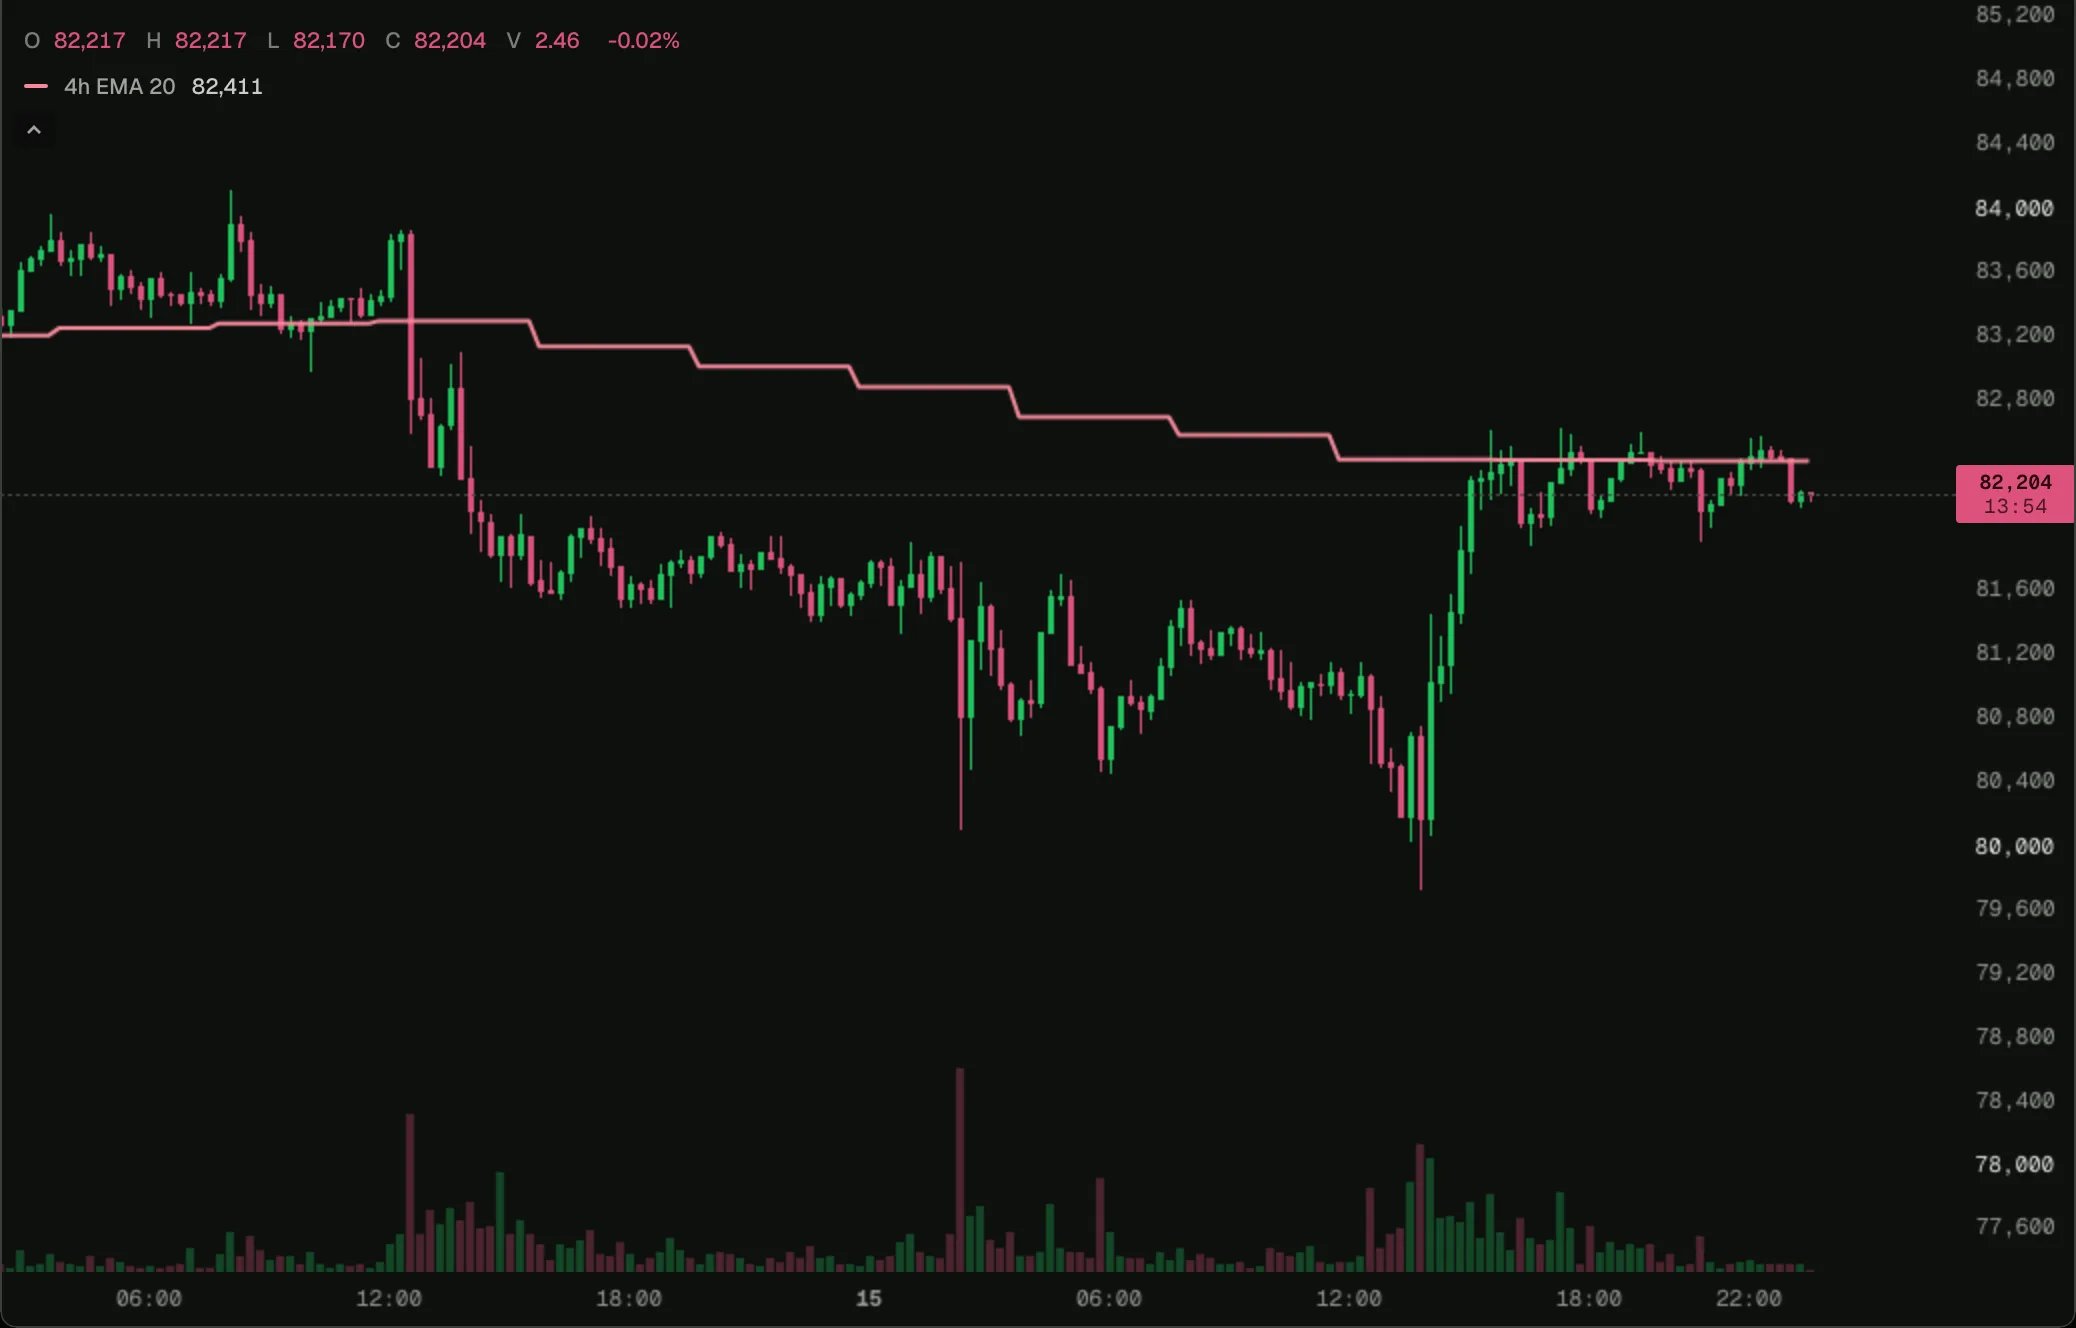
4h EMA
An EMA of 4-hour bars on any chart, with no lookahead.
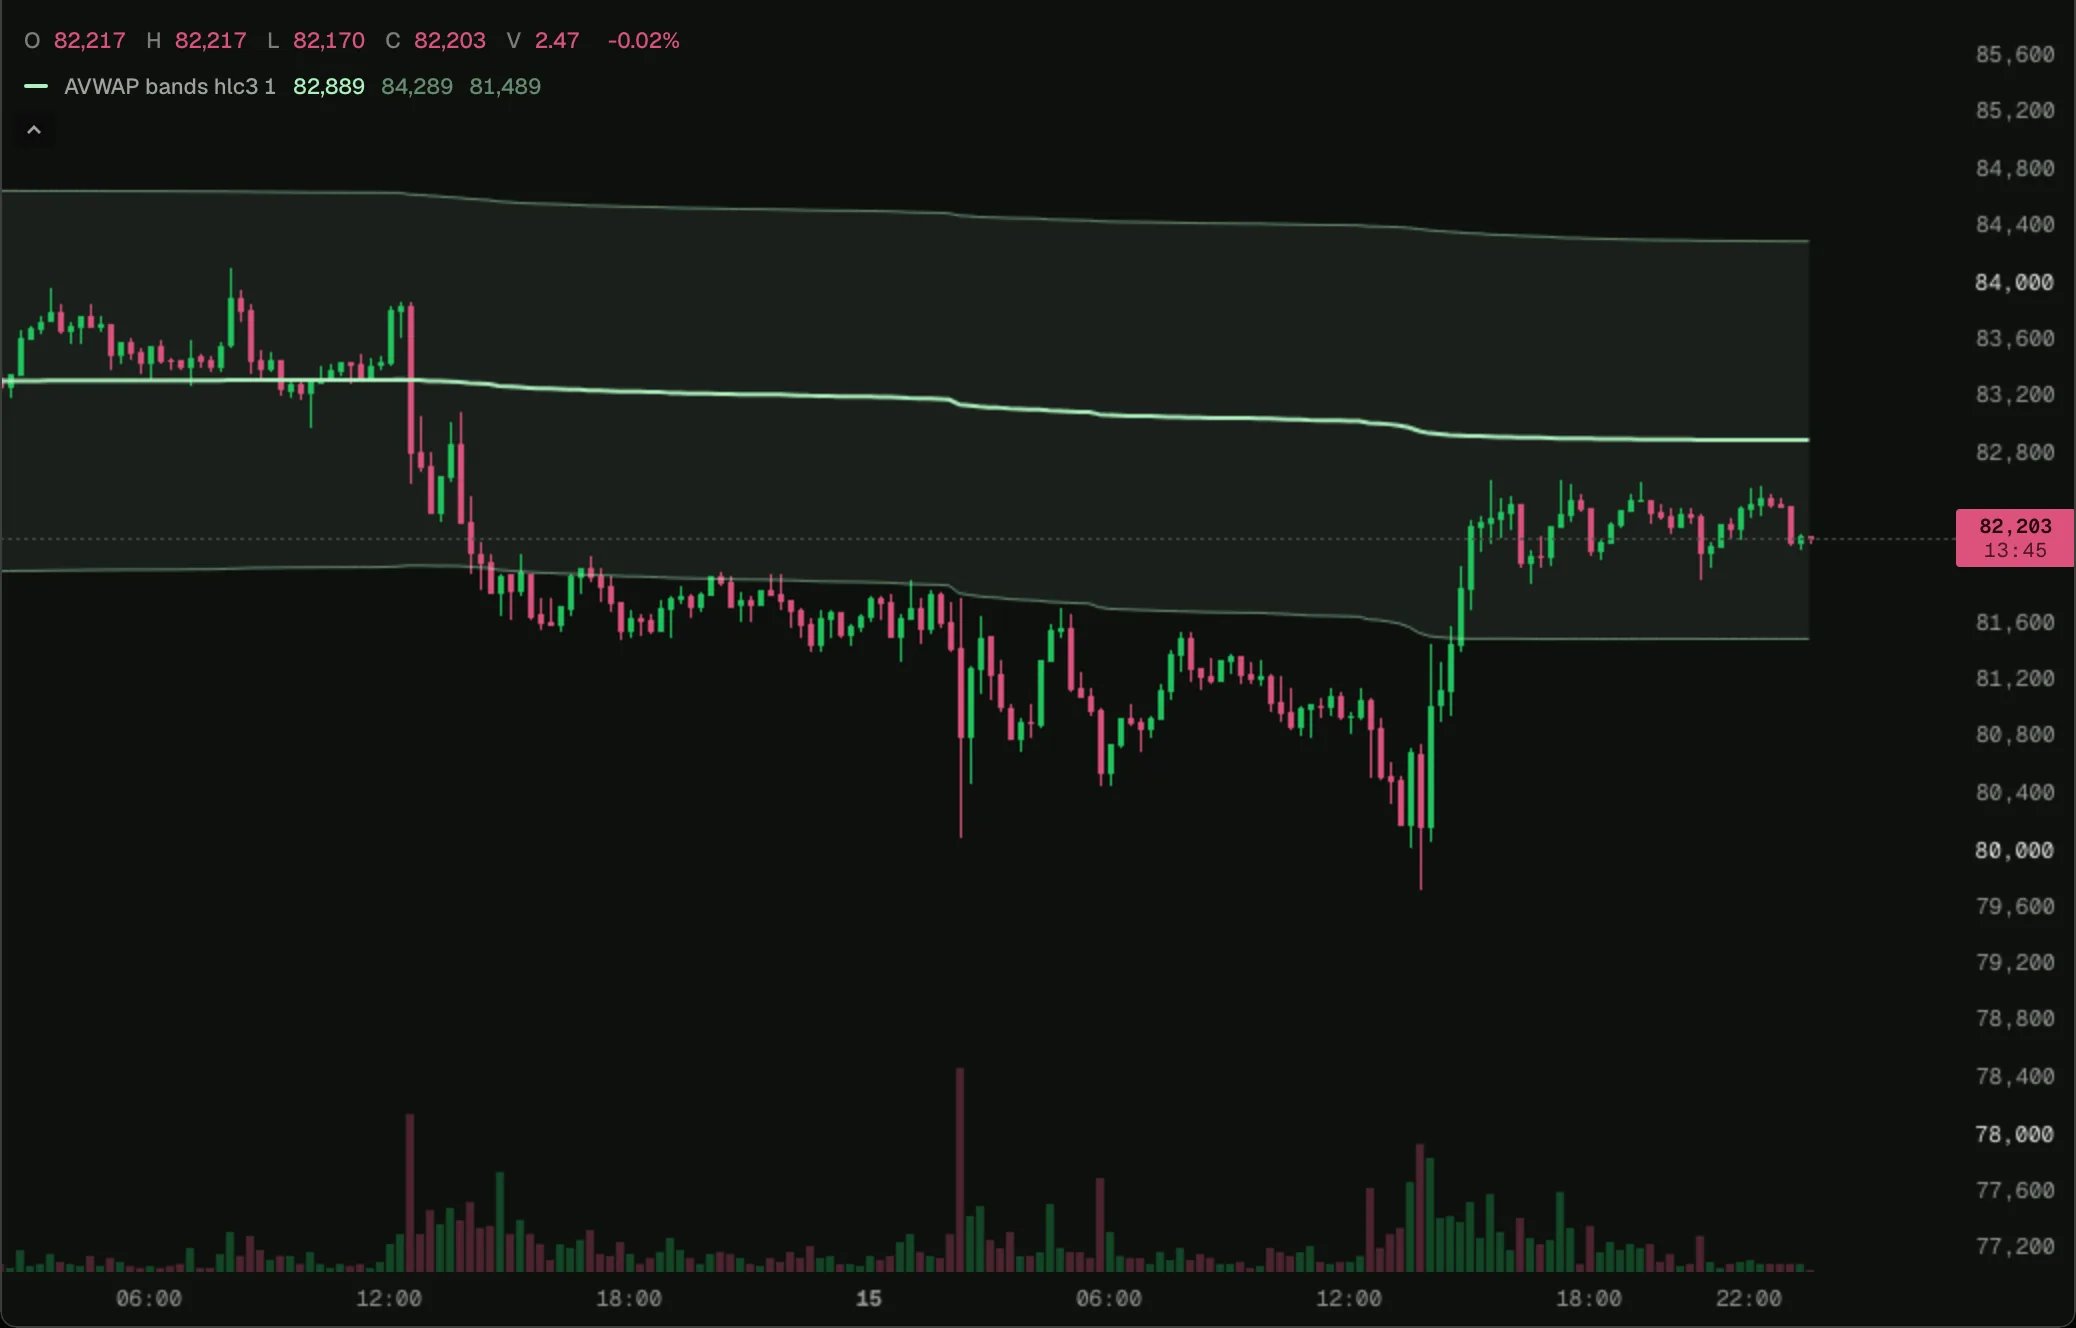
Anchored VWAP bands
VWAP and deviation bands from a moment picked on the chart.
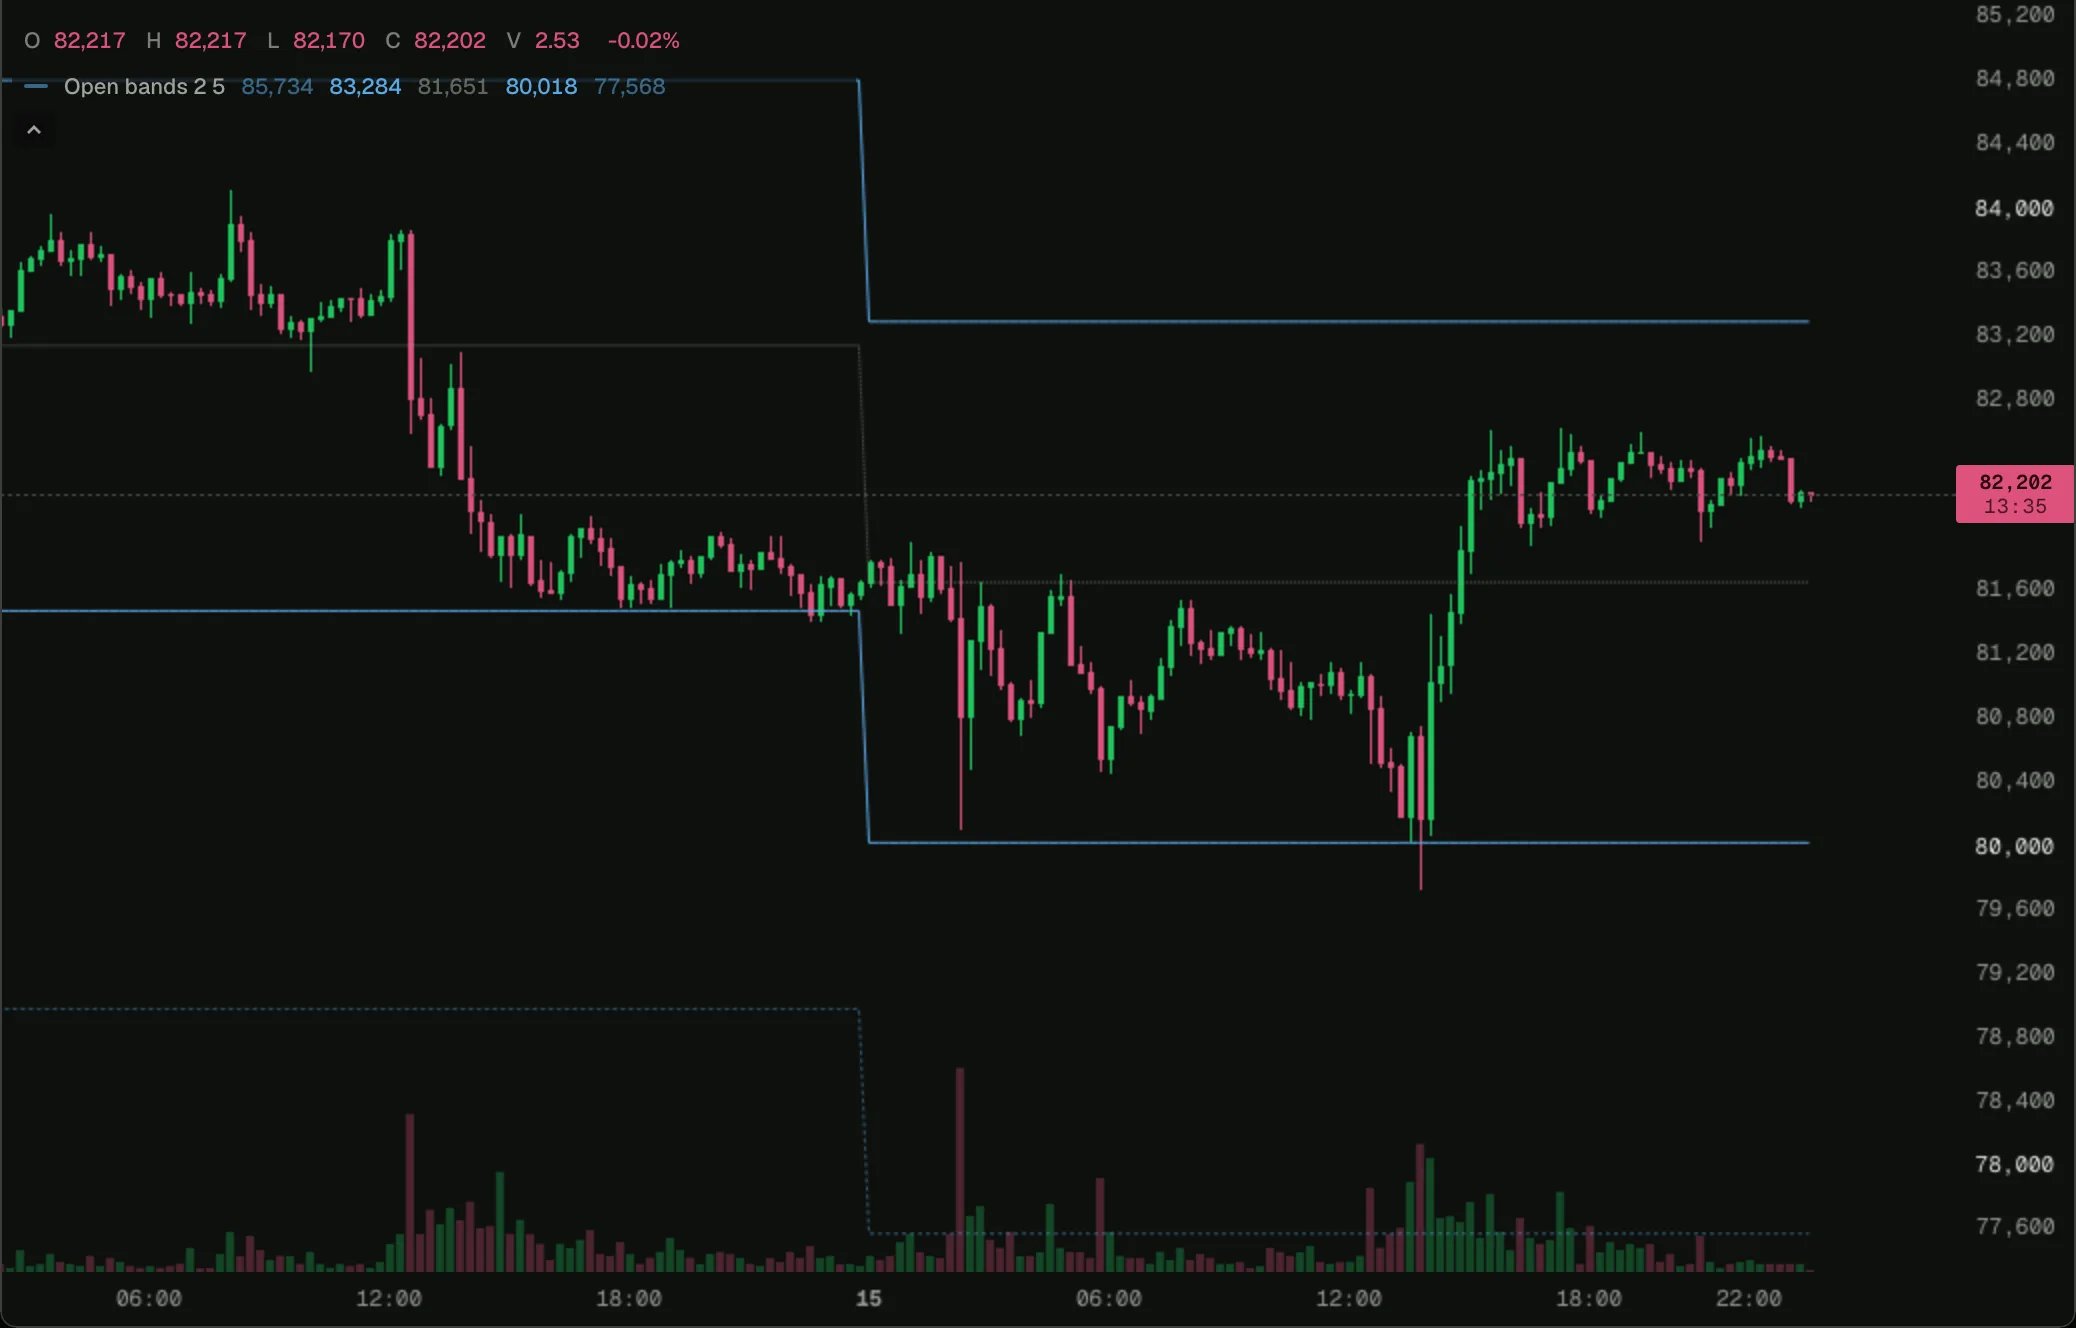
Open bands
Bands a set percentage above and below the day’s open, kept out of the price scale.
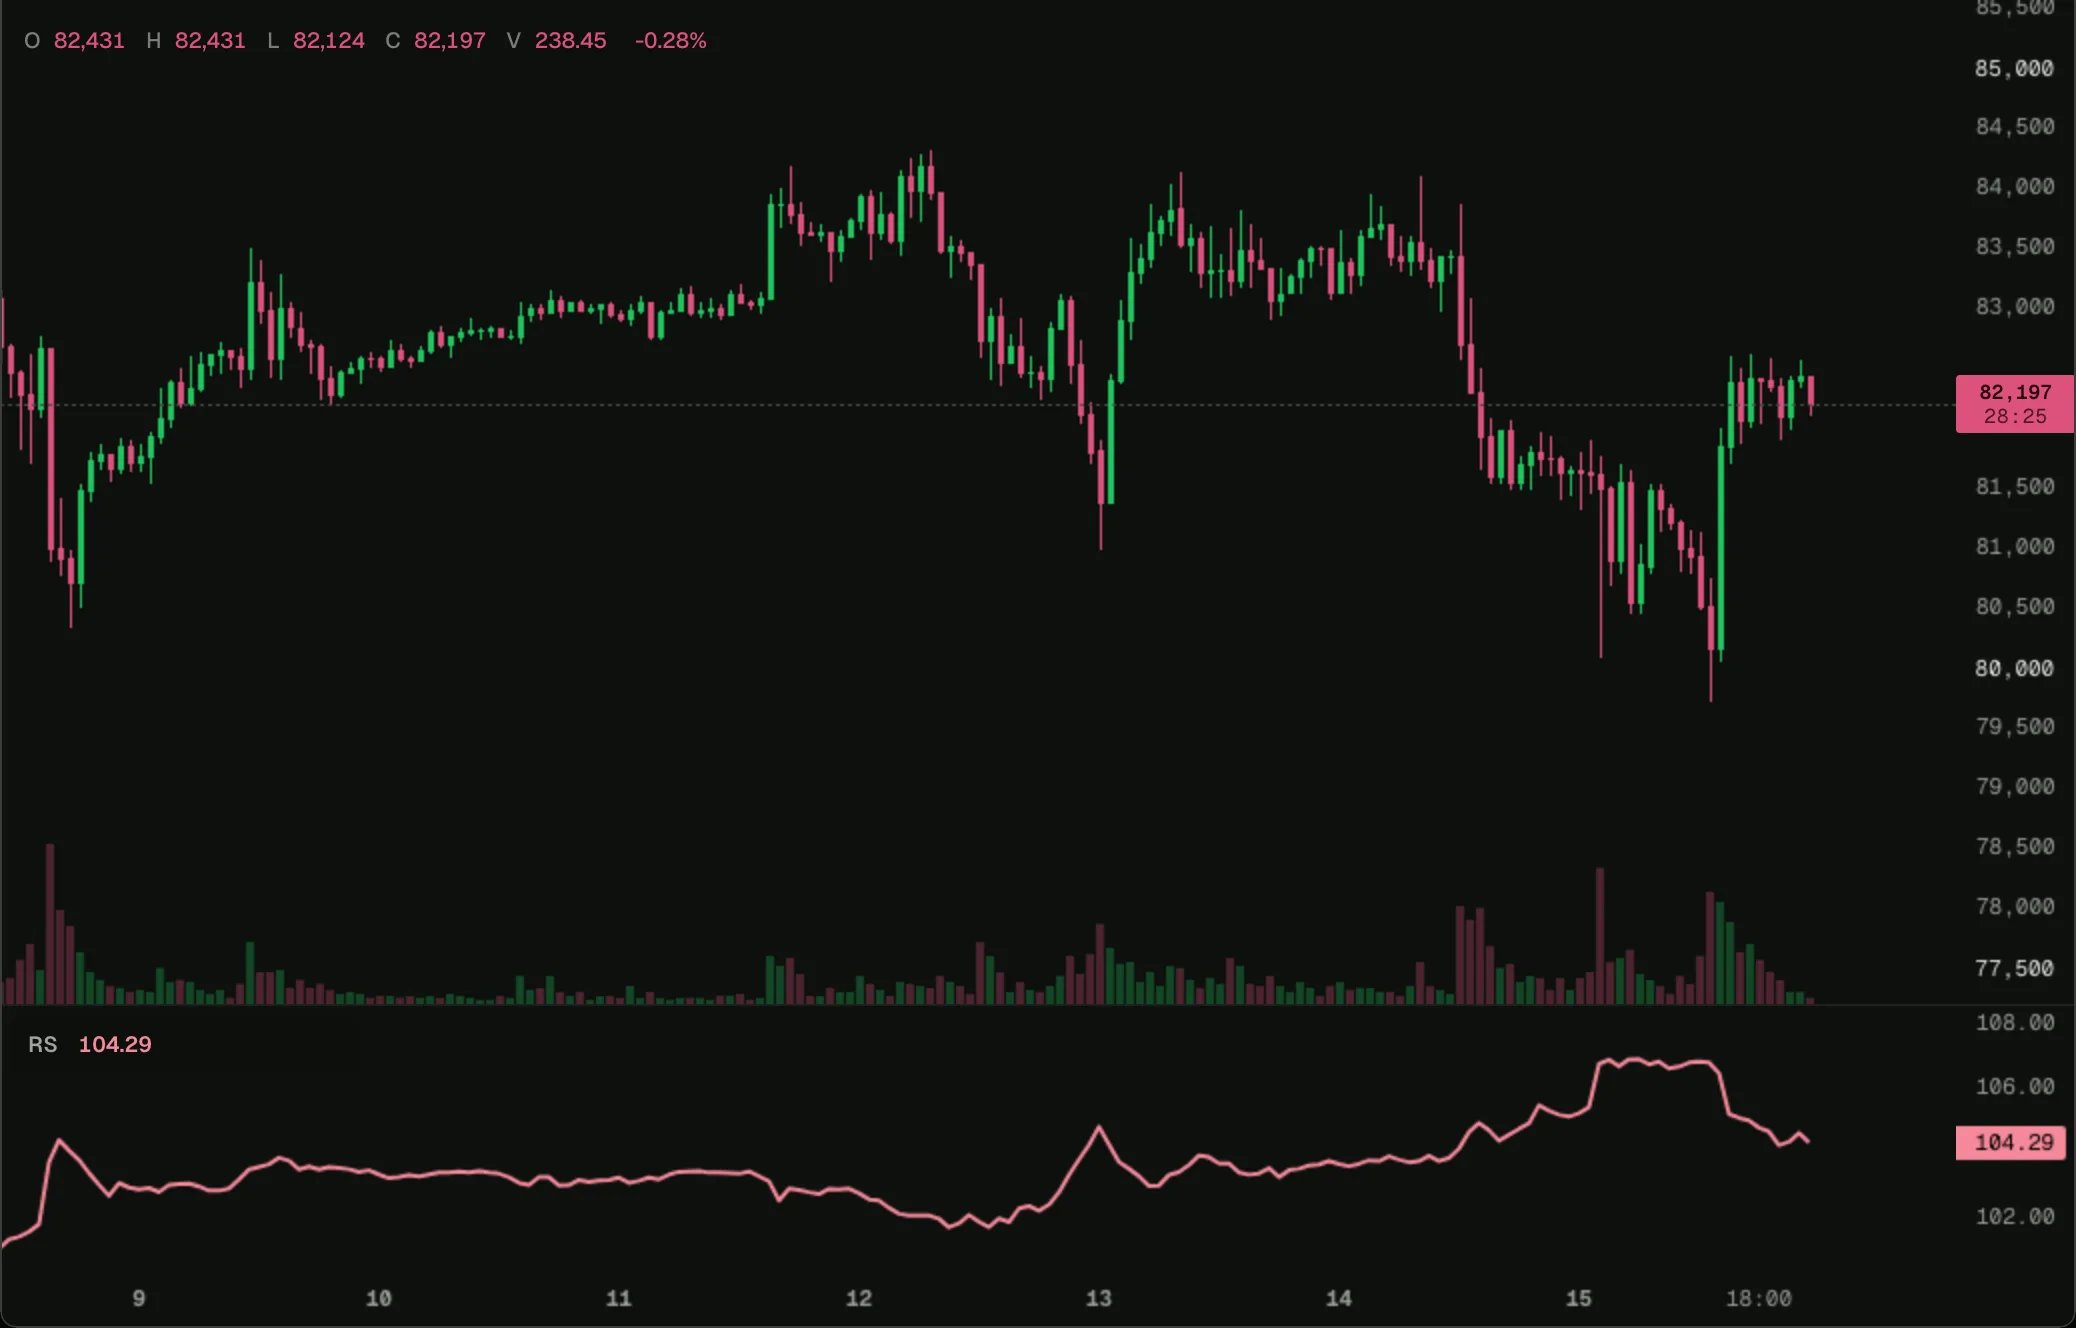
Relative strength
The chart’s market against another, both rebased to 100.
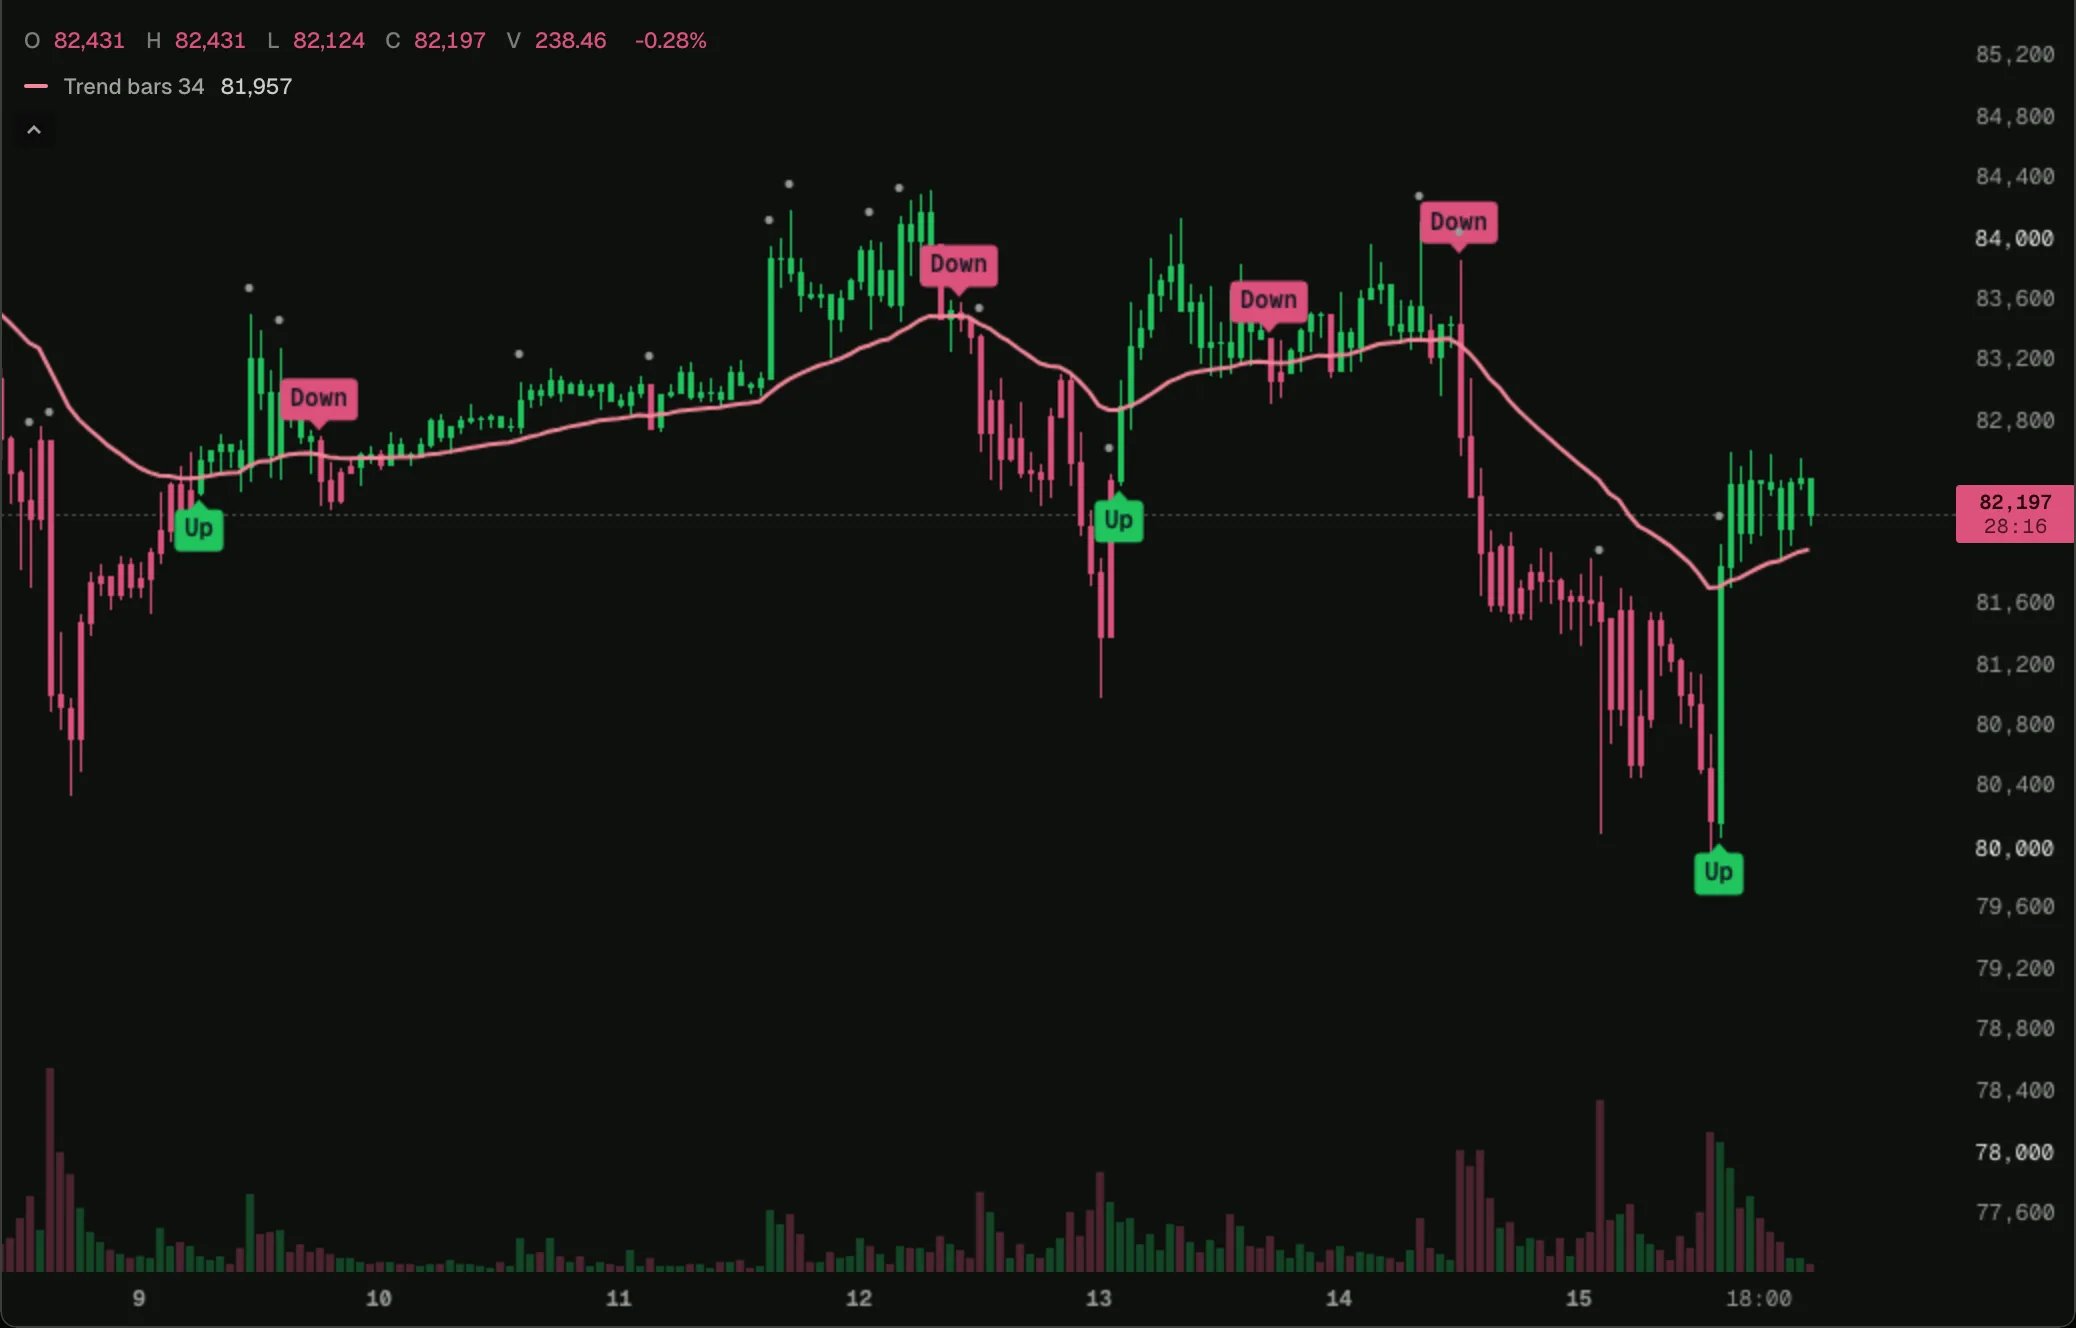
Trend bars
Candles coloured by trend, with a label where the close flips across the EMA.
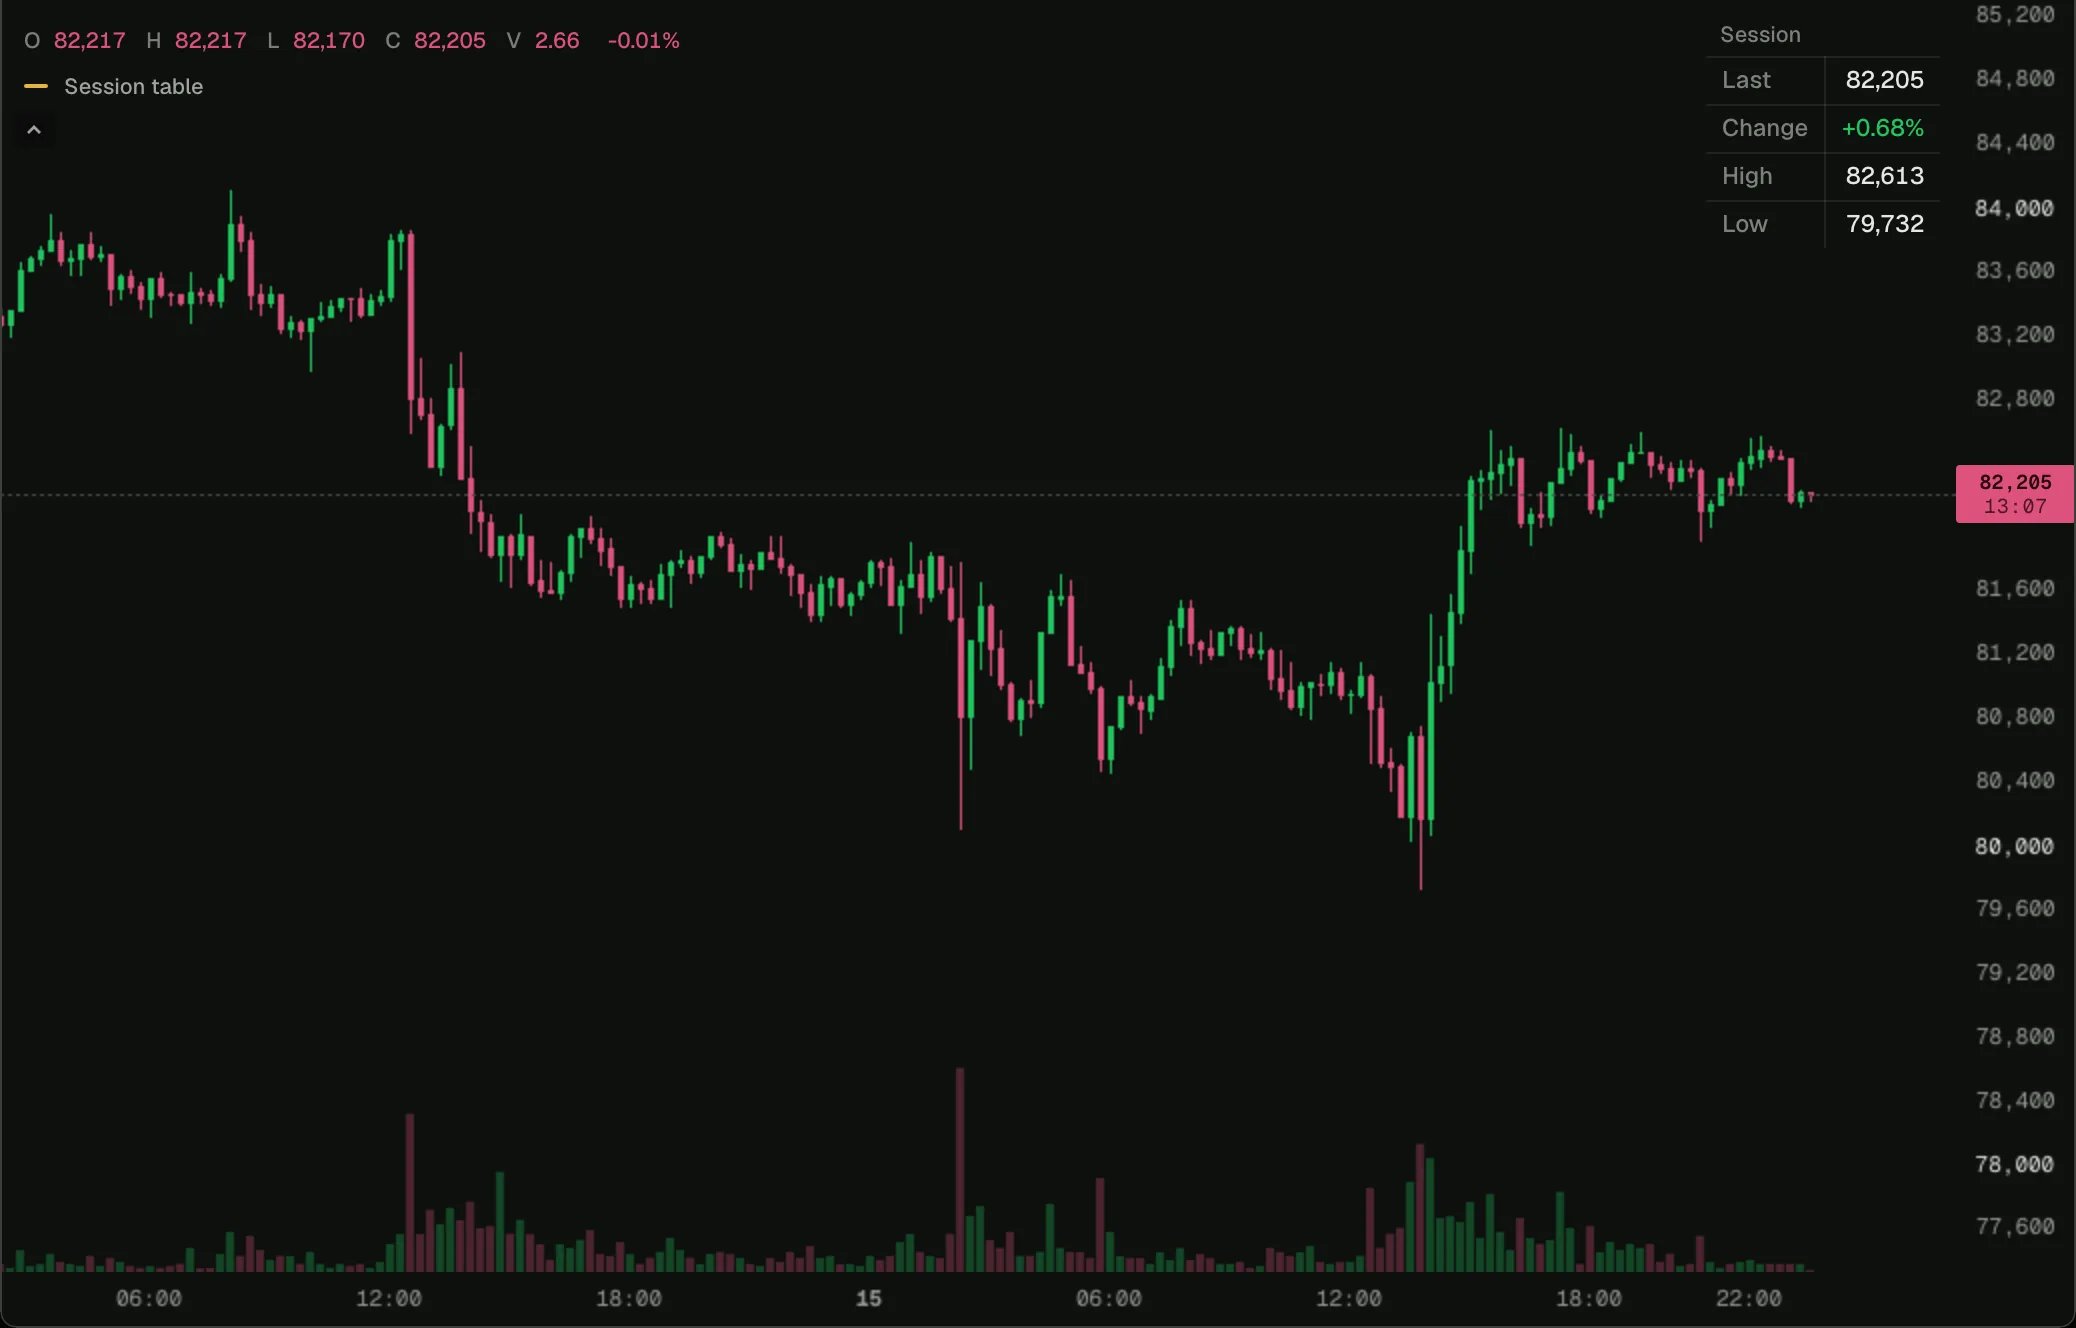
Session table
The last price, change, high and low since 00:00 UTC, in a table in a corner of the chart.
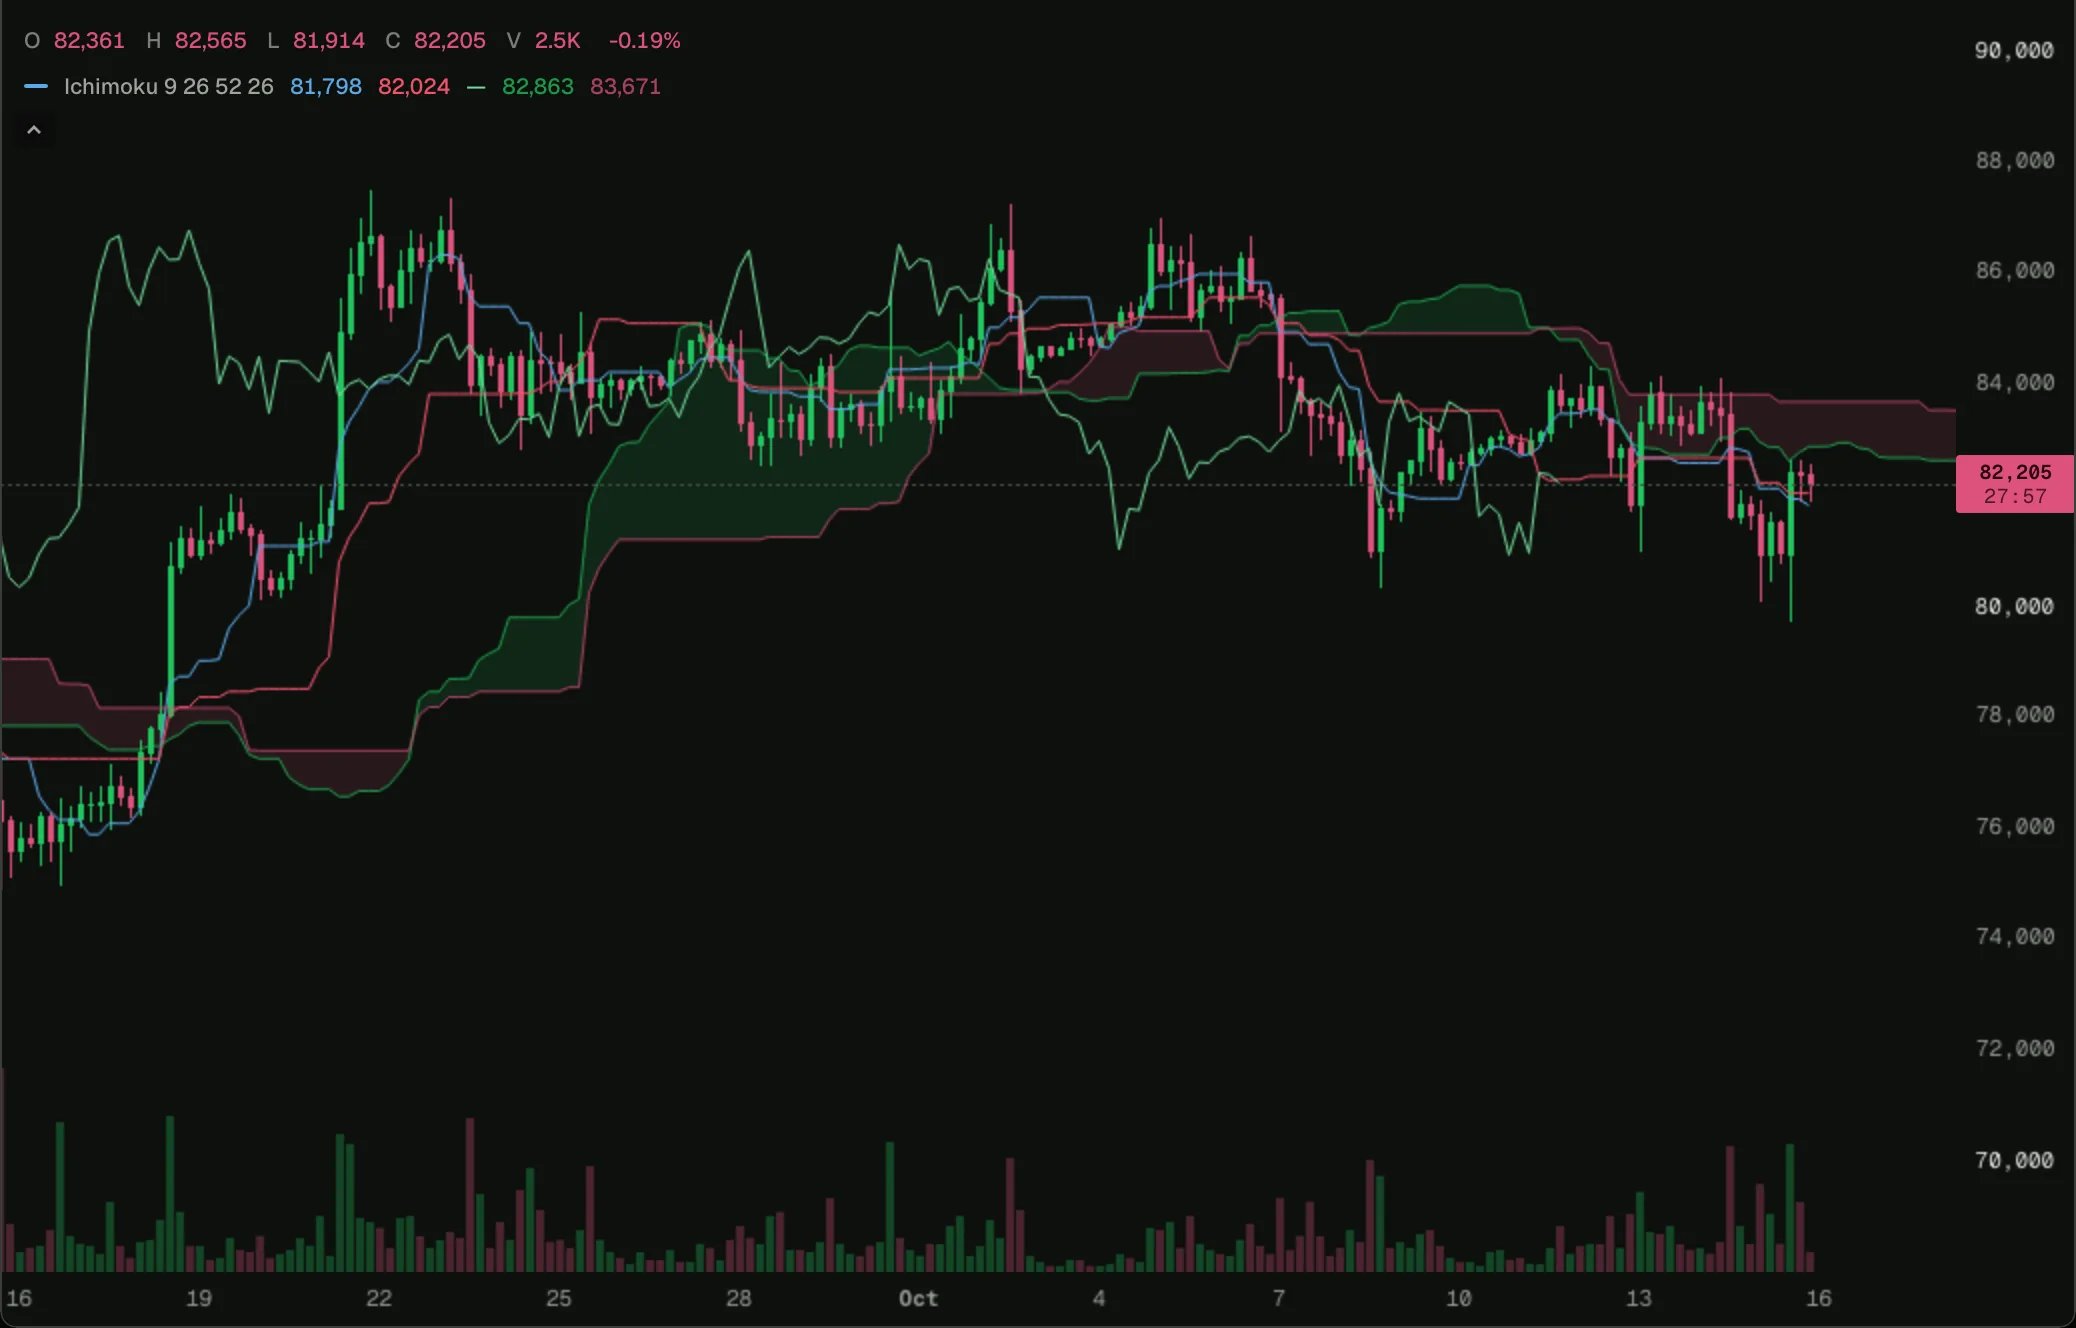
Ichimoku
Ichimoku Kinko Hyo, with the leading spans and cloud drawn ahead of the newest bar.
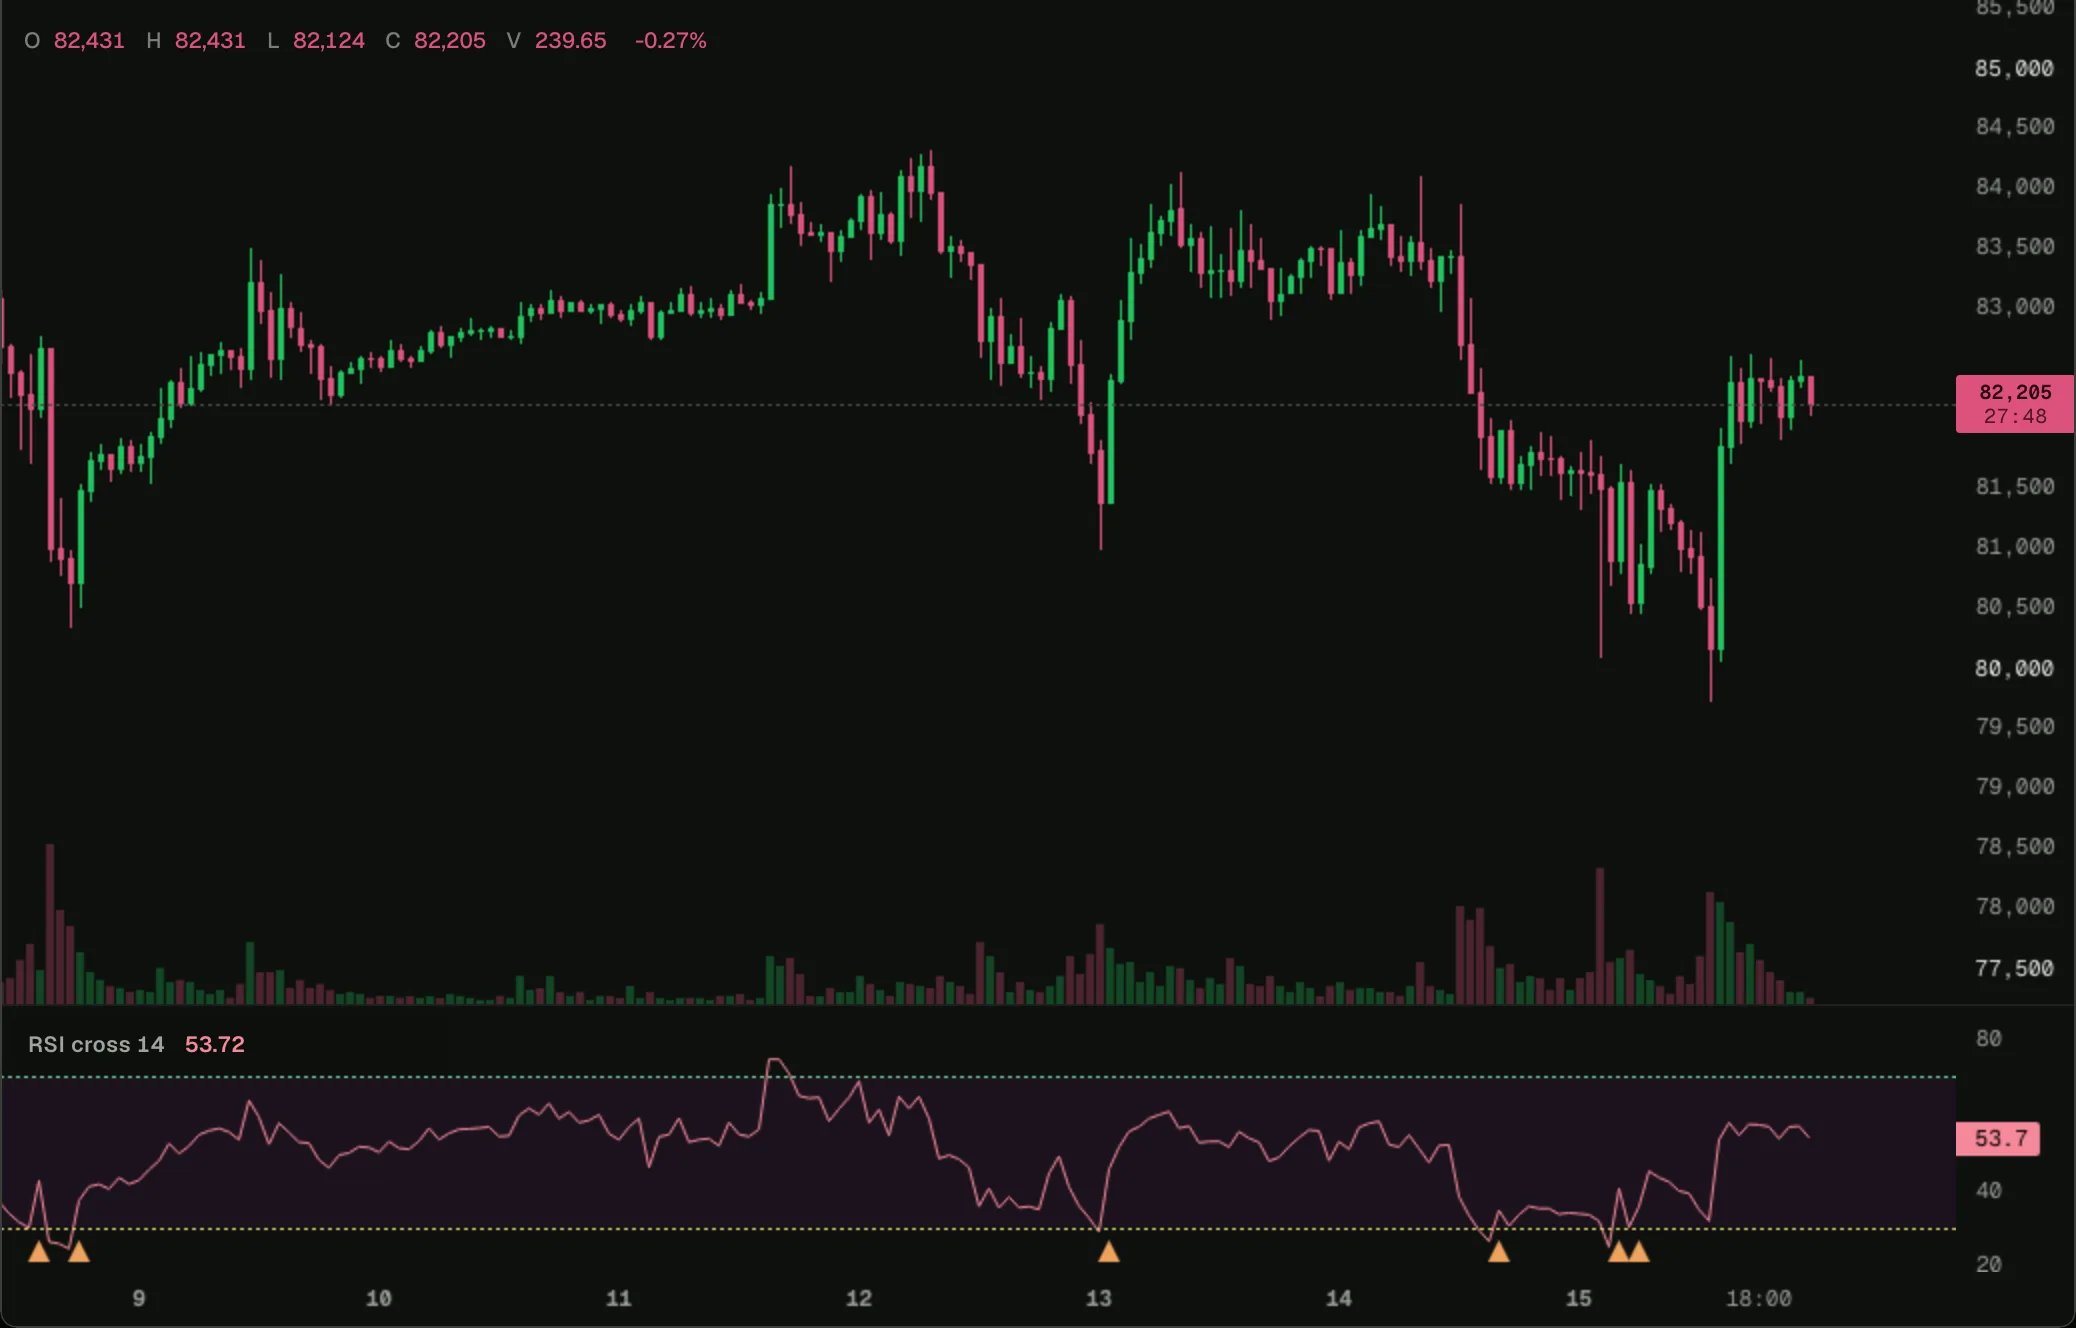
RSI cross
An RSI with a mark where it crosses up through 30, written the way the Pine translation writes it.
Pasted Pine
Pine Script from TradingView, translated when it loads.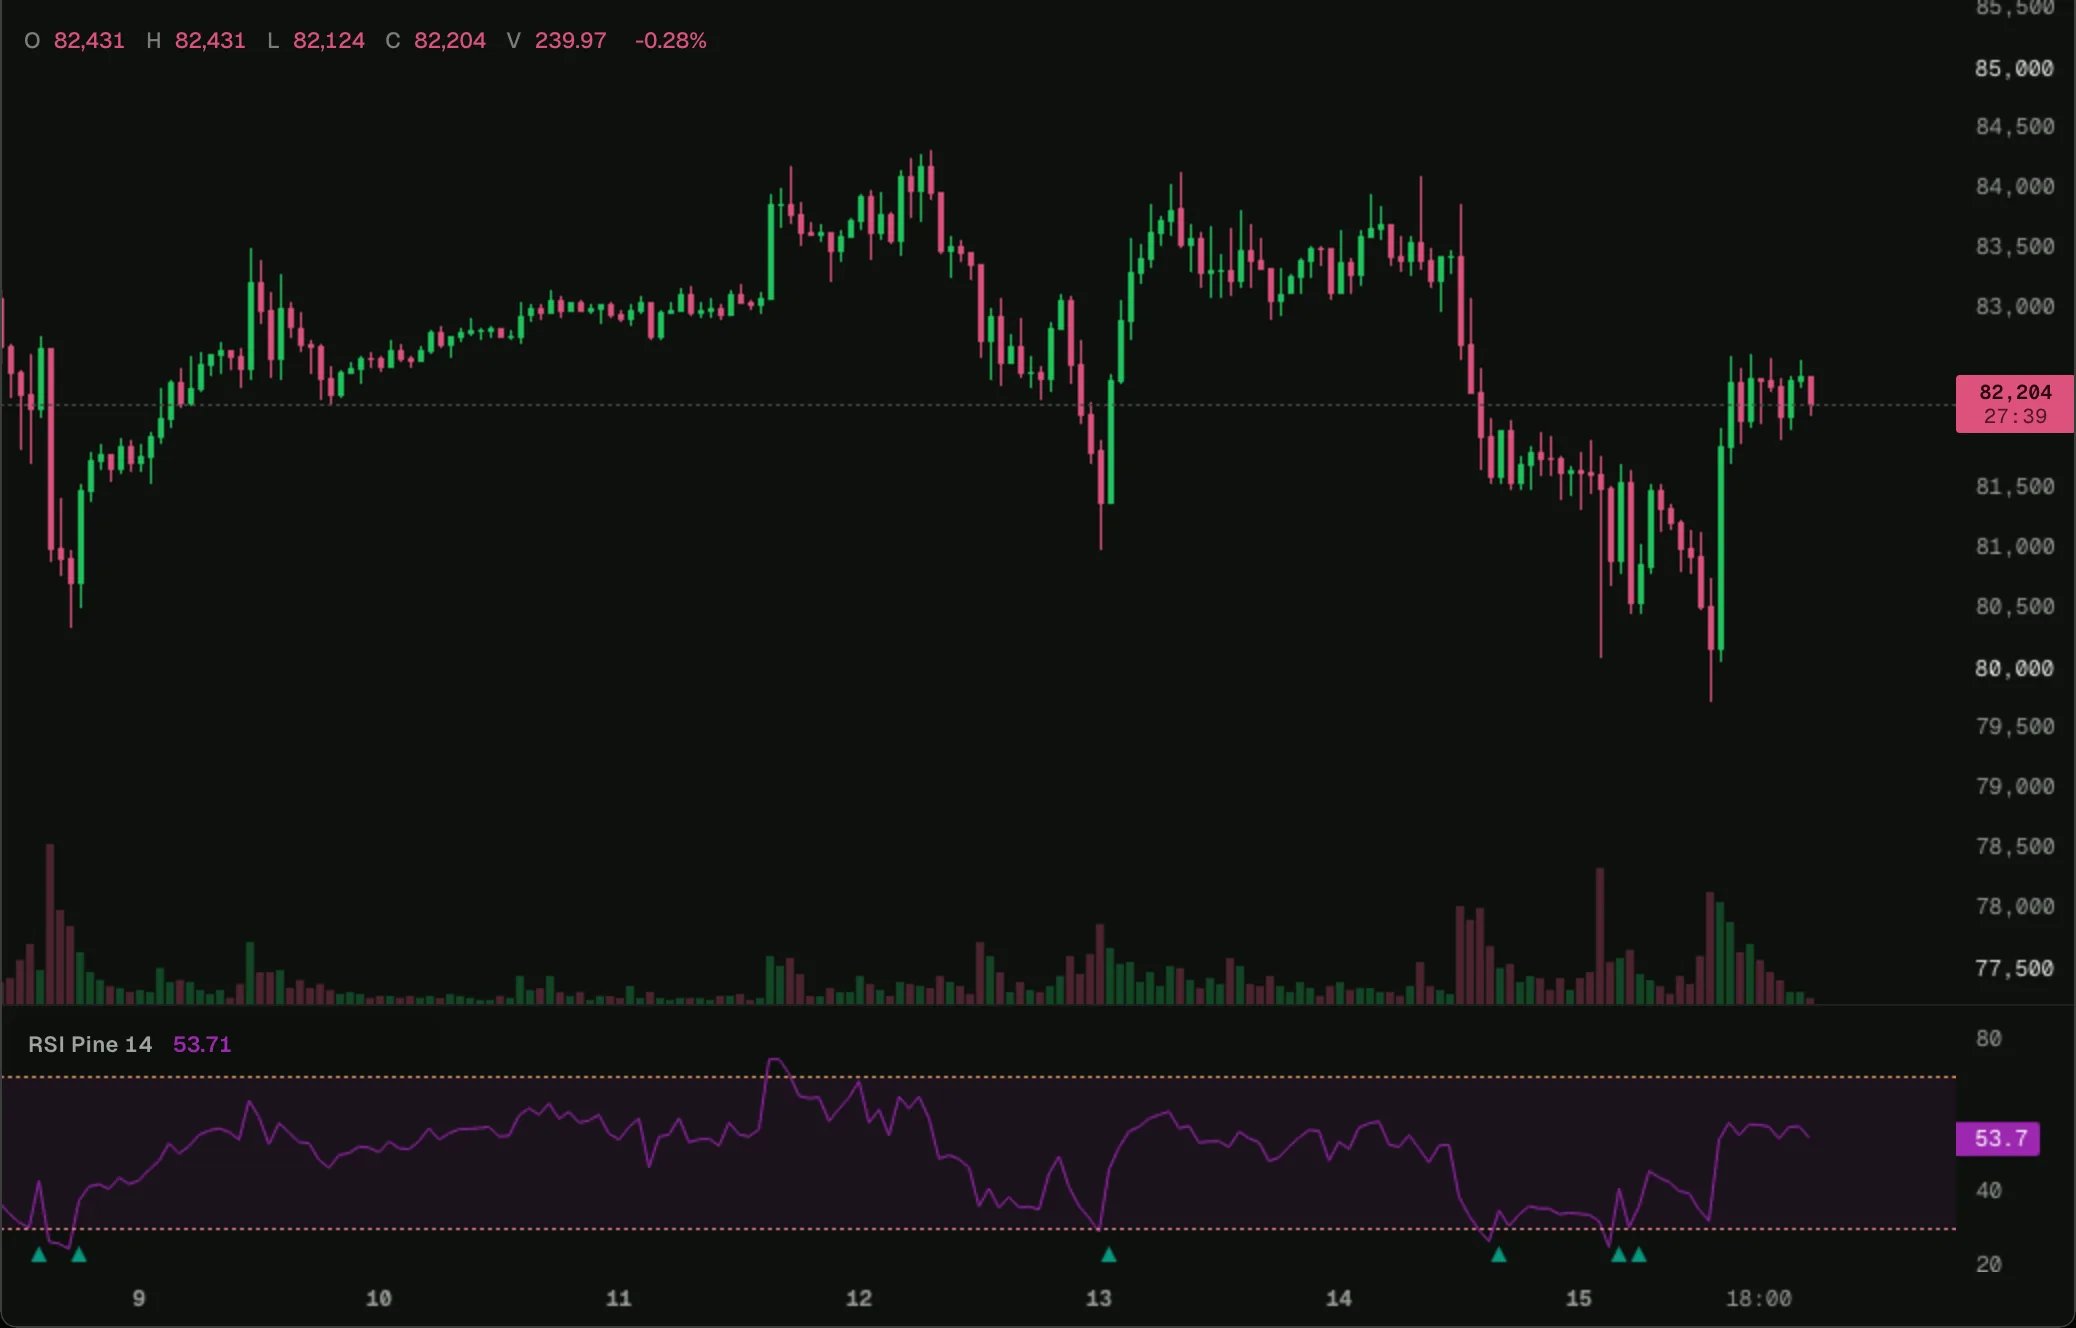
RSI cross, pasted Pine
The RSI cross as Pine Script, translated when it loads.
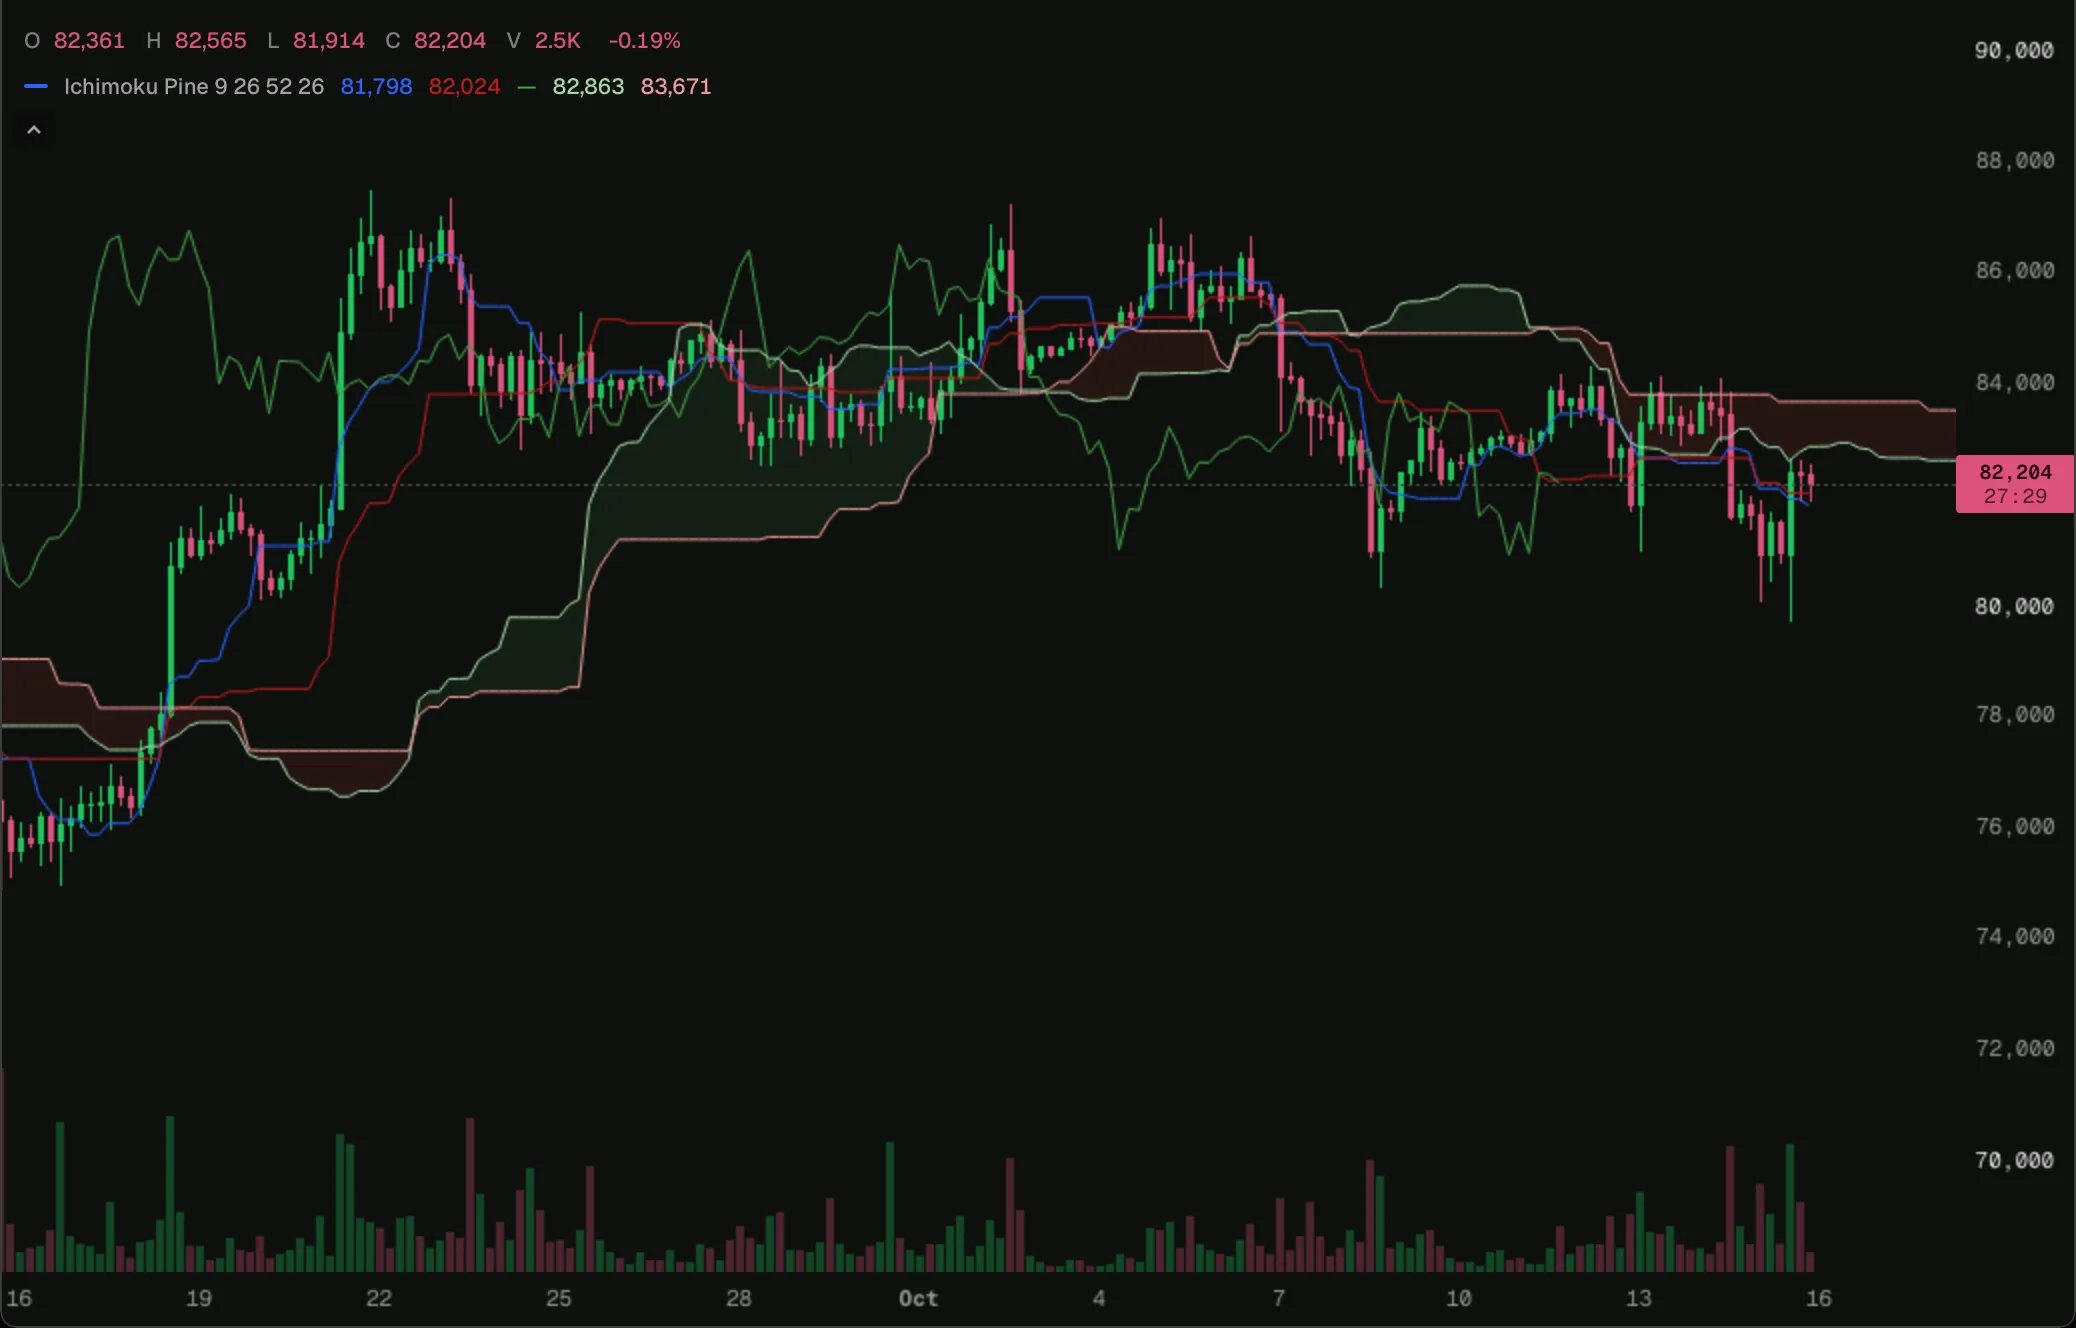
Ichimoku, pasted Pine
Ichimoku as Pine Script v6, in TradingView’s colours.
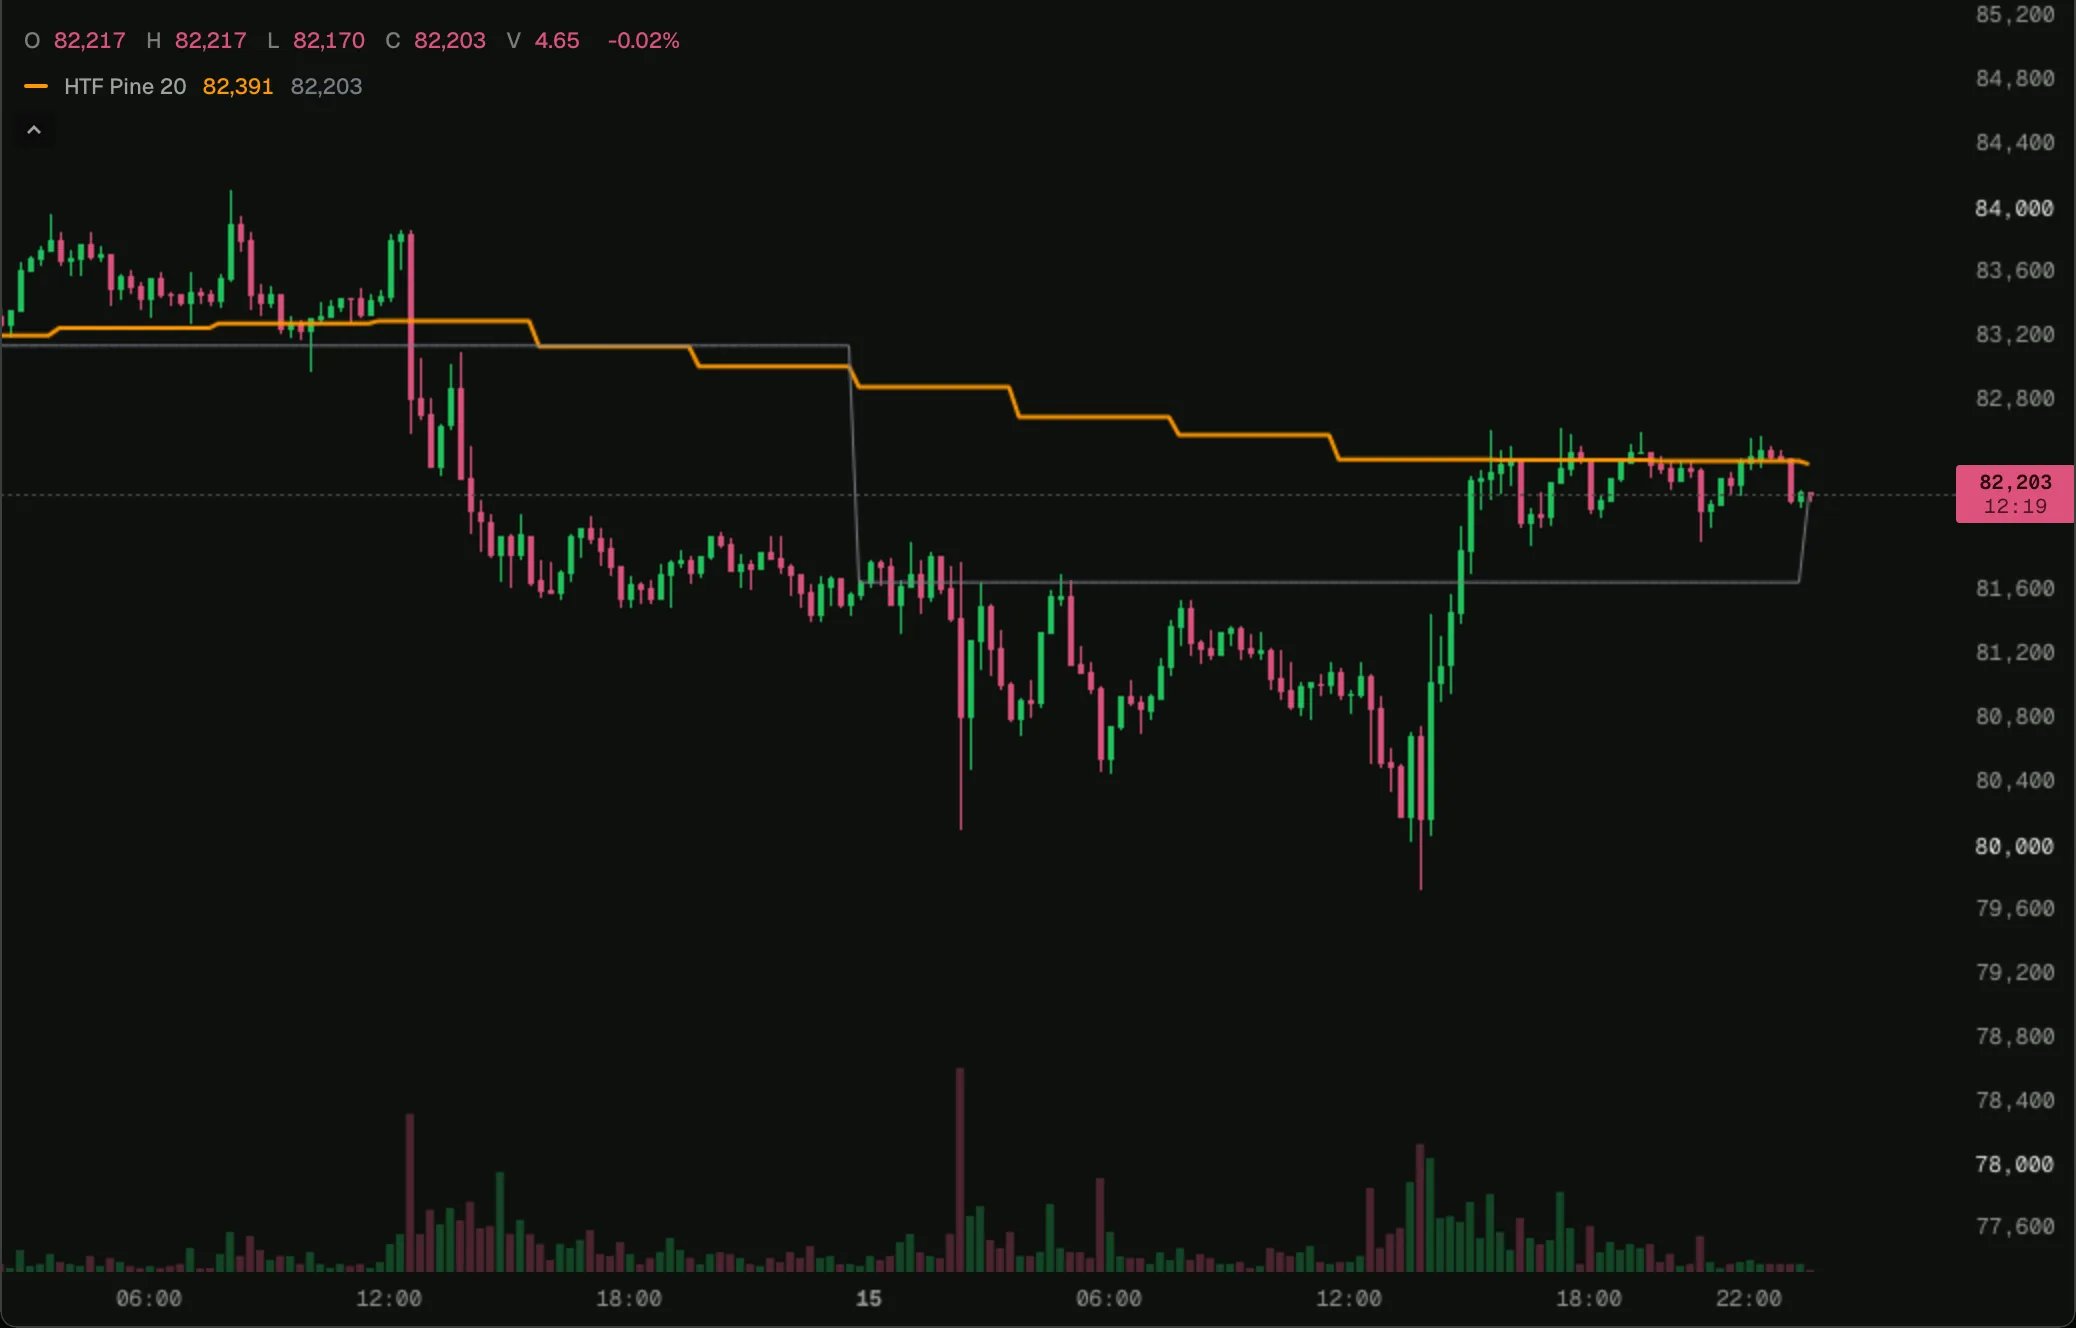
4h EMA and daily close, pasted Pine
request.security on other timeframes, from pasted Pine.