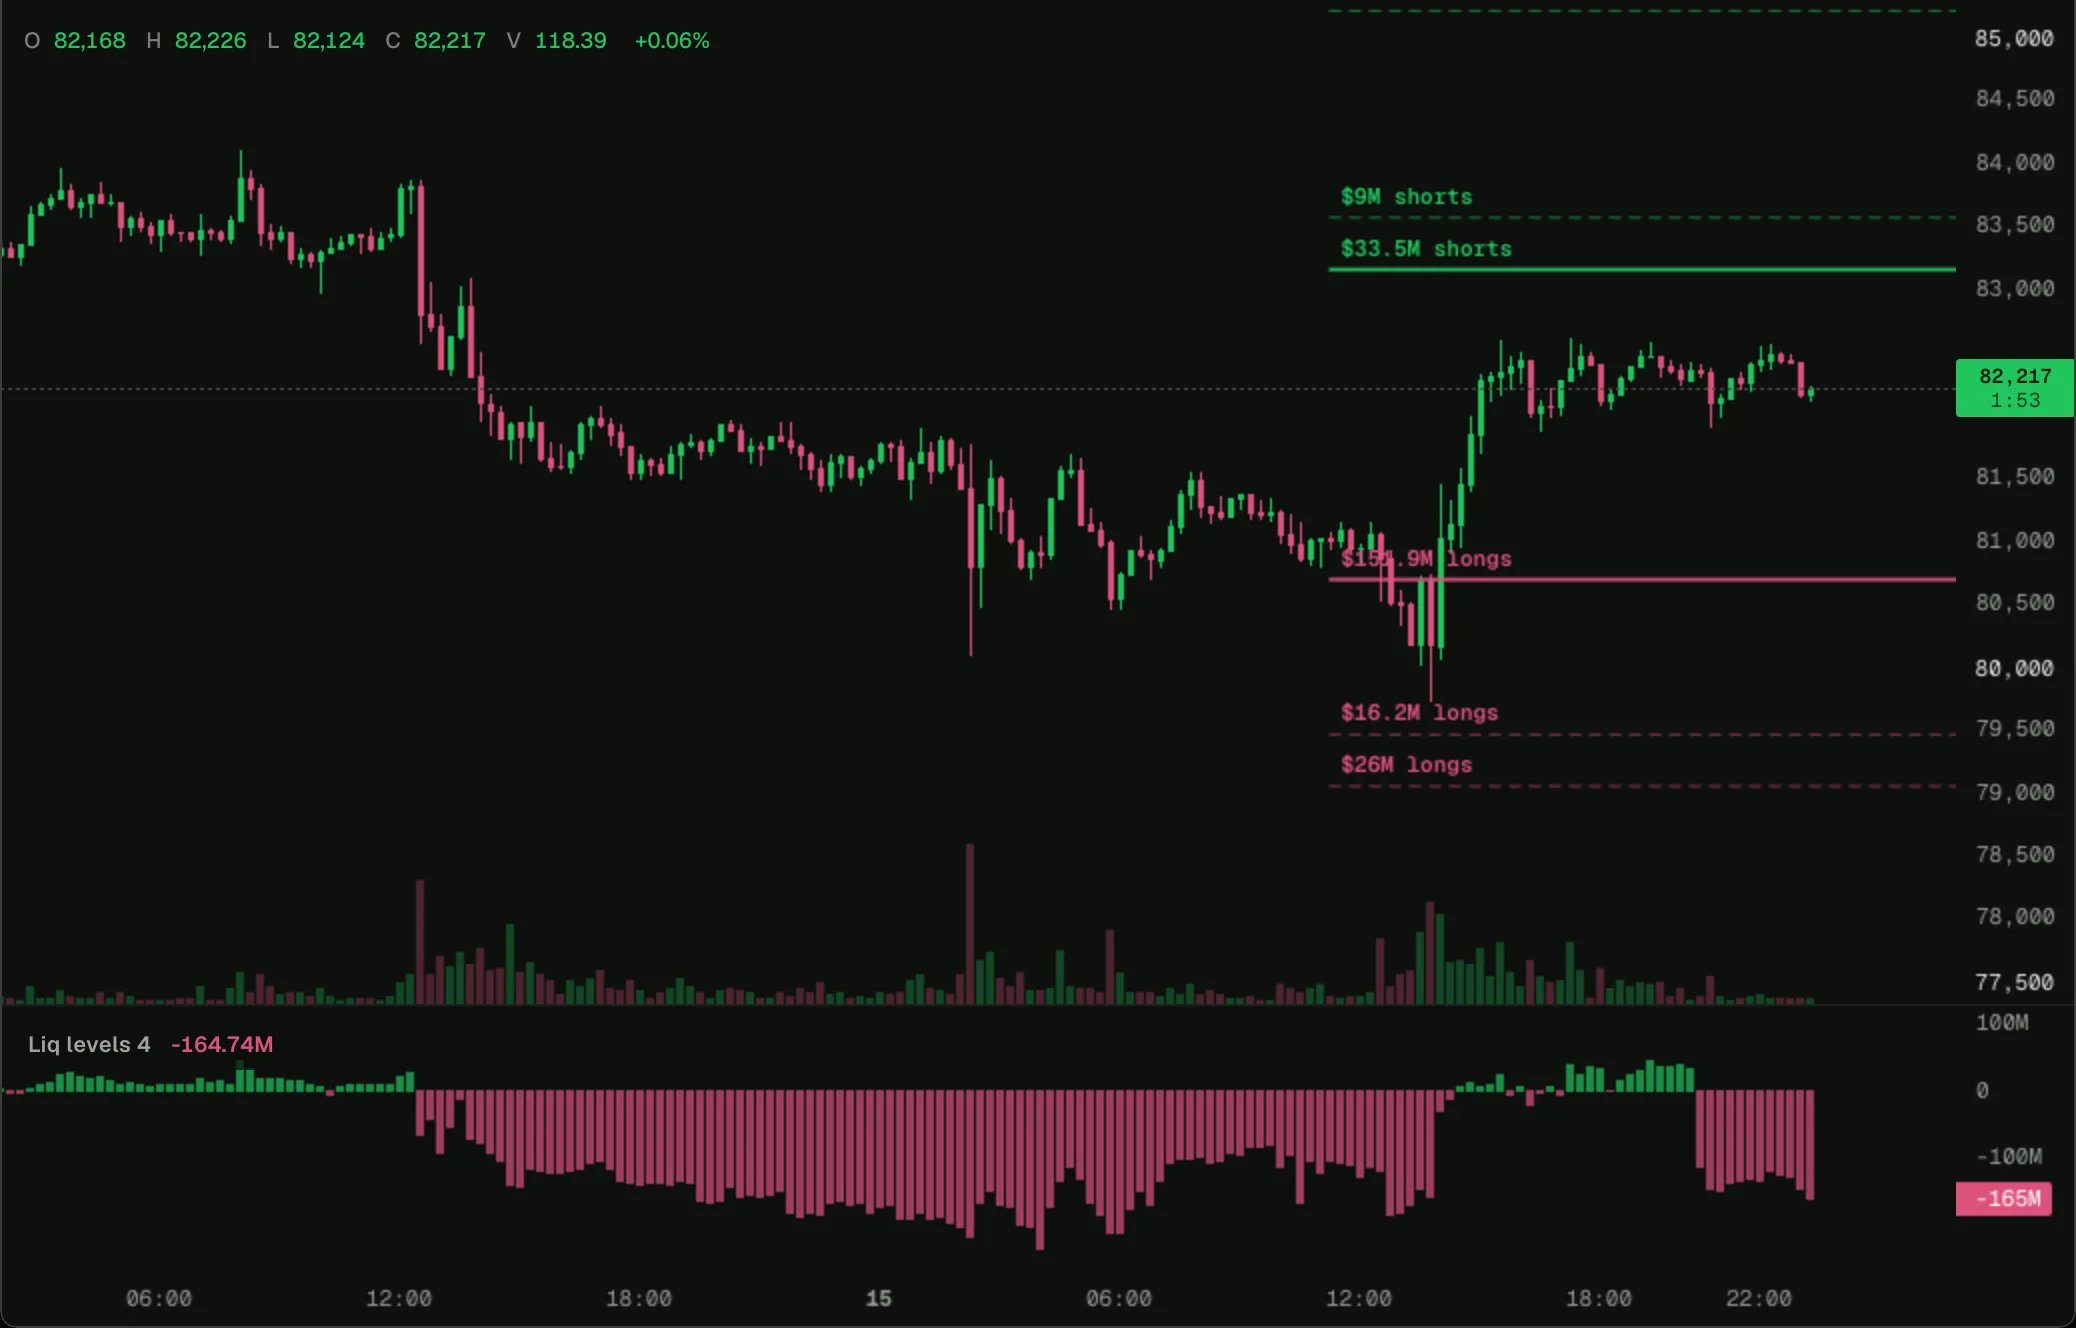
// Where the price would set off liquidations next, from 0xArchive's liquidation levels: the three
// biggest clusters of short positions above the price and of long positions below it, within
// `within` percent, as lines out to the right labelled with their size. Below the candles, the
// balance within the same distance on each bar: shorts above less longs below, from the snapshot
// as of that bar.
indicator('Liquidation levels ahead', { overlay: true, shortName: 'Liq levels', maxLines: 6, maxLabels: 6 });

const within = input.float('Within (%)', 4, { min: 0.5, max: 10, step: 0.5 });

const chart = bars();
const map = liquidationLevels();
const balance = plot.histogram('Shorts above less longs below $', { pane: 'balance' });

const SHOWN = 3;
// How far back the lines start, in bars; their labels sit there, clear of the price axis.
const BACK = 48;

chart.onBar(() => {
  if (!map.available) return;
  const price = chart.close;
  const near = map.levels().filter((level) => Math.abs(level.price / price - 1) * 100 <= within);
  let shortsAbove = 0;
  let longsBelow = 0;
  for (const level of near) {
    if (level.price > price) shortsAbove += level.shortUsd;
    else longsBelow += level.longUsd;
  }
  balance.set(shortsAbove - longsBelow, color.withAlpha(shortsAbove >= longsBelow ? color.up : color.down, 0.7));
  if (!chart.isLast) return;
  // Biggest first: shorts above the price, longs below.
  const above = near.filter((level) => level.price > price && level.shortUsd > 0).sort((a, b) => b.shortUsd - a.shortUsd).slice(0, SHOWN);
  const below = near.filter((level) => level.price < price && level.longUsd > 0).sort((a, b) => b.longUsd - a.longUsd).slice(0, SHOWN);
  above.forEach((level, rank) => mark(level.price, level.shortUsd, 'shorts', color.up, rank));
  below.forEach((level, rank) => mark(level.price, level.longUsd, 'longs', color.down, rank));
});

function mark(price: number, usd: number, side: string, ink: string, rank: number) {
  draw.line({ from: { bar: chart.index - BACK, price }, to: { bar: chart.index, price }, extend: 'right', color: color.withAlpha(ink, rank === 0 ? 0.9 : 0.6), width: rank === 0 ? 2 : 1, style: rank === 0 ? 'solid' : 'dashed' });
  // The label's lower-left corner on the line's start: it sits just above the line.
  draw.label({ at: { bar: chart.index - BACK, price }, text: `${fmt.usd(usd)} ${side}`, style: 'lowerLeft', color: color.none, textColor: ink, size: 'small' });
}