

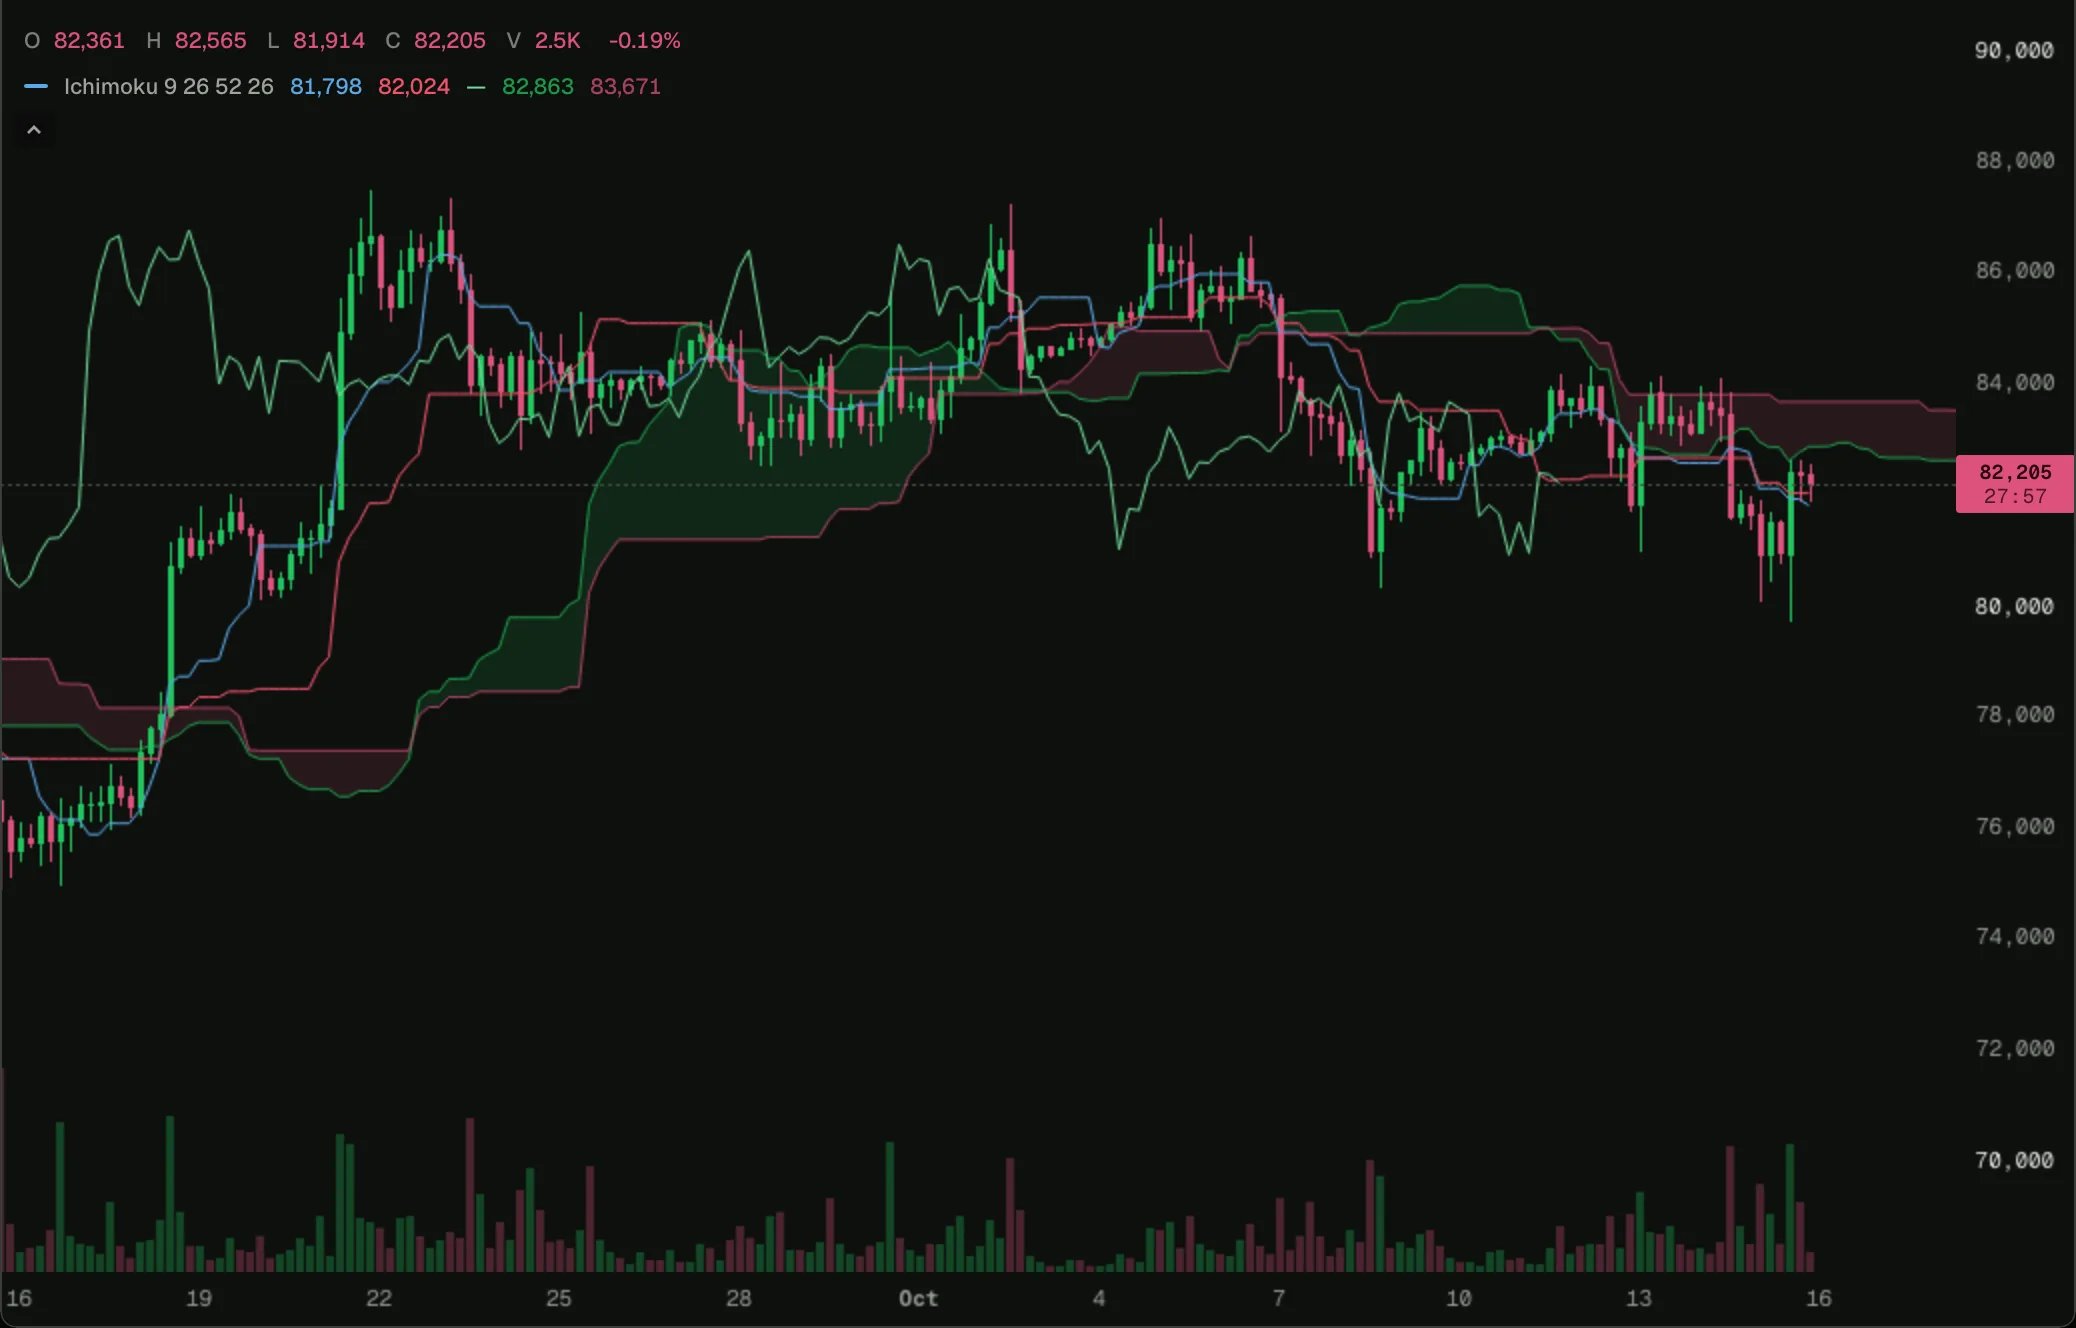
BTC on 4-hour bars in the 0xArchive Terminal, 2026-10-15.
Open on a chart
Load it on BTC 4h in the terminal, then change its settings or open it in the script editor.
How it works
offset shifts a plot by whole bars: positive draws to the right, past the newest bar; negative to the left. plot.fill shades between the two leading spans, coloured per bar.
The script
ichimoku.ts