

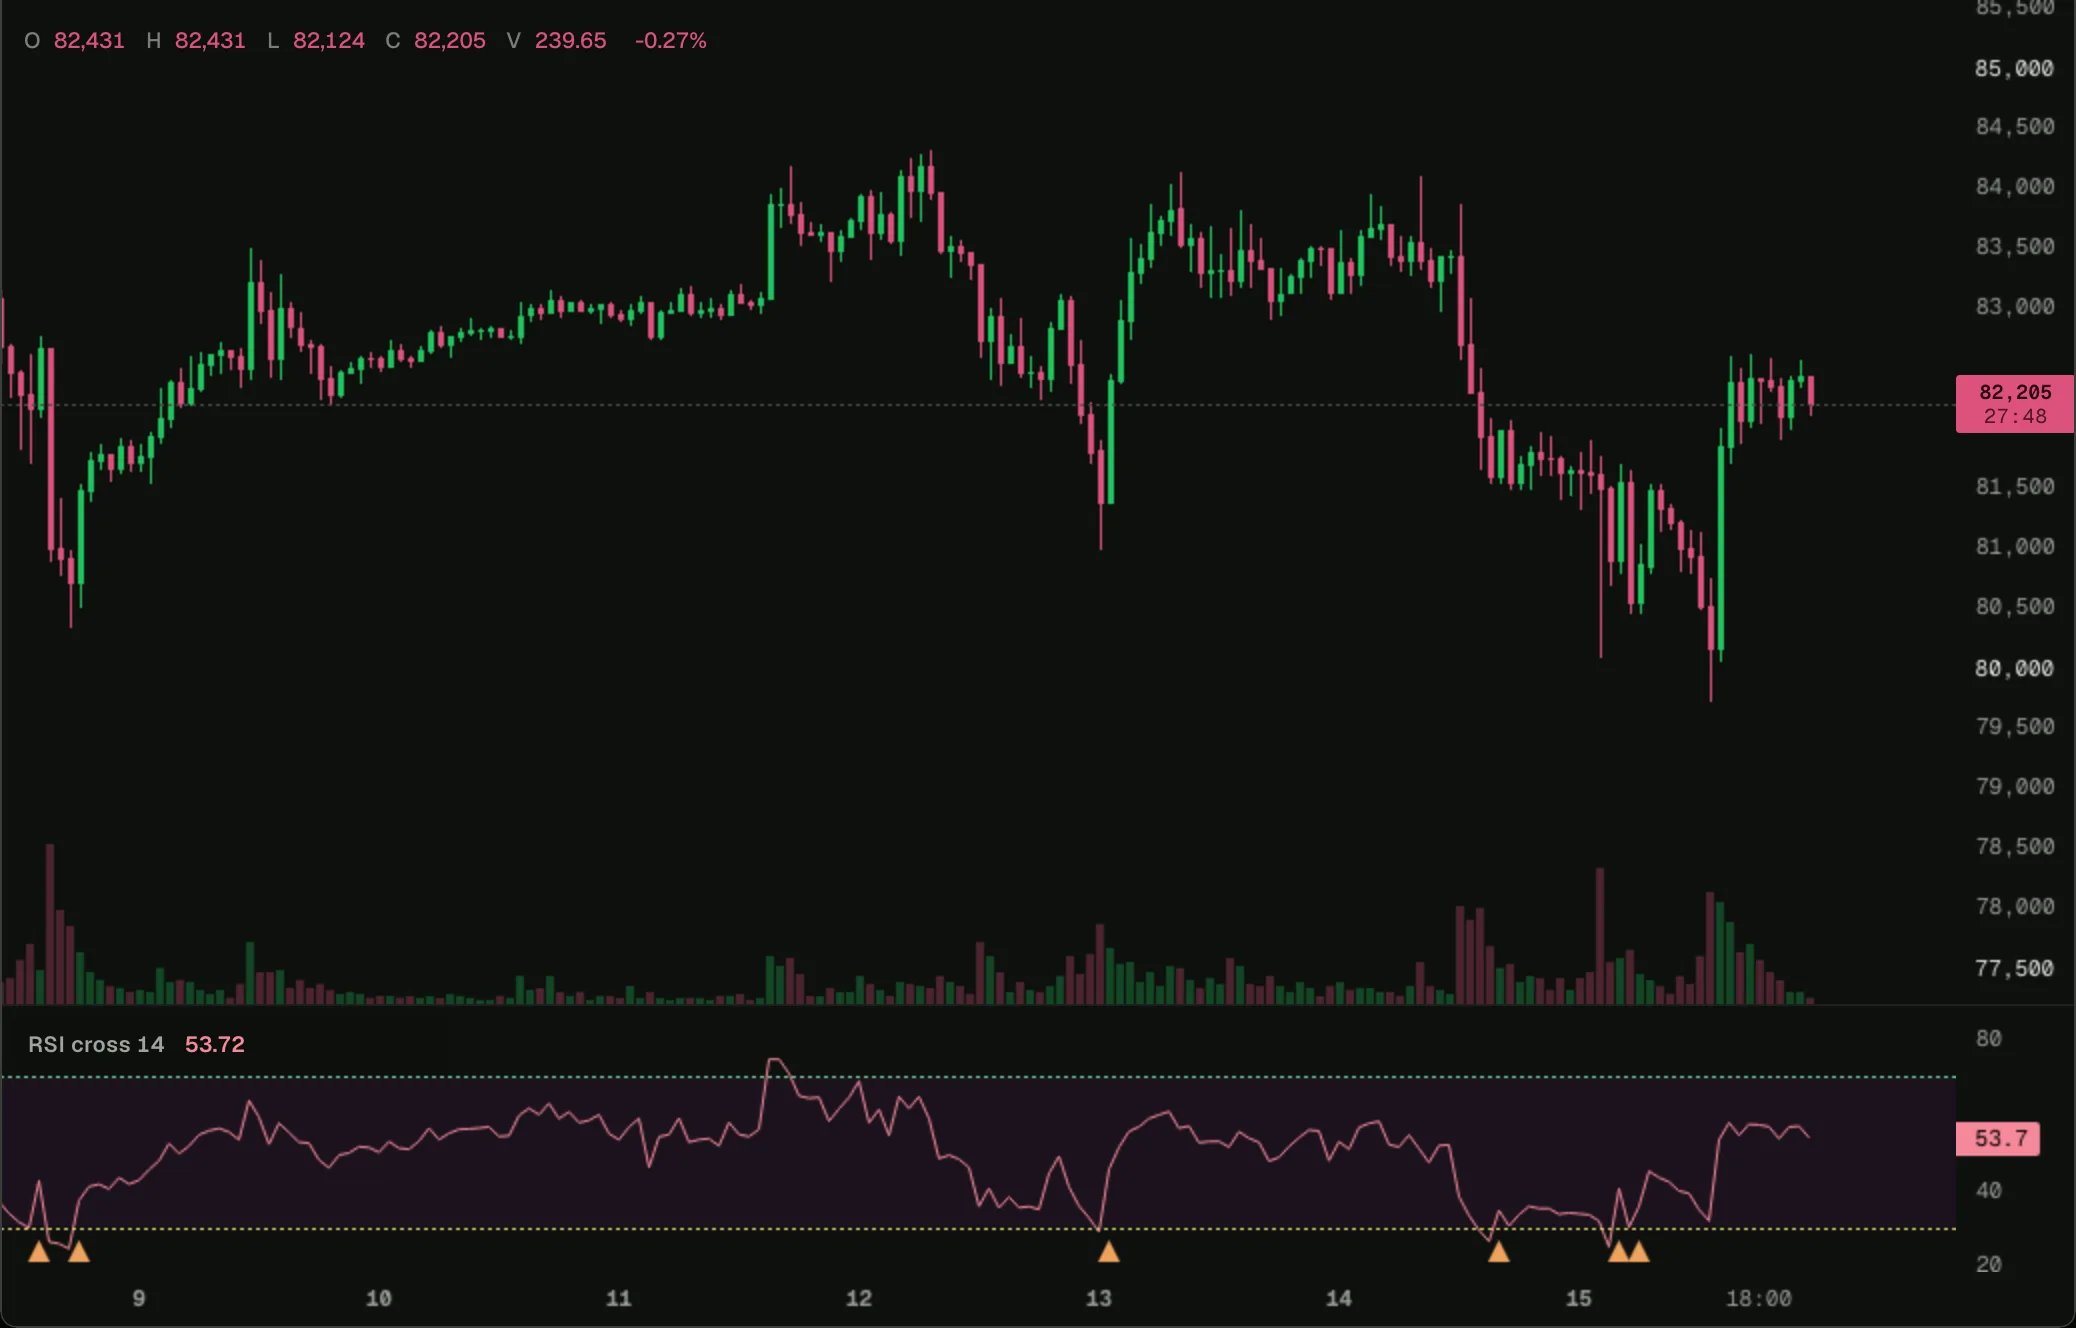
BTC on 1-hour bars in the 0xArchive Terminal, 2026-10-15.
Open on a chart
Load it on BTC 1h in the terminal, then change its settings or open it in the script editor.
How it works
This is what the Pine translation makes of a small Pine script, shown at the top of the source. Each Pine call to a stateful function, such asta.crossover, becomes an instance of its own, because each call keeps its own history.
The script
rsi-cross.ts