

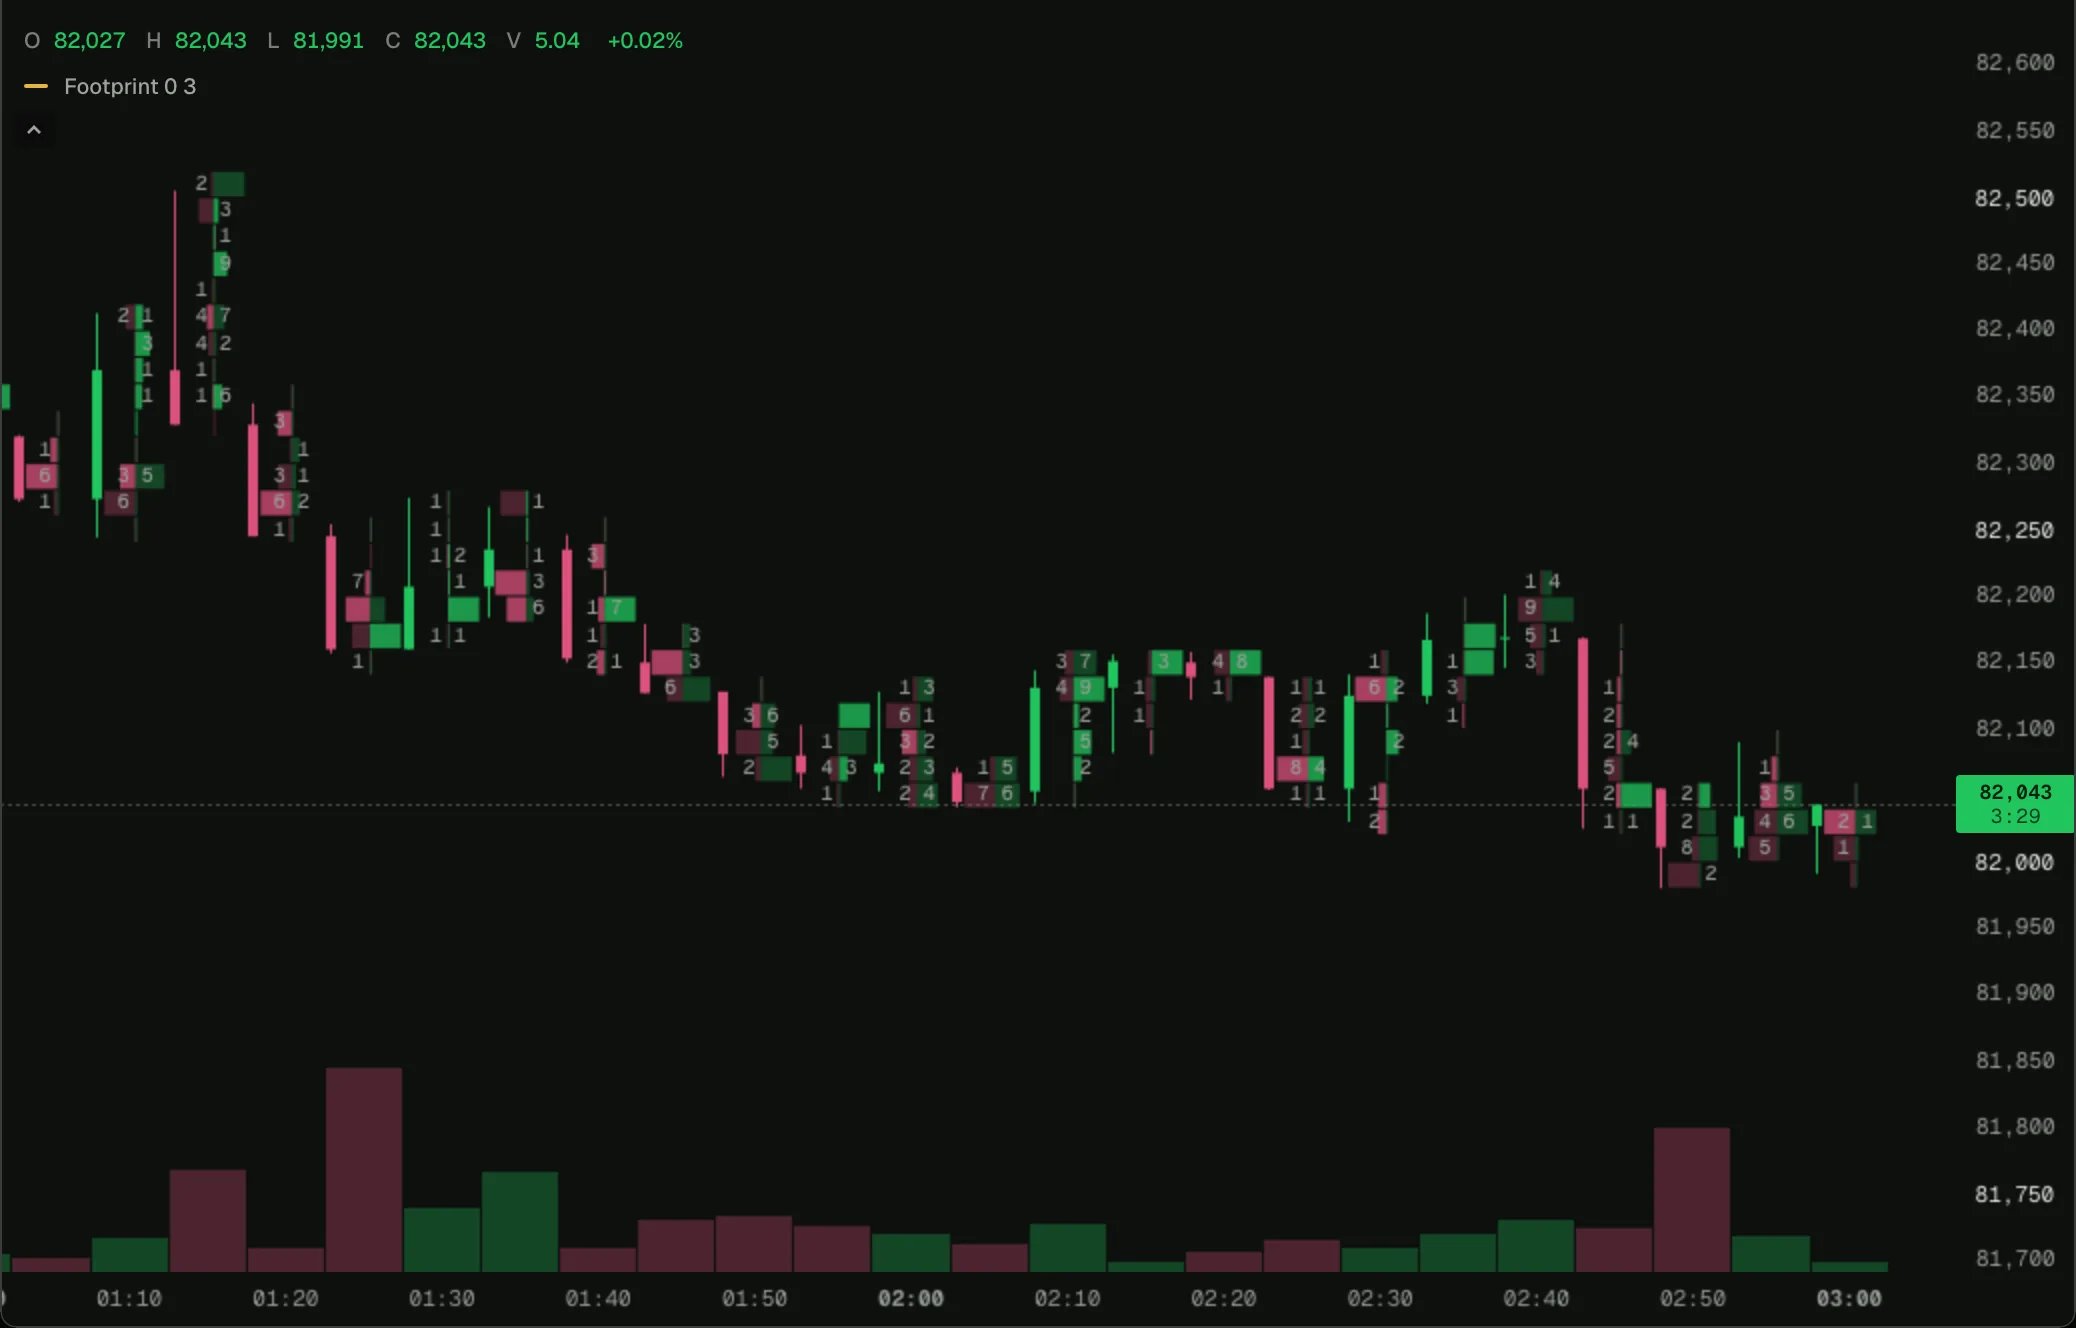
BTC on 5-minute bars in the 0xArchive Terminal, 2026-10-16.
Open on a chart
Load it on BTC 5m in the terminal, then change its settings or open it in the script editor.
How it works
volumeProfile() gives each bar’s trades by price, and plot.cells draws them as bands of price inside the bar, in two columns. One row size holds for the whole chart, picked from the first bar’s price unless the input sets it, so a row is the same row on every bar. Zoom in until the bars are wide enough for the numbers: a cell too small for its number shortens it, then leaves it out.
The script
footprint-cells.ts