

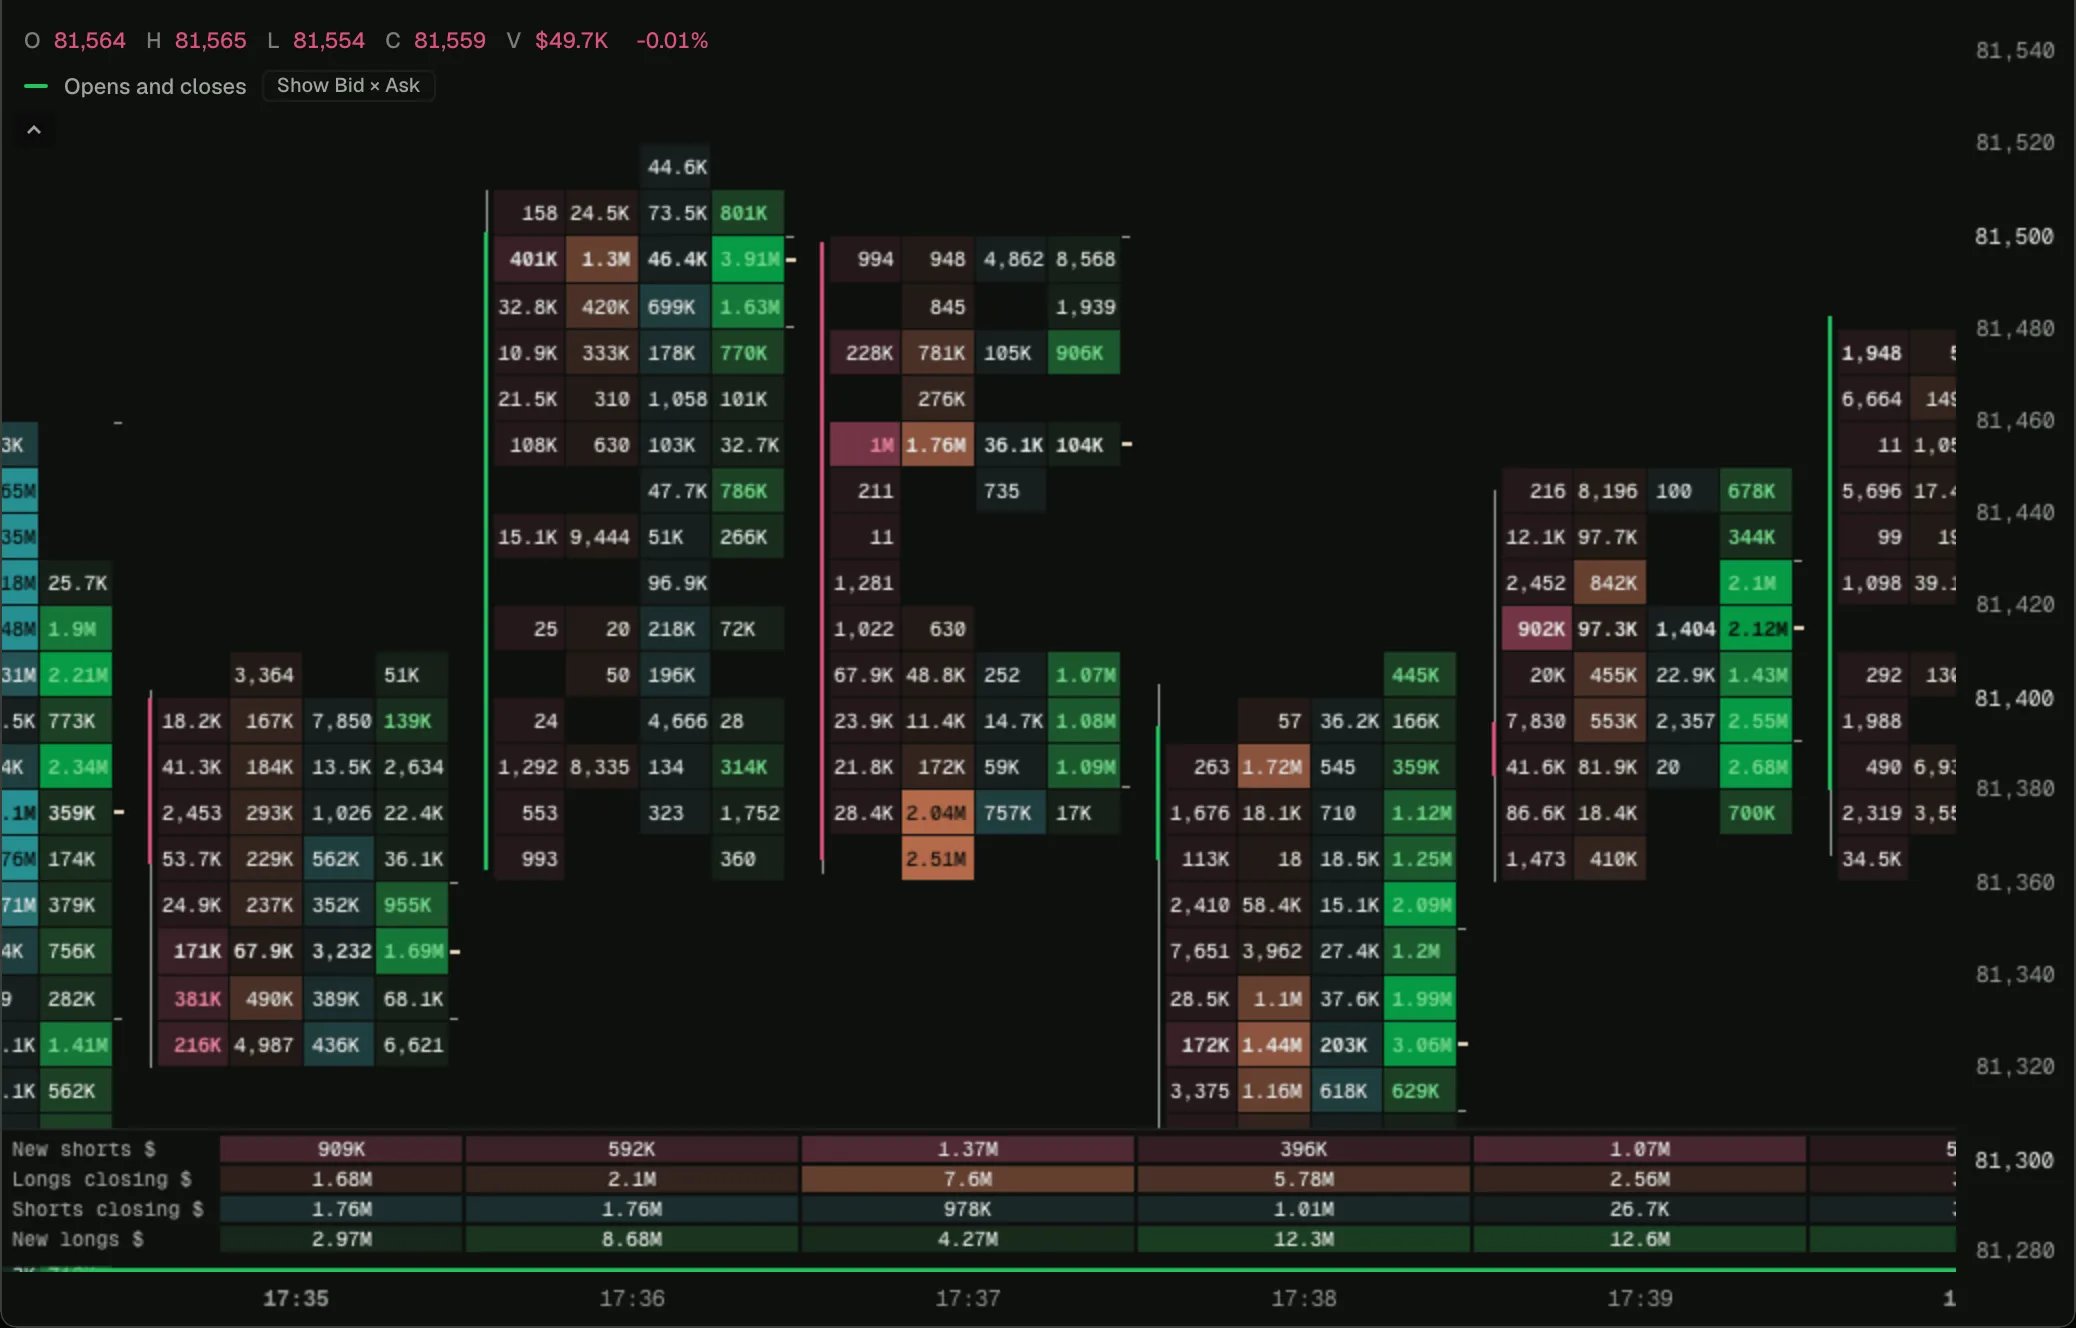
BTC on 1-minute bars in the 0xArchive Terminal, 2026-10-17.
Open on a chart
Load it on BTC 1m in the terminal, then change its settings or open it in the script editor.
How it works
Each fill’stakerWhy puts it in one lane. A flip (flip_ls, flip_sl) opens the other way, so it counts as an open. The closing lanes take hues of their own, orange and teal, so they are never mistaken for the opening ones at small sizes. The statistics rows under each bar are the four lanes summed.
Try changing
- Drop the opposed pair to turn the imbalance marks off.
- Split the closes into stops and profit taking with
stop_longandtp_long, in place of the opens.
The script
opens-closes-footprint.ts