

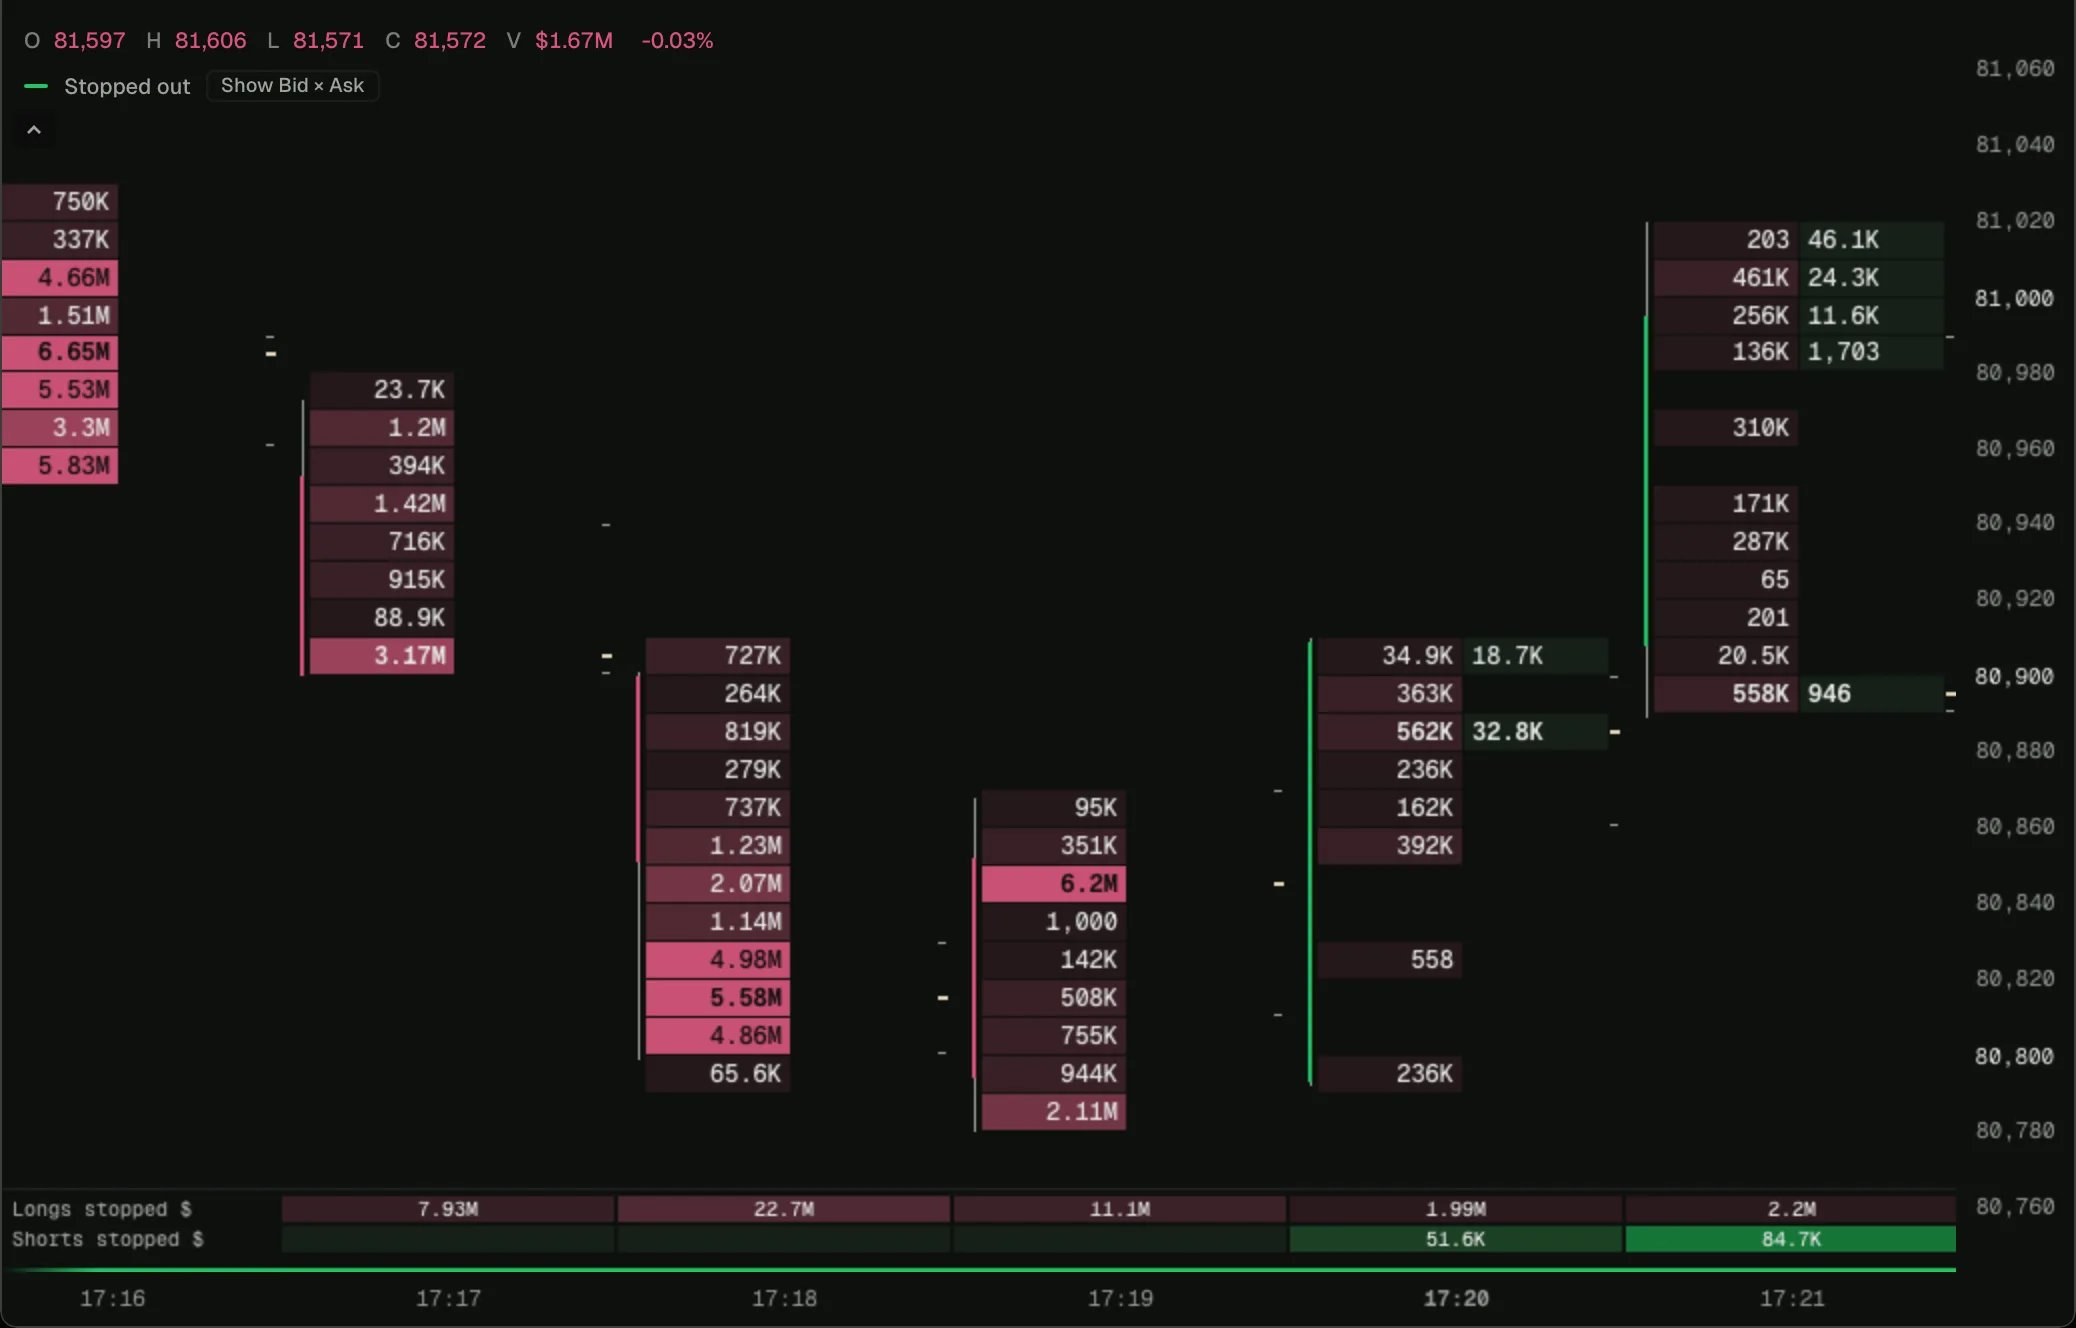
BTC on 1-minute bars in the 0xArchive Terminal, 2026-10-17.
Open on a chart
Load it on BTC 1m in the terminal, then change its settings or open it in the script editor.
How it works
Each fill’stakerWhy says what the taker’s position did. stop_long and stop_short are closes at a loss, or forced by a liquidation or auto-deleveraging. plot.footprint declares two lanes, and fp.add in onTrade adds each stopped fill’s size at its price. The footprint groups the prices into its rows as you zoom, as it does for Bid × Ask.
Try changing
- Add
tp_longandtp_shortas two more lanes, Longs taking profit and Shorts taking profit, to see stops beside profit taking. - Use
t.notionalin place oft.size, withmeasure: 'count', to print dollars whatever the chart’s unit.
The script
stopped-out-footprint.ts