

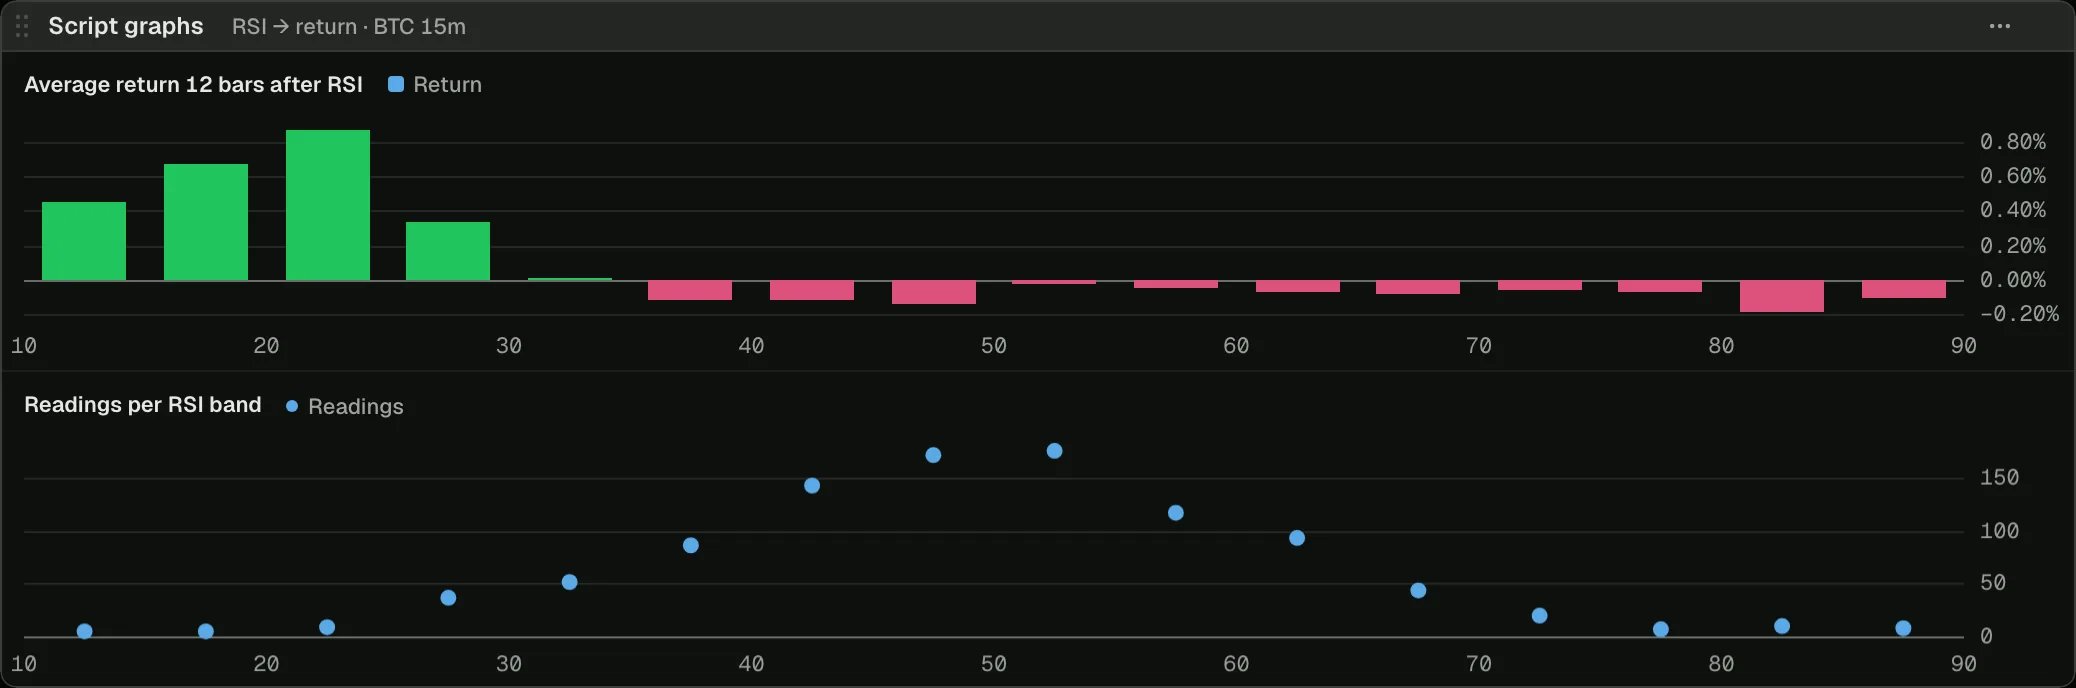
BTC on 15-minute bars in the 0xArchive Terminal, 2026-10-16.
Open on a chart
Load it on BTC 15m in the terminal, then change its settings or open it in the script editor.
How it works
graph(title) spaces its keys by value, so each band sits at its middle (32.5 for 30 to 35). Each bar looks back Bars ahead bars through series of RSI and close, adds what price did since to that reading’s band, and sets the band’s average, coloured by its sign. A band with few readings is noise: read the second graph before the first.
The script
rsi-forward-returns.ts