

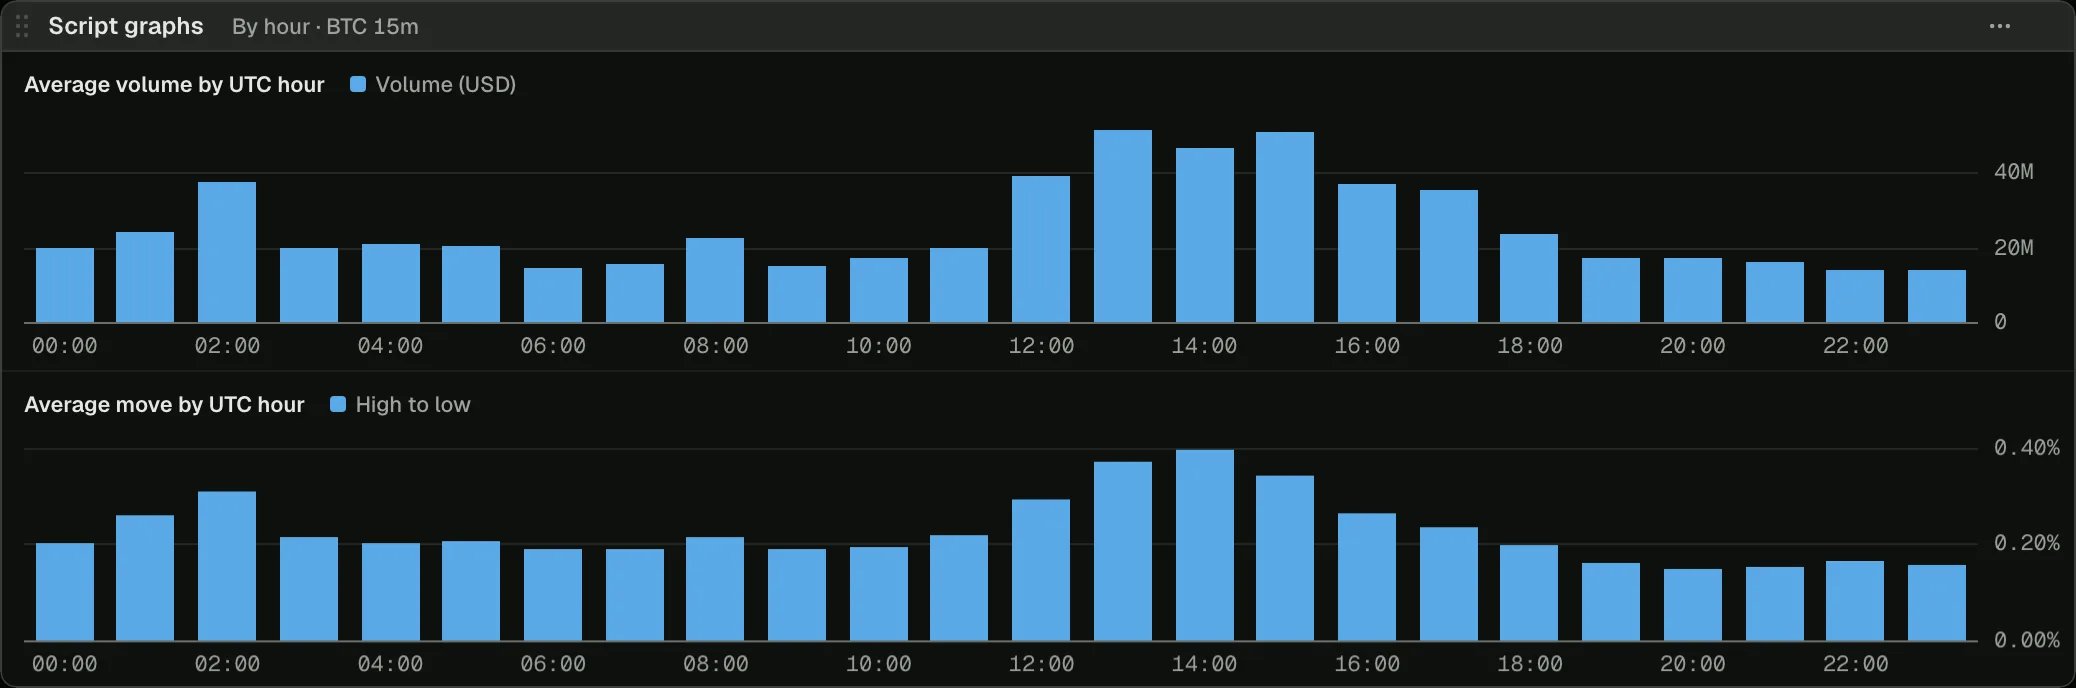
BTC on 15-minute bars in the 0xArchive Terminal, 2026-10-16.
Open on a chart
Load it on BTC 15m in the terminal, then change its settings or open it in the script editor.
How it works
graph(title, { axis: 'category' }) makes a graph whose keys are names. The script sets all 24 hours on its first bar, empty, so they keep their order and a quiet hour keeps its place. A sum and a count per hour sit in state maps, and each bar sets its hour’s average. Hourly bars or shorter give each hour its own bars.
The script
volume-by-hour.ts