

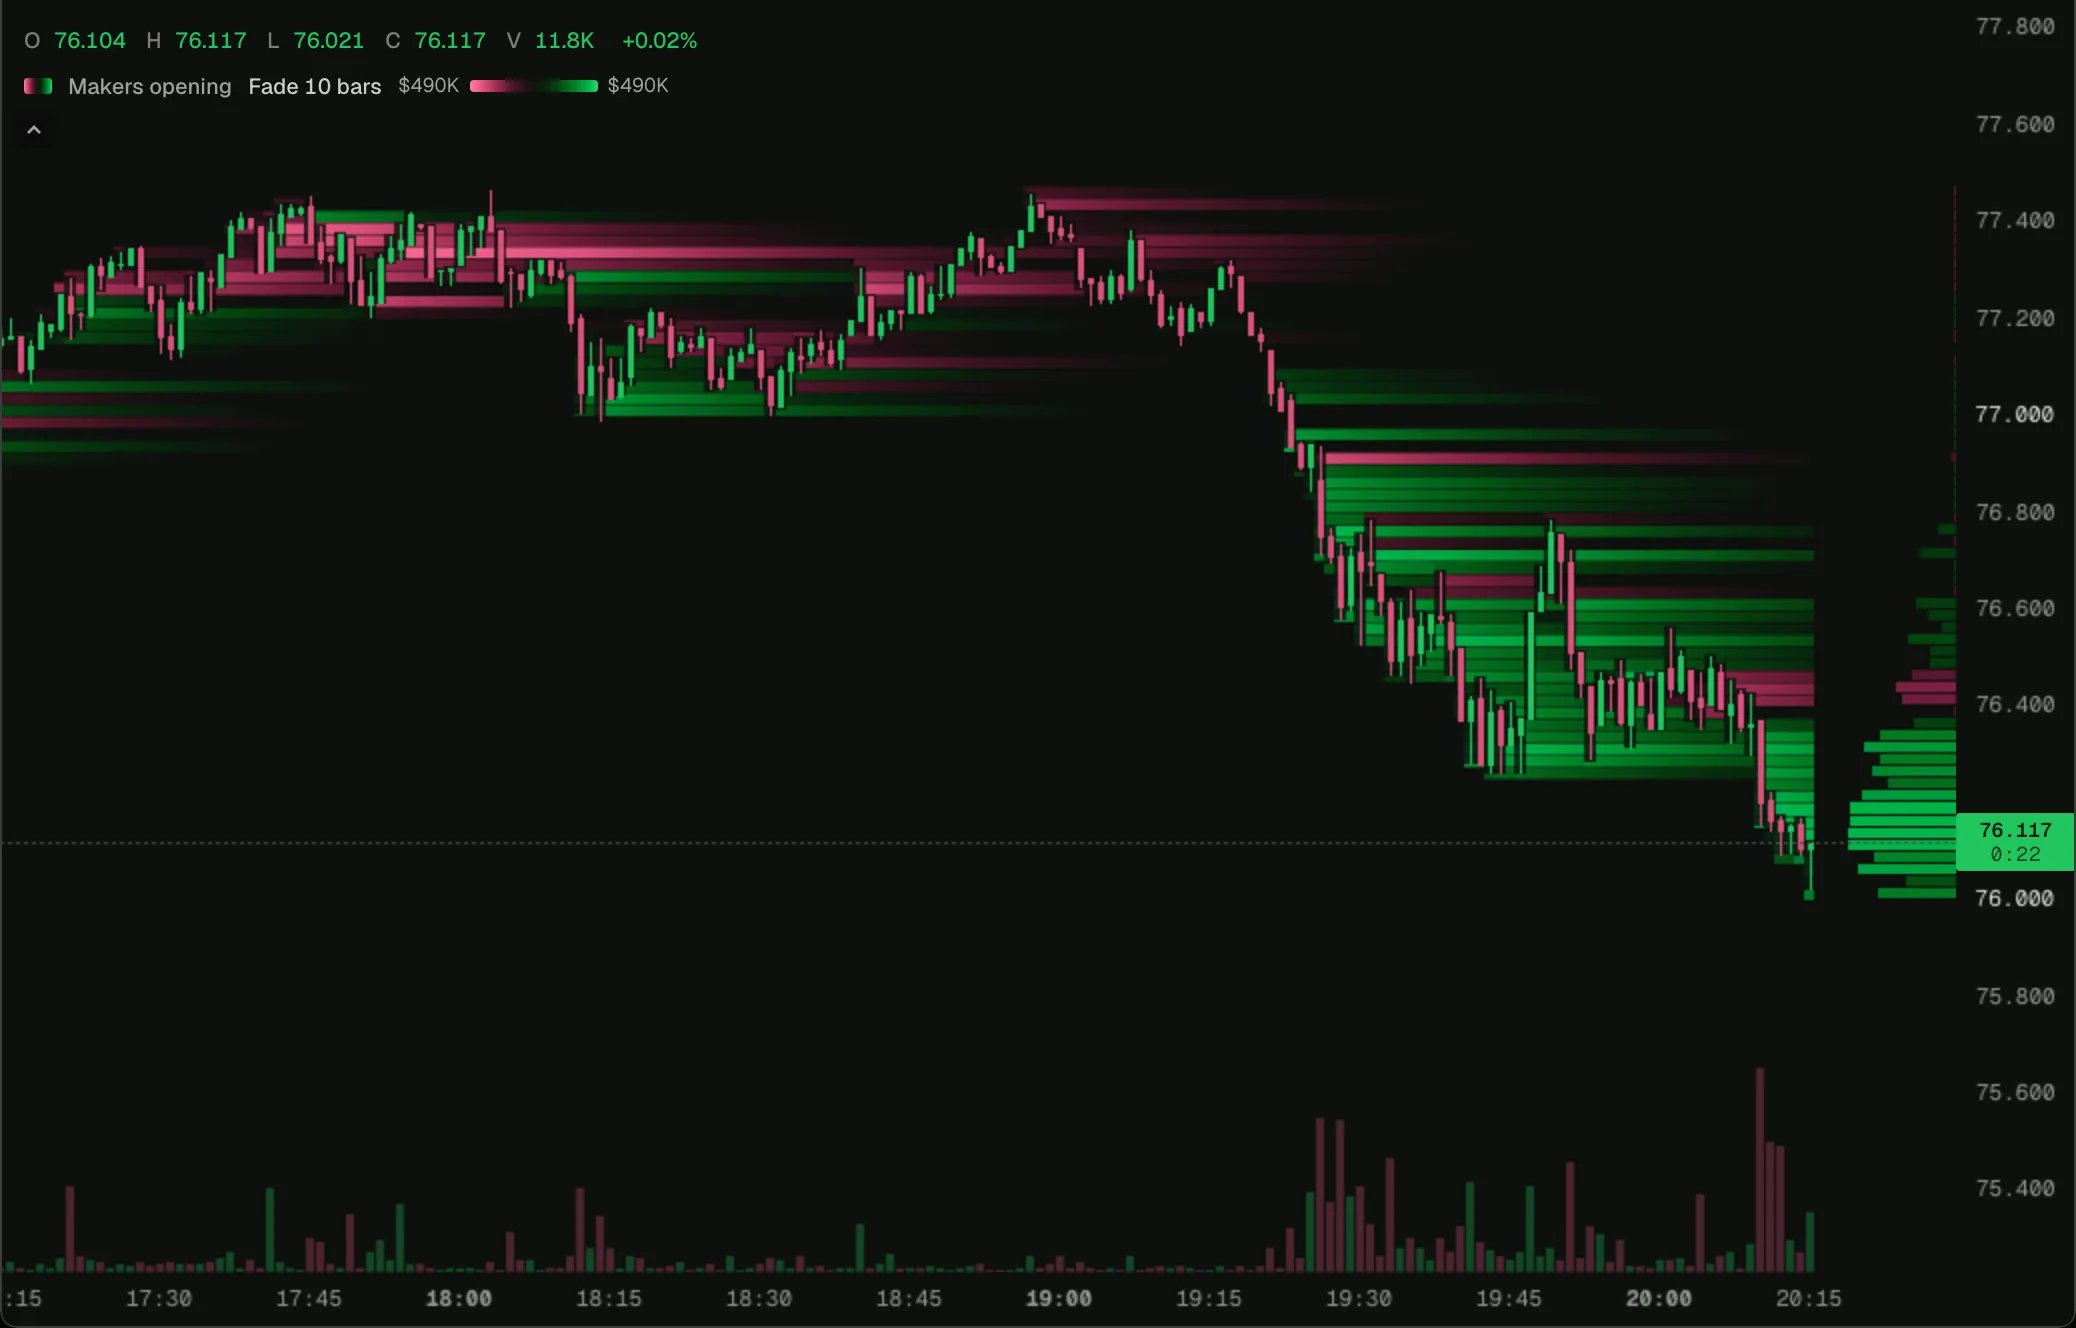
HYPE on 1-minute bars in the 0xArchive Terminal, 2026-10-18.
Open on a chart
Load it on HYPE 1m in the terminal, then change its settings or open it in the script editor.
How it works
Each fill’smakerWhy says what the maker’s position did. A taker sell fills a resting bid, so a sell whose maker opened or flipped long is a bid maker opening; a taker buy fills an ask likewise. plot.heat declares the two sides and nets them per row; the chart carries the values so the zones stay behind later candles.
Try changing
- Count makers closing instead (
close_long,close_short) to see who took profit into the move.
The script
makers-opening-heat.ts