

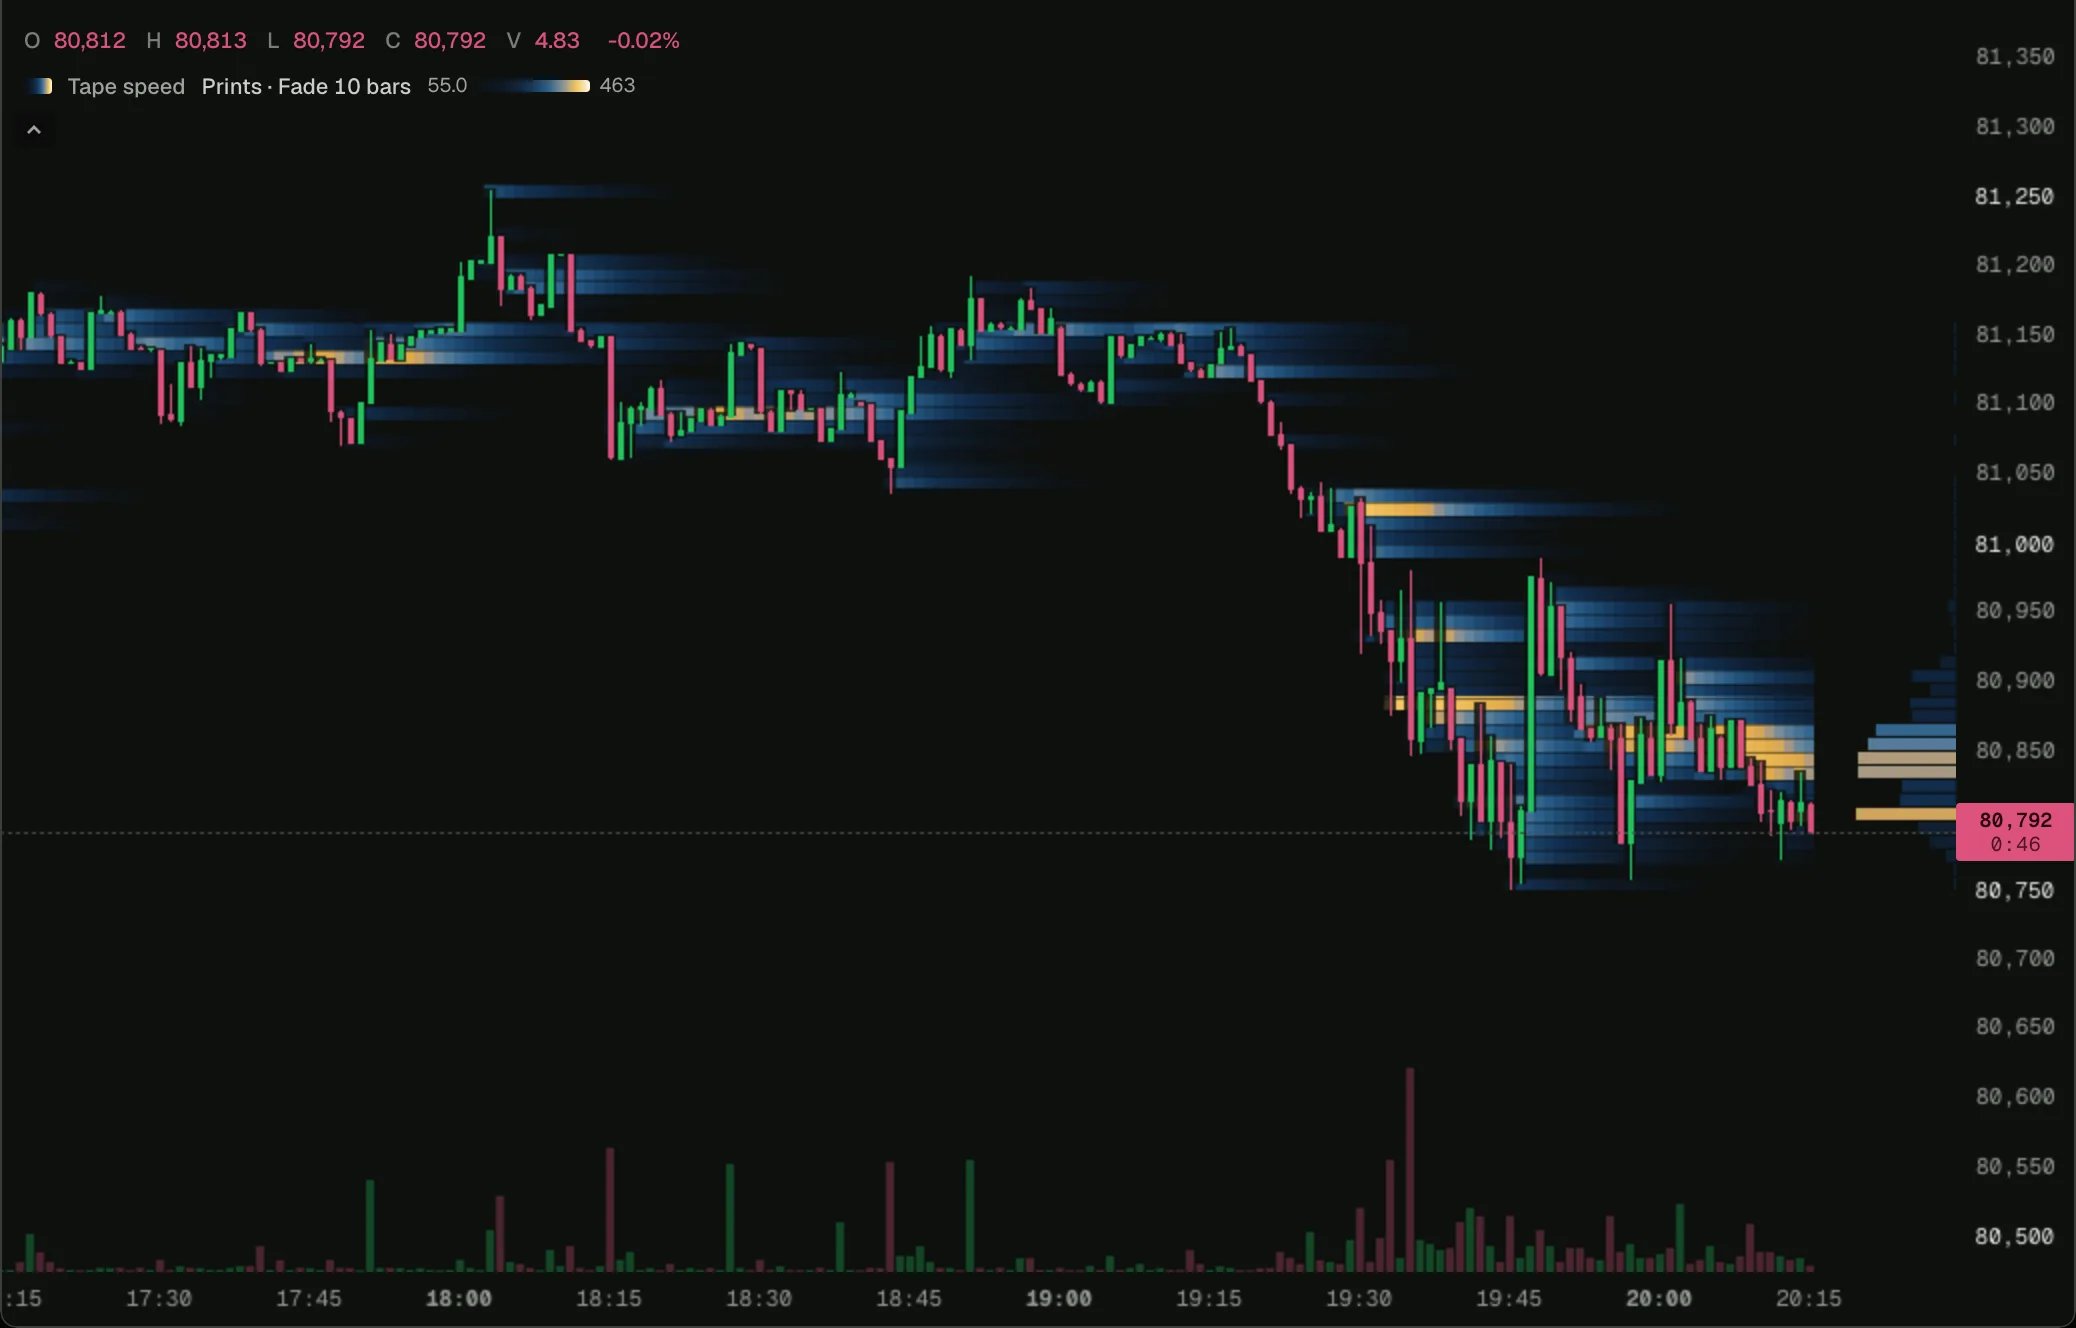
BTC on 1-minute bars in the 0xArchive Terminal, 2026-10-18.
Open on a chart
Load it on BTC 1m in the terminal, then change its settings or open it in the script editor.
Inputs
- Count: Prints, each fill, or Taker orders, an order once at each price it filled at. One order fills against several makers, so prints run about 1.5 to 1.8 times the orders.
- Against: Nothing, or Last hour, which divides each print by the last hour’s prints a bar. On a long window that lights a quiet session’s bursts as brightly as a busy one’s. It needs an hour of bars before it draws.
- By side: each row in its faster side’s colour, sellers or buyers, at the row’s total speed.
How it works
plot.heat declares a one-sided heat measured in counts, and heat.add(t.price, 1) in onTrade counts each print at its price. The chart carries the values, groups the rows with the zoom and colours them on the order book heatmap’s ramp. Against the last hour keeps each bar’s count in a tally, averages an hour of them in onClose, and adds 1 / pace per print instead of 1.
Try changing
- Count only large prints:
if (t.notional < 50_000) return;at the top ofonTrade. - Use
measure: 'size'and addt.sizeto draw traded volume the same way, for comparison.
The script
tape-speed-heat.ts