

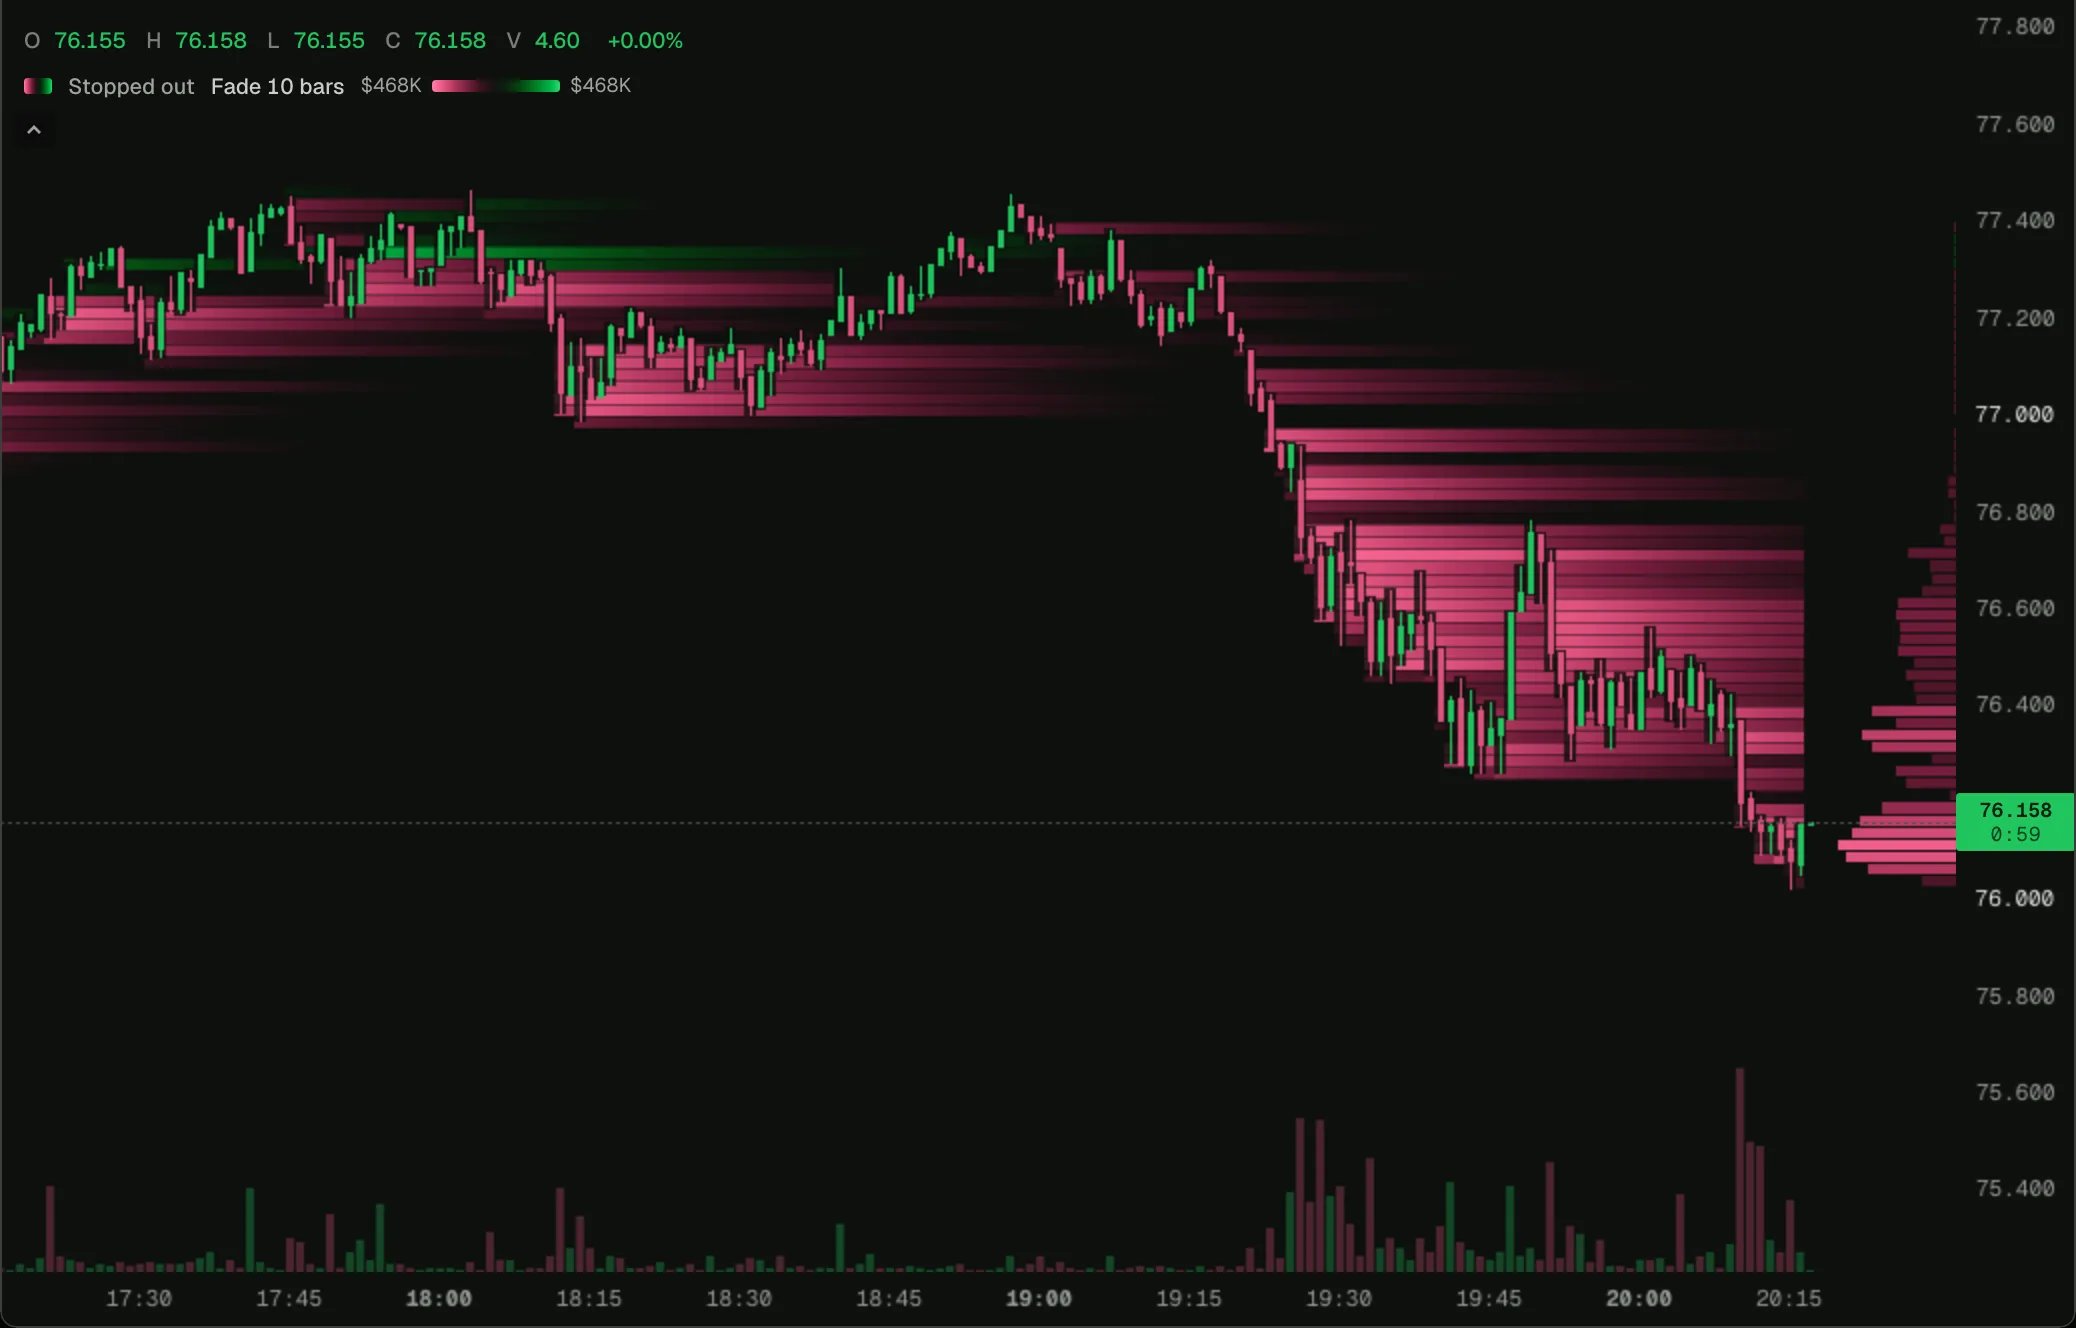
HYPE on 1-minute bars in the 0xArchive Terminal, 2026-10-18.
Open on a chart
Load it on HYPE 1m in the terminal, then change its settings or open it in the script editor.
How it works
Each fill’stakerWhy says what the taker’s position did; stop_long and stop_short are closes at a loss, or forced by a liquidation or auto-deleveraging. plot.heat declares two sides, and heat.add(side, price, size) in onTrade adds each stopped fill. With combine: 'net', the default, a row where both sides were stopped draws only what is left.
Try changing
combine: 'larger'draws a row’s whole total in its larger side’s colour instead.carry: 'hold'makes Hold the heat’s default.
The script
stopped-out-heat.ts