

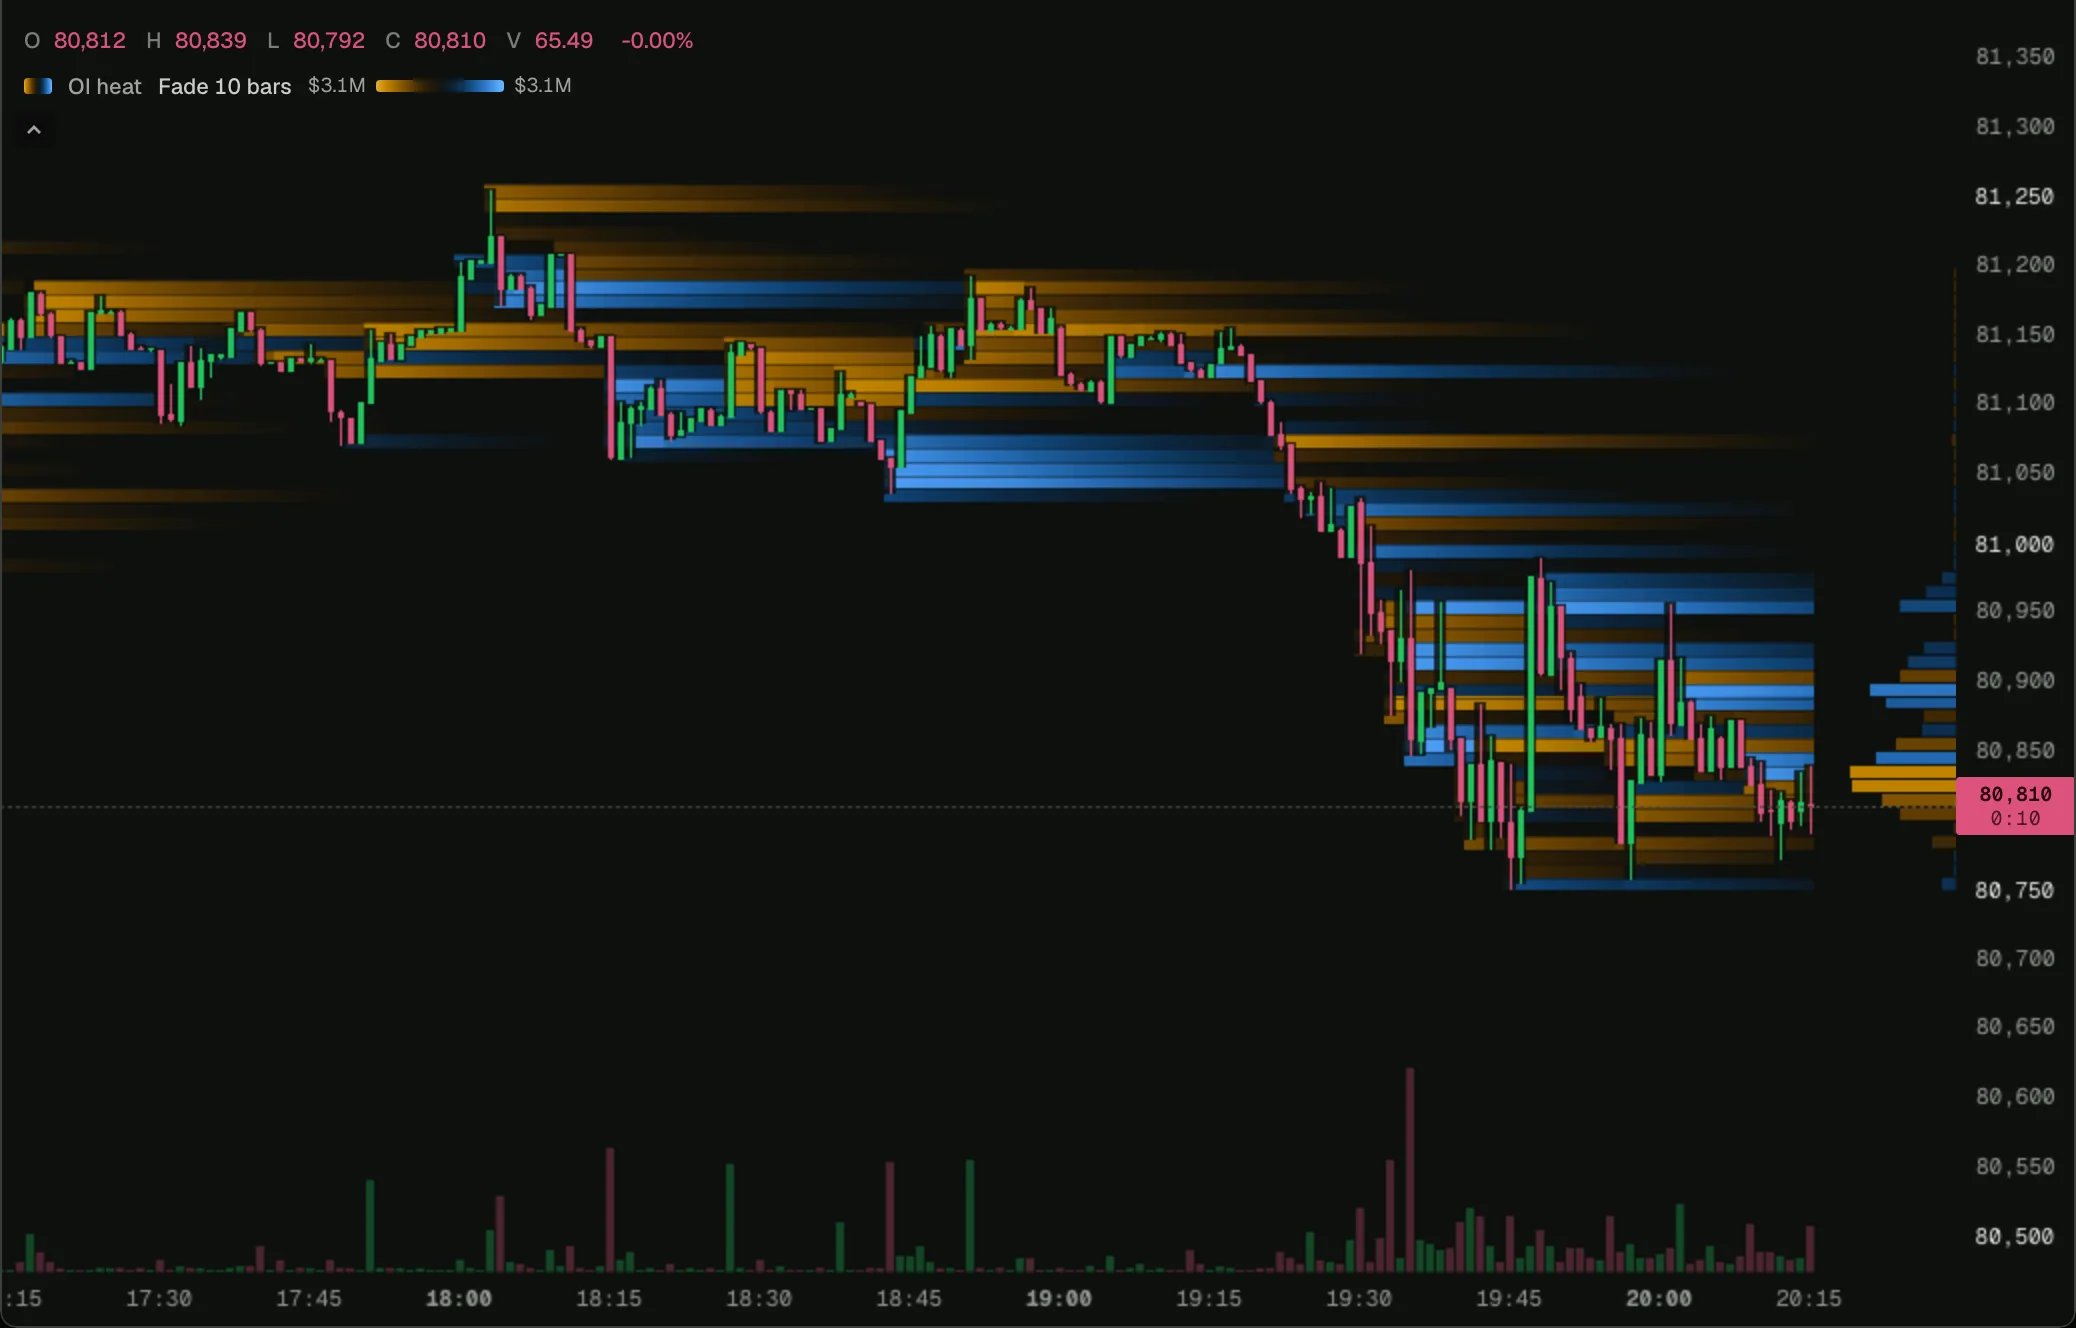
BTC on 1-minute bars in the 0xArchive Terminal, 2026-10-18.
Open on a chart
Load it on BTC 1m in the terminal, then change its settings or open it in the script editor.
How it works
Each fill’soiDelta is its change in the venue’s open interest: above 0 where both sides opened, below where both closed, 0 where one opened and the other closed. plot.heat declares two sides with the script’s own colours, which the chart turns apart if a theme puts them close, and heat.add adds each fill’s change at its price.
Try changing
carry: { fade: 30 }keeps the zones for longer by default.
The script
open-interest-heat.ts