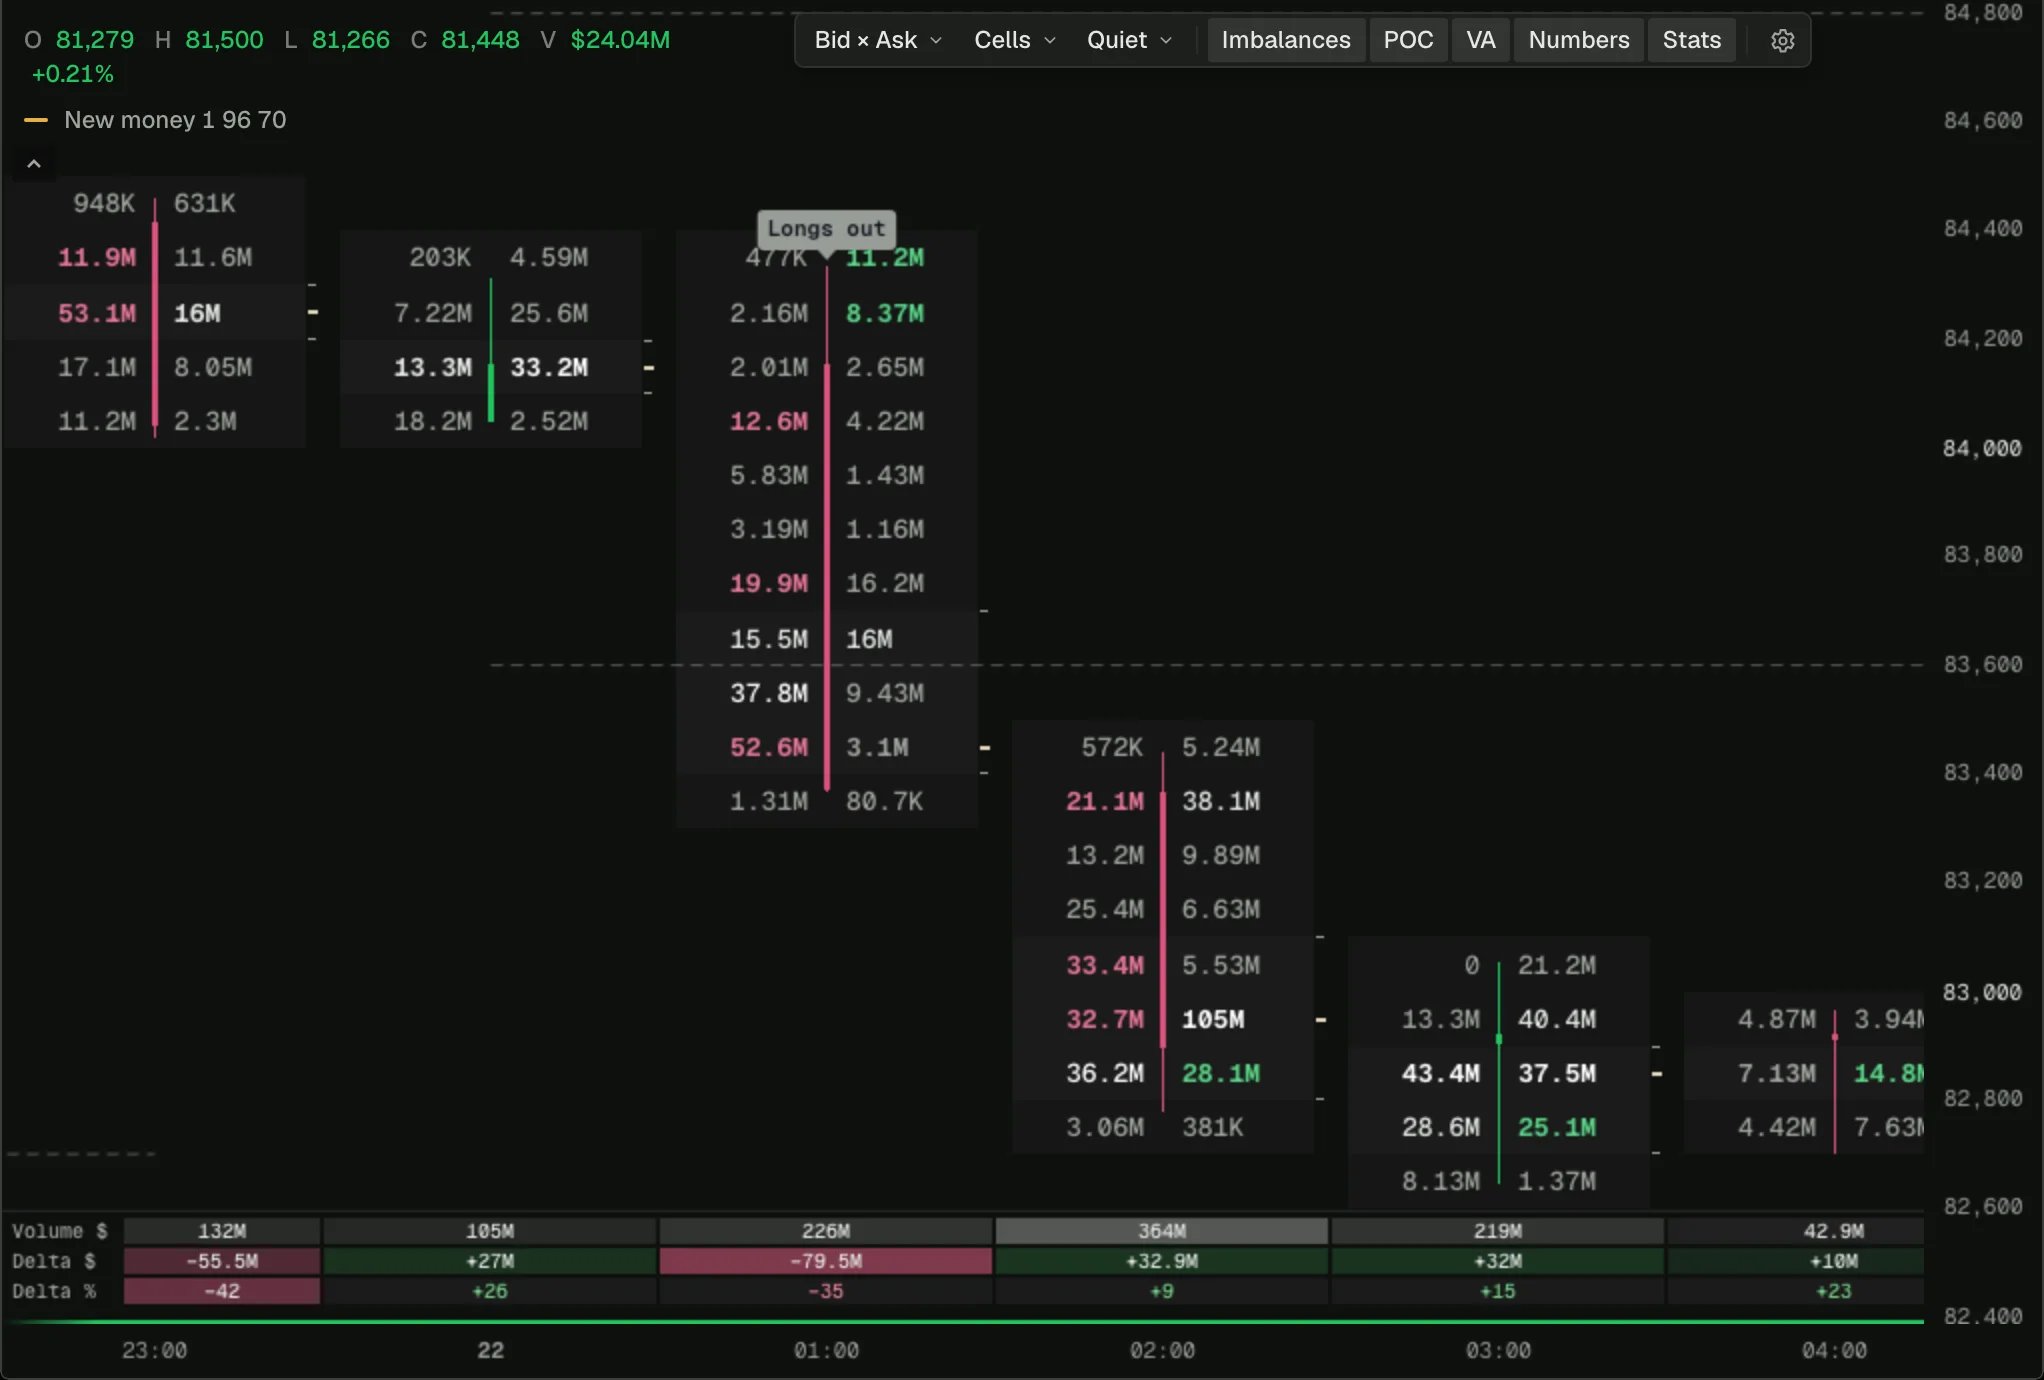
// Breakout with new money: the first close outside the previous UTC day's value area, read by what
// open interest did on that bar. Open interest rising means traders opened positions to push price
// out, which tends to hold; falling means the move was positions closing (shorts covering on a move
// up), which tends to fade. Each fill's `oiDelta` says which, bar by bar. "Rising" is against the
// market's own typical swing, since how far open interest moves in a bar depends on the market and
// the interval. The previous day's value area high and low are drawn across each day, from the
// footprint's rows.
indicator('Breakout with new money', { overlay: true, shortName: 'New money', maxLines: 120, maxLabels: 4 });

const lift = input.float('Times a typical bar\'s open interest change', 1, { min: 0, step: 0.1, tooltip: 'Above this the breakout is new money; below its negative, positions closing; between, mixed' });
const typicalOver = input.int('Typical over (bars)', 96, { min: 10, max: 2000 });
const vaShare = input.float('Value area (%)', 70, { min: 10, max: 100 });

const chart = bars();
const tape = trades();
const profile = volumeProfile();
const oi = tally();

// A bar's open interest change as a share of its volume, and the typical size of it: an average of
// its size over about `typicalOver` bars, from the first bar the trades cover.
const typical = state.bar<number>(na);
const seen = state.bar<number>(0);

// Each day's reference: the bar it starts on and the previous day's value area. Which side of the
// current one the last close was on (-1 below, 0 inside, 1 above).
const DAYS = 60;
const from = state.list<number>(DAYS);
const vah = state.list<number>(DAYS);
const val = state.list<number>(DAYS);
const sideOf = state.bar<number>(0);

const up = plot.shape('Breakout up', { shape: 'labelUp', location: 'below', size: 'small' });
const down = plot.shape('Breakout down', { shape: 'labelDown', location: 'above', size: 'small' });
const upAlert = alert('Breakout up with new money', { message: 'Closed above the previous day\'s value area with open interest rising' });
const downAlert = alert('Breakout down with new money', { message: 'Closed below the previous day\'s value area with open interest rising' });

tape.onTrade((t) => {
  if (!isNa(t.oiDelta)) oi.add(t.oiDelta);
});

chart.onBar(() => {
  const pct = chart.volume > 0 ? oi.value / chart.volume * 100 : 0;
  // The typical size up to the bar before this one.
  const usual = typical.value;
  if (profile.available && chart.volume > 0) {
    seen.value = Math.min(seen.value + 1, typicalOver);
    typical.value = isNa(usual) ? Math.abs(pct) : usual + (Math.abs(pct) - usual) / seen.value;
  }

  let wentUp = false;
  let wentDown = false;
  let text = '';
  let tone: Color = color.neutral;
  const at = vah.length - 1;
  if (at >= 0 && !isNa(vah.get(at))) {
    const now = chart.close > vah.get(at) ? 1 : chart.close < val.get(at) ? -1 : 0;
    if (now !== 0 && now !== sideOf.value && !isNa(usual)) {
      wentUp = now > 0;
      wentDown = now < 0;
      const needed = usual * lift;
      text = pct >= needed ? 'New money' : pct <= -needed ? (wentUp ? 'Covering' : 'Longs out') : 'Mixed';
      tone = pct >= needed ? (wentUp ? color.up : color.down) : color.neutral;
    }
    sideOf.value = now;
  }
  up.set(wentUp, { text, color: tone });
  down.set(wentDown, { text, color: tone });
  upAlert.fire(wentUp && text === 'New money', `Closed above the previous day's value area, open interest +${fmt.num(pct, 0)}% of the bar's volume`);
  downAlert.fire(wentDown && text === 'New money', `Closed below the previous day's value area, open interest +${fmt.num(pct, 0)}% of the bar's volume`);

  // The day's last bar: its value area becomes the next day's reference. Once a day, from every trade of the day.
  const day = clock.startOf(chart.time, 'day');
  if (chart.confirmed && clock.startOf(chart.closeTime, 'day') !== day) {
    // A day older than the trades is missing its start, so it is no reference.
    const session = profile.since(day);
    const area = session.available ? session.valueArea(vaShare, { rowSize: chart.rowSize }) : null;
    if (from.length === DAYS) for (const list of [from, vah, val]) list.shift();
    from.push(chart.index + 1);
    vah.push(area === null ? na : area.high);
    val.push(area === null ? na : area.low);
    sideOf.value = area === null ? 0 : chart.close > area.high ? 1 : chart.close < area.low ? -1 : 0;
  }

  if (chart.isLast) drawReferences();
});

/** Each day's reference as two dashed lines across that day, the current one tagged at the newest bar. */
function drawReferences() {
  const ink = color.withAlpha(color.neutral, 0.55);
  for (let i = 0; i < from.length; i += 1) {
    if (isNa(vah.get(i)) || from.get(i) > chart.index) continue;
    const to = i + 1 < from.length ? from.get(i + 1) - 1 : chart.index;
    for (const price of [vah.get(i), val.get(i)]) draw.line({ from: { bar: from.get(i), price }, to: { bar: to, price }, color: ink, style: 'dashed' });
  }
  const at = from.length - 1;
  if (at < 0 || isNa(vah.get(at)) || from.get(at) > chart.index) return;
  draw.label({ at: { bar: chart.index, price: vah.get(at) }, text: 'Prev VAH', style: 'left', color: color.panel, textColor: color.neutral, size: 'small' });
  draw.label({ at: { bar: chart.index, price: val.get(at) }, text: 'Prev VAL', style: 'left', color: color.panel, textColor: color.neutral, size: 'small' });
}