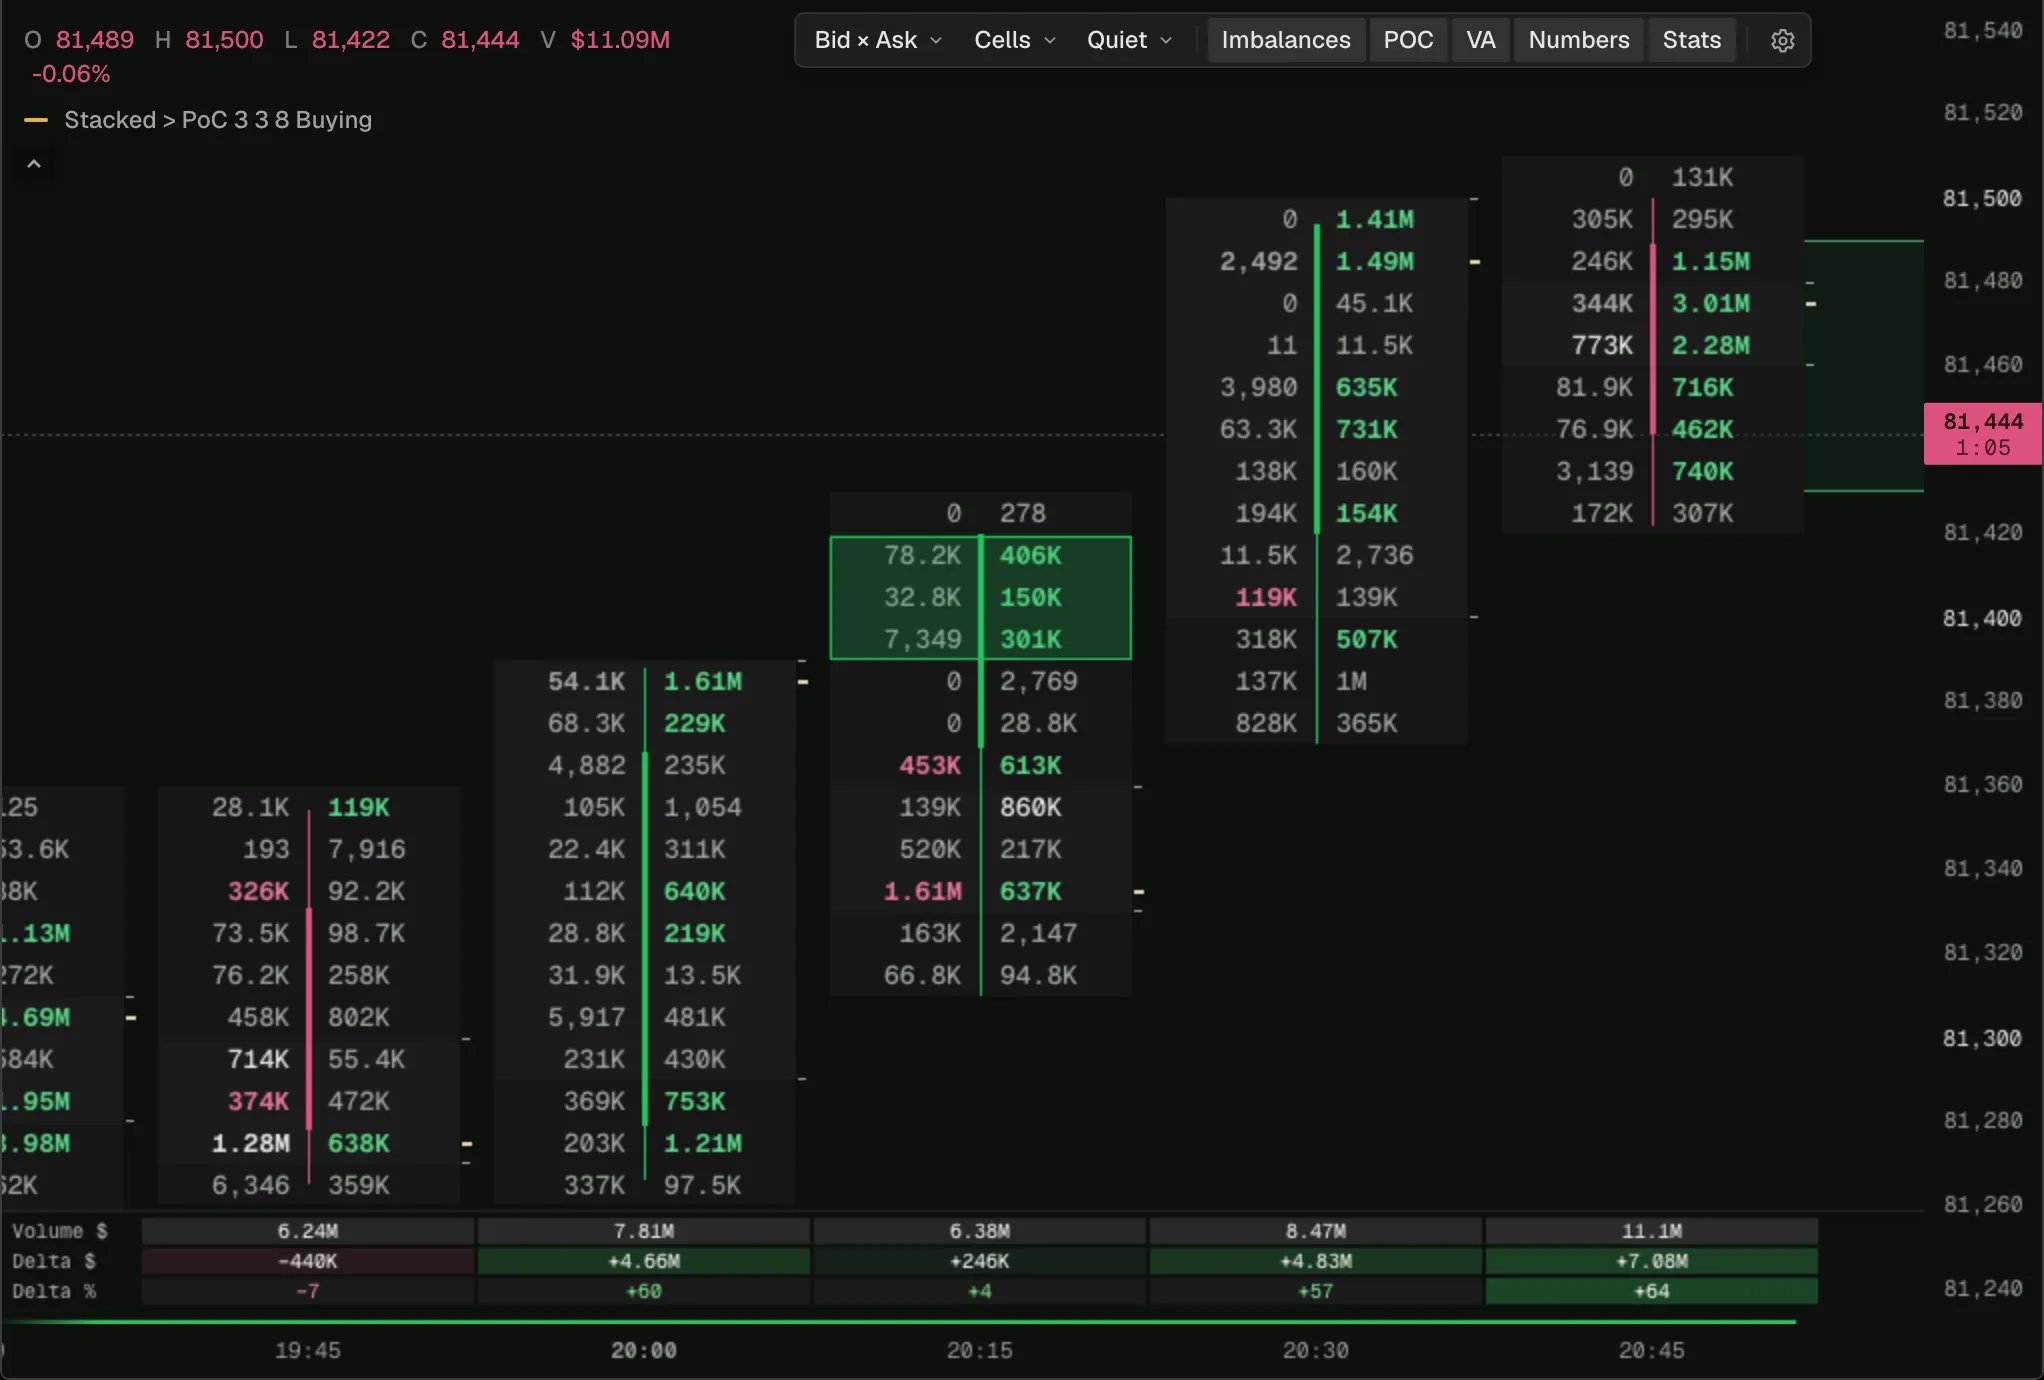
Stacked imbalances above a bar’s point of control, on bars that closed above it, marked on the footprint’s own rows.
BTC on 15-minute bars in the 0xArchive Terminal, 2026-10-23.
Open on a chart
Load it on BTC 15m in the terminal, then change its settings or open it in the script editor.
Buyers stepping up through a bar’s busiest price and holding there into the close: three or more imbalanced rows in a row, wholly above the bar’s point of control, on a bar that closed above it. Each stack is shaded across the bar, on the Bid × Ask footprint’s own rows, so it sits exactly on the imbalances the footprint colours. Side marks selling stacks too, or only them.The imbalances follow the footprint chart’s rule: buying at a row against the selling one row below it (diagonal), three times or more, leaving out cells under 8% of the bar’s biggest. Each is an input. Only closed bars are marked, since “closed above” needs a close.
chart.rowSize is the row size the footprint draws, Auto or the reader’s own. volumeProfile() gives each bar’s rows and point of control at that size, and plot.cells shades each stack as one band inside the bar. When Auto picks other rows as you zoom, the script runs again on them.
// Stacked imbalances above the point of control, on bars that closed above it: buyers stepping up// through the bar's busiest price and holding there into the close. Each stack is shaded across the// bar, on the footprint's own rows. Imbalances follow the footprint chart's rule: buying at a row// against the selling one row below it (diagonal), 3x or more, leaving out cells under 8% of the// bar's biggest; three imbalanced rows in a row make a stack.indicator('Stacked imbalances above PoC', { overlay: true, shortName: 'Stacked > PoC' });const ratio = input.float('Imbalance ratio', 3, { min: 1, step: 0.5 });const stack = input.int('Rows in a stack', 3, { min: 2, max: 20 });const floorPct = input.float('Ignore cells under % of the bar\'s biggest', 8, { min: 0, max: 100 });const side = input.choice('Side', 'buy', ['buy', 'sell', 'both'] as const, { labels: { buy: 'Buying', sell: 'Selling', both: 'Both' } });const chart = bars();const profile = volumeProfile();const marks = plot.cells('Stacks', { candles: 'overlay', scale: 'unit' });const fired = alert('Stacked imbalance above PoC', { message: 'Stacked imbalance above the PoC, bar closed above it' });chart.onBar(() => { // "Closed above" needs a close: the forming bar waits until it has one. if (!chart.confirmed || !profile.available) return; const bar = profile.bar(); const rows = bar.rows({ rowSize: chart.rowSize }); const poc = bar.poc({ rowSize: chart.rowSize }); if (rows === null || poc === null || chart.close < poc.high) return; let biggest = 0; for (const row of rows) biggest = Math.max(biggest, row.buy, row.sell); const floor = biggest * floorPct / 100; // Rows run lowest price first, so the row below is i - 1 and the row above is i + 1. const buyImb = rows.map((row, i) => i > 0 && row.buy > 0 && row.buy >= floor && row.buy >= ratio * rows[i - 1].sell); const sellImb = rows.map((row, i) => i + 1 < rows.length && row.sell > 0 && row.sell >= floor && row.sell >= ratio * rows[i + 1].buy); let found = false; const shade = (flags: boolean[], tone: Color) => { let run = 0; for (let i = 0; i <= rows.length; i += 1) { if (i < rows.length && flags[i]) { run += 1; continue; } const from = i - run; // The whole stack sits above the point of control's row. if (run >= stack && rows[from].low >= poc.high) { marks.add({ low: rows[from].low, high: rows[i - 1].high, color: color.withAlpha(tone, 0.22), border: tone }); found = true; } run = 0; } }; if (side !== 'sell') shade(buyImb, color.up); if (side !== 'buy') shade(sellImb, color.down); fired.fire(found);});