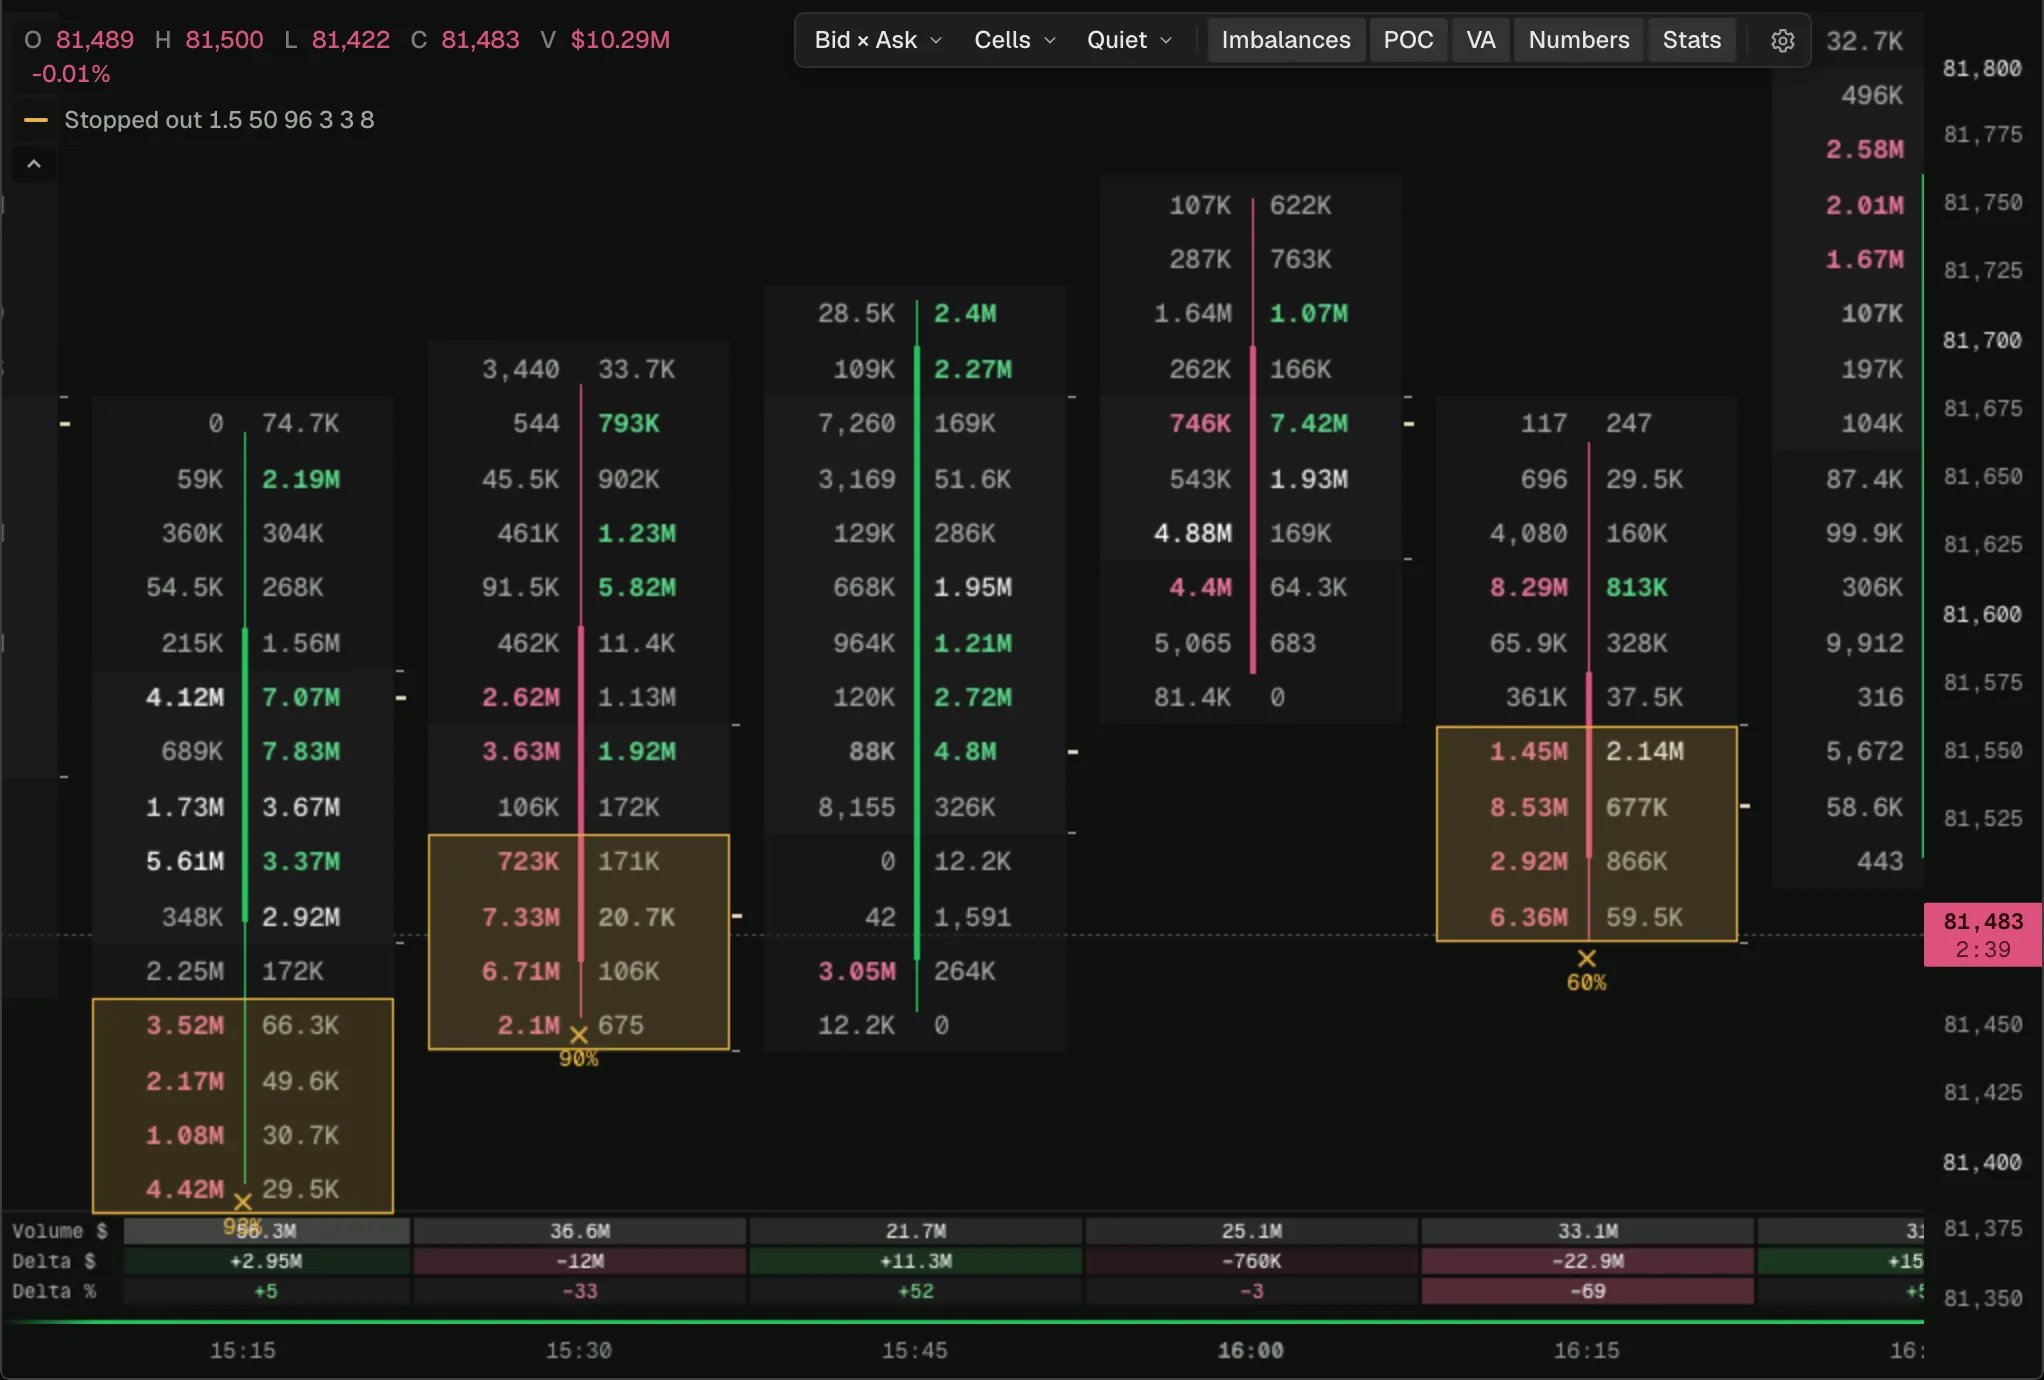
// Stopped out at the extreme: a stacked imbalance at a bar's high made far more than usual by shorts
// closing at a loss, stopped or liquidated (or at its low, by longs). Buying that comes from shorts
// giving up ends when they run out, so it often marks the end of a move rather than its start.
// Each fill's `takerWhy` says whether the taker opened or closed, and at a profit or a loss, which a
// footprint alone cannot. "Usual" is the market's own: the share of its taker buying that was
// shorts stopping over the last day, since on some markets that is nearly half of all selling.
// Stacks follow the footprint chart's rule, on its rows; each one is outlined, and the mark past the
// bar's extreme says how much of it was stopped.
indicator('Stopped out at the extreme', { overlay: true, shortName: 'Stopped out' });

const lift = input.float('Times the usual stopped share', 1.5, { min: 1, step: 0.1 });
const minStopped = input.float('Stopped share of the stack, at least (%)', 50, { min: 0, max: 100 });
const baseline = input.int('Usual over (bars)', 96, { min: 10, max: 2000 });
const ratio = input.float('Imbalance ratio', 3, { min: 1, step: 0.5 });
const stack = input.int('Rows in a stack', 3, { min: 2, max: 20 });
const floorPct = input.float('Ignore cells under % of the bar\'s biggest', 8, { min: 0, max: 100 });

const chart = bars();
const tape = trades();
const profile = volumeProfile();
// Stopped taker size by row this bar: `<row>B`, shorts stopped into buying; `<row>S`, longs stopped into selling.
const stopped = tallyBy(8192);
const buys = tally();
const sells = tally();
const stoppedBuys = tally();
const stoppedSells = tally();
// The usual share, as averages of the bars' sums (their ratio is the ratio of the sums).
const buyAvg = ta.sma(baseline);
const sellAvg = ta.sma(baseline);
const stoppedBuyAvg = ta.sma(baseline);
const stoppedSellAvg = ta.sma(baseline);

// The theme's amber, which each theme sets to read on its own background.
const STOPPED = color.study(0);
const marks = plot.cells('Stopped stacks', { candles: 'overlay', scale: 'unit' });
const top = plot.shape('Stopped buying', { shape: 'xcross', location: 'above', color: STOPPED, size: 'small', textColor: STOPPED });
const bottom = plot.shape('Stopped selling', { shape: 'xcross', location: 'below', color: STOPPED, size: 'small', textColor: STOPPED });
const buyAlert = alert('Shorts stopped at the high', { message: 'Shorts stopped out into a stacked imbalance at the bar\'s high' });
const sellAlert = alert('Longs stopped at the low', { message: 'Longs stopped out into a stacked imbalance at the bar\'s low' });

tape.onTrade((t) => {
  const row = Math.floor(t.price / chart.rowSize + 1e-9);
  // A liquidation is stopped whatever the fill says about it.
  if (t.side === 'buy') {
    buys.add(t.size);
    if (t.takerWhy === 'stop_short' || t.liquidation) { stopped.add(`${row}B`, t.size); stoppedBuys.add(t.size); }
  } else {
    sells.add(t.size);
    if (t.takerWhy === 'stop_long' || t.liquidation) { stopped.add(`${row}S`, t.size); stoppedSells.add(t.size); }
  }
});

chart.onBar(() => {
  // The usual share up to the bar before this one: read before this bar's update.
  const usualBuy = stoppedBuyAvg.value / buyAvg.value;
  const usualSell = stoppedSellAvg.value / sellAvg.value;
  buyAvg.update(buys.value);
  sellAvg.update(sells.value);
  stoppedBuyAvg.update(stoppedBuys.value);
  stoppedSellAvg.update(stoppedSells.value);

  let buying = 0;
  let selling = 0;
  if (chart.confirmed && profile.available && !isNa(usualBuy) && !isNa(usualSell)) {
    const rows = profile.bar().rows({ rowSize: chart.rowSize });
    if (rows !== null && rows.length > 0) {
      let biggest = 0;
      for (const row of rows) biggest = Math.max(biggest, row.buy, row.sell);
      const floor = biggest * floorPct / 100;
      // Rows run lowest price first. A stack at the high reaches the top row or the one below it.
      const buyImb = rows.map((row, i) => i > 0 && row.buy > 0 && row.buy >= floor && row.buy >= ratio * rows[i - 1].sell);
      const sellImb = rows.map((row, i) => i + 1 < rows.length && row.sell > 0 && row.sell >= floor && row.sell >= ratio * rows[i + 1].buy);
      buying = mark(rows, buyImb, 'B', usualBuy, (from, to) => to >= rows.length - 2);
      selling = mark(rows, sellImb, 'S', usualSell, (from) => from <= 1);
    }
  }
  top.set(buying > 0, { text: `${Math.round(buying * 100)}%` });
  bottom.set(selling > 0, { text: `${Math.round(selling * 100)}%` });
  buyAlert.fire(buying > 0, `Shorts stopped out into a stacked imbalance at the bar's high: ${Math.round(buying * 100)}% of it`);
  sellAlert.fire(selling > 0, `Longs stopped out into a stacked imbalance at the bar's low: ${Math.round(selling * 100)}% of it`);
});

/** Outline each stack at the extreme whose taking was stopped far more than usual. The largest stopped share, or 0. */
function mark(rows: readonly ProfileRow[], flags: boolean[], kind: string, usual: number, atExtreme: (from: number, to: number) => boolean): number {
  const needed = Math.max(minStopped / 100, usual * lift);
  let found = 0;
  let run = 0;
  for (let i = 0; i <= rows.length; i += 1) {
    if (i < rows.length && flags[i]) { run += 1; continue; }
    const from = i - run;
    const to = i - 1;
    run = 0;
    if (to - from + 1 < stack || !atExtreme(from, to)) continue;
    let taken = 0;
    let made = 0;
    for (let r = from; r <= to; r += 1) {
      taken += kind === 'B' ? rows[r].buy : rows[r].sell;
      made += stopped.get(`${Math.round(rows[r].low / chart.rowSize)}${kind}`);
    }
    const share = taken > 0 ? made / taken : 0;
    if (share < needed) continue;
    marks.add({ low: rows[from].low, high: rows[to].high, color: color.withAlpha(STOPPED, 0.16), border: STOPPED });
    found = Math.max(found, share);
  }
  return found;
}