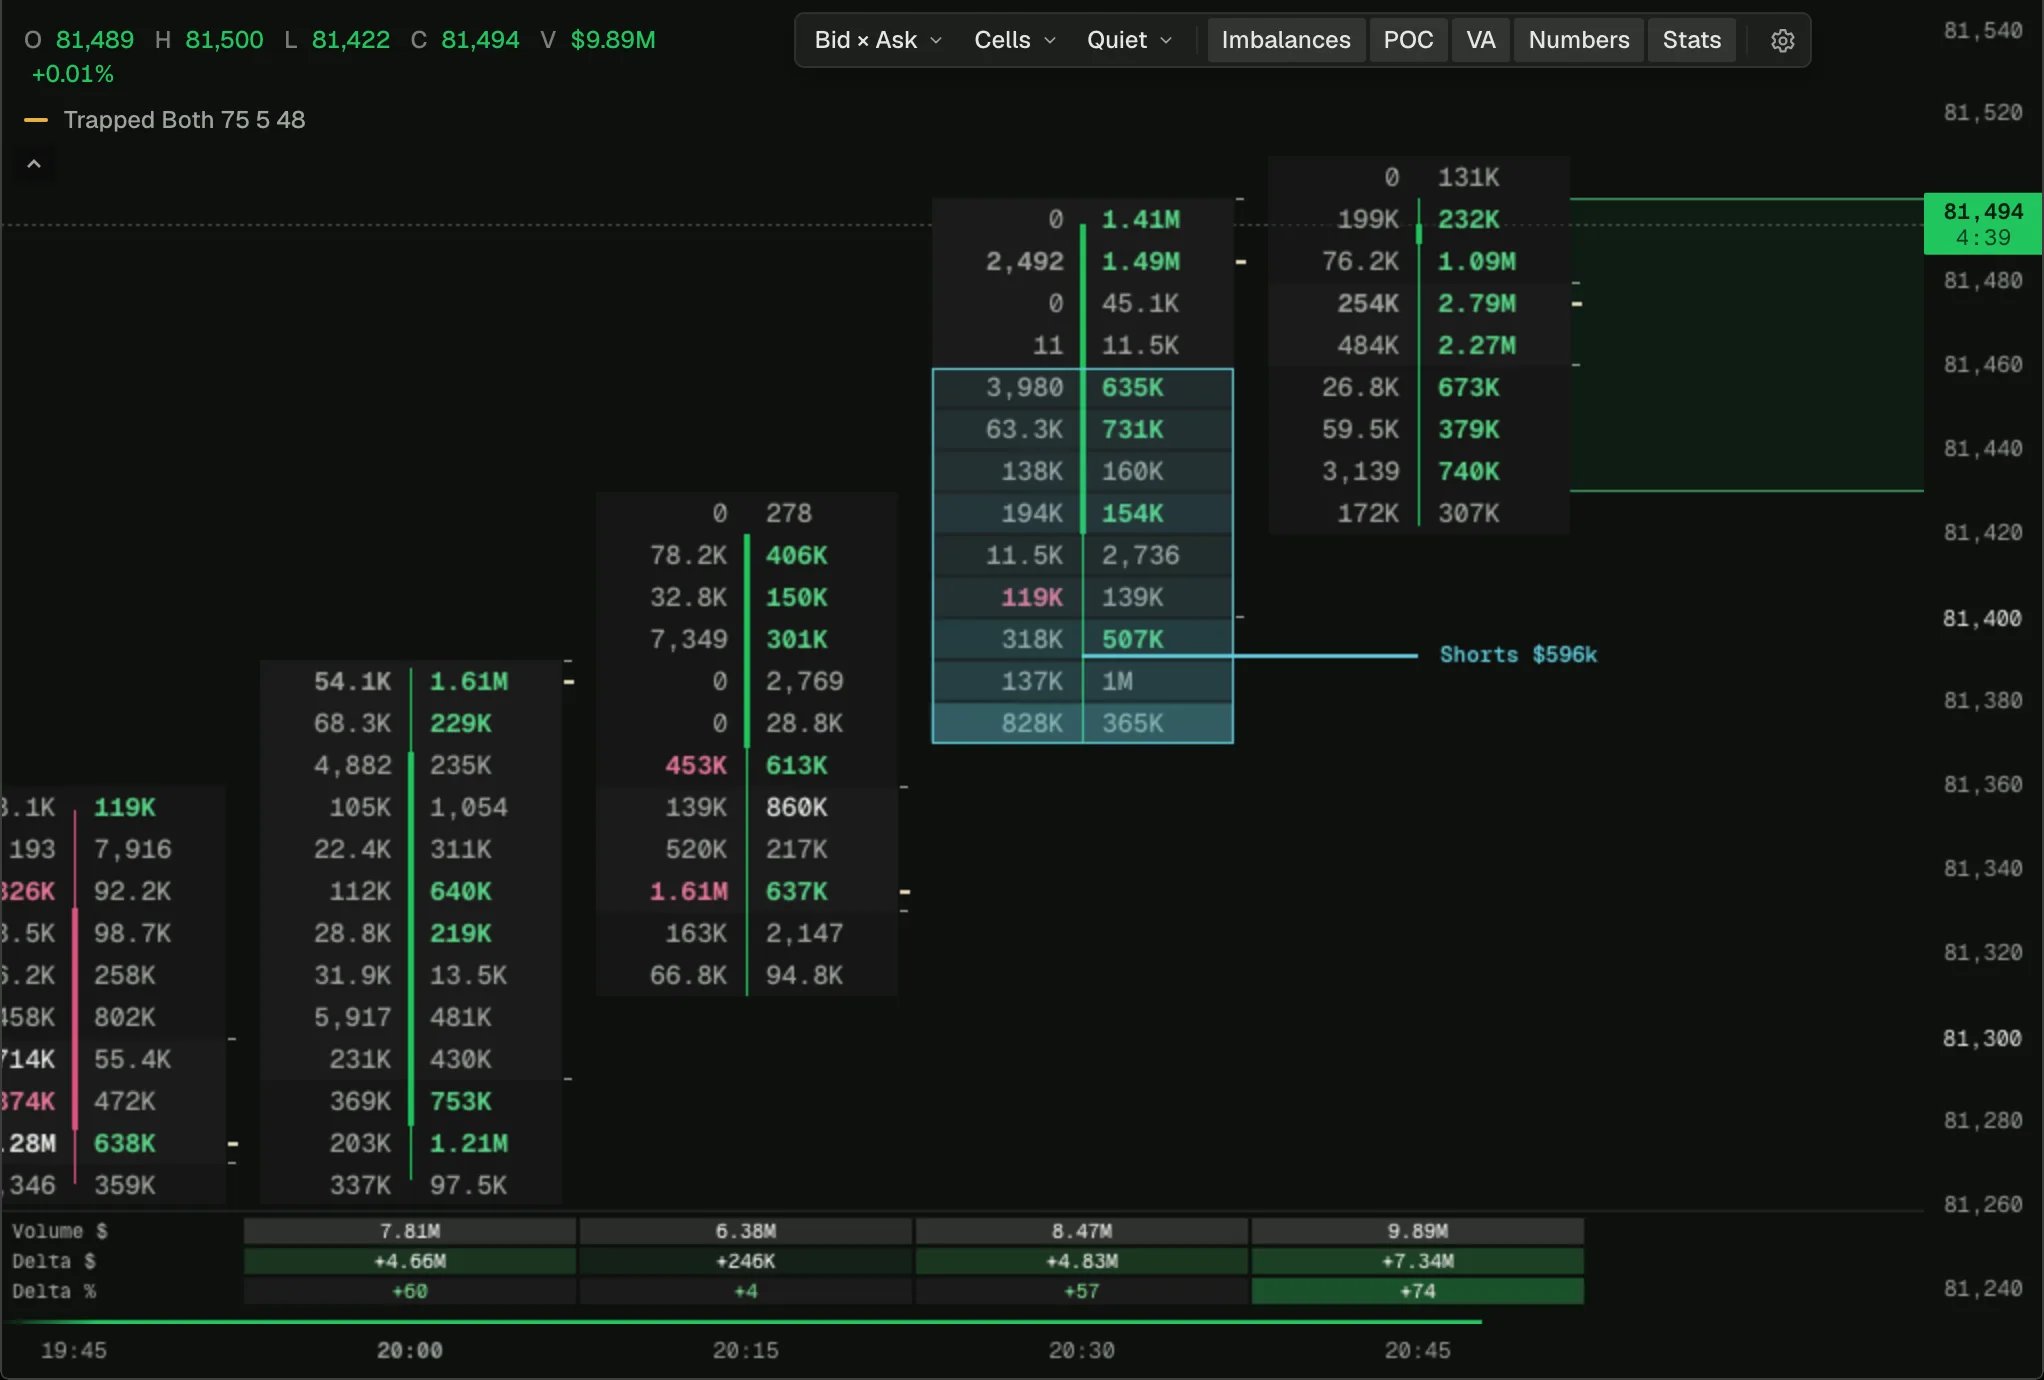
// Trapped traders: most of a bar's new longs opened above its point of control, and the bar closed
// back below it, so they are underwater at the close (shorts the other way round). Each fill's
// `takerWhy` says who opened, which a footprint alone cannot. The share is of the bar's own new
// longs, so a market where most buying opens longs is not trapped on every bar. The rows where they
// opened are tinted, deeper where more opened, leaving the footprint's numbers readable; a line at
// their average entry runs right until price trades back to it, where they get out flat, or until
// the watch ends, tagged with how much is trapped while it stands.
indicator('Trapped traders', { overlay: true, shortName: 'Trapped', maxLines: 100, maxLabels: 20 });

const side = input.choice('Side', 'both', ['longs', 'shorts', 'both'] as const, { labels: { longs: 'Trapped longs', shorts: 'Trapped shorts', both: 'Both' } });
const minShare = input.float('Share of the bar\'s new positions trapped (%)', 75, { min: 1, max: 100, tooltip: 'New longs opened wholly above the PoC row, as a share of all the bar\'s new longs (shorts below it, for shorts)' });
const minVolume = input.float('Trapped share of the bar\'s volume (%)', 5, { min: 0, max: 100, tooltip: 'So a quiet handful of new positions is not a trap' });
const watch = input.int('Watch the entry for (bars)', 48, { min: 1, max: 500 });

const chart = bars();
const tape = trades();
const profile = volumeProfile();
// New positions by row this bar: `<row>L` for longs, `<row>S` for shorts.
const opened = tallyBy(8192);

// The entries: the bar each formed on, its price, its USD (above 0 for longs), and the bar price came back to it (-1 while it stands).
const KEPT = 100;
const start = state.list<number>(KEPT);
const entry = state.list<number>(KEPT);
const size = state.list<number>(KEPT);
const end = state.list<number>(KEPT);

const marks = plot.cells('Trapped rows', { candles: 'overlay', scale: 'unit' });
const longsAlert = alert('Trapped longs', { message: 'New longs trapped above the PoC' });
const shortsAlert = alert('Trapped shorts', { message: 'New shorts trapped below the PoC' });

// The theme's orange and teal, which each theme sets to read on its own background.
const LONGS = color.study(8);
const SHORTS = color.study(11);

tape.onTrade((t) => {
  const row = Math.floor(t.price / chart.rowSize + 1e-9);
  // A flip opens the other way, so it counts as an open.
  if (t.takerWhy === 'open_long' || t.takerWhy === 'flip_sl') opened.add(`${row}L`, t.size);
  else if (t.takerWhy === 'open_short' || t.takerWhy === 'flip_ls') opened.add(`${row}S`, t.size);
});

// Longs get out flat once price trades back up to their entry; shorts once it trades down to theirs.
const reached = (i: number) => (size.get(i) > 0 ? chart.high >= entry.get(i) : chart.low <= entry.get(i));

chart.onBar(() => {
  if (chart.confirmed) {
    for (let i = 0; i < start.length; i += 1) {
      if (end.get(i) < 0 && (reached(i) || chart.index - start.get(i) >= watch)) end.set(i, chart.index);
    }
    trap();
  }
  if (chart.isLast) drawEntries();
});

/** This bar's new positions on the wrong side of its PoC, when they are enough. */
function trap() {
  if (!profile.available) return;
  const bar = profile.bar();
  const poc = bar.poc({ rowSize: chart.rowSize });
  if (poc === null || !(bar.total > 0)) return;
  const long = chart.close < poc.low;
  if (!long && chart.close < poc.high) return;
  if ((long && side === 'shorts') || (!long && side === 'longs')) return;
  const pocRow = Math.round(poc.low / chart.rowSize);
  const kind = long ? 'L' : 'S';
  let all = 0;
  let total = 0;
  let cost = 0;
  let deepest = 0;
  let lowest = Infinity;
  let highest = -Infinity;
  for (const [key, amount] of opened.entries()) {
    if (key.charAt(key.length - 1) !== kind) continue;
    all += amount;
    const row = Number(key.slice(0, -1));
    // Wholly on the wrong side of the PoC row.
    if (long ? row <= pocRow : row >= pocRow) continue;
    total += amount;
    cost += amount * (row + 0.5) * chart.rowSize;
    deepest = Math.max(deepest, amount);
    lowest = Math.min(lowest, row);
    highest = Math.max(highest, row);
  }
  if (total === 0 || total / all * 100 < minShare || total / bar.total * 100 < minVolume) return;

  const tone = long ? LONGS : SHORTS;
  for (const [key, amount] of opened.entries()) {
    const row = Number(key.slice(0, -1));
    if (key.charAt(key.length - 1) !== kind || (long ? row <= pocRow : row >= pocRow)) continue;
    marks.add({ low: row * chart.rowSize, high: (row + 1) * chart.rowSize, color: color.withAlpha(tone, 0.1 + 0.3 * amount / deepest), border: null });
  }
  // One outline around where they opened, so the span reads on any footprint shading.
  marks.add({ low: lowest * chart.rowSize, high: (highest + 1) * chart.rowSize, weight: 0, color: null, border: tone });
  const price = cost / total;
  if (start.length === KEPT) for (const list of [start, entry, size, end]) list.shift();
  start.push(chart.index);
  entry.push(price);
  size.push(long ? cost : -cost);
  end.push(-1);
  if (long) longsAlert.fire(true, `New longs trapped above the PoC: ${fmt.usd(cost)} at ${fmt.price(price)}`);
  else shortsAlert.fire(true, `New shorts trapped below the PoC: ${fmt.usd(cost)} at ${fmt.price(price)}`);
}

/** Every entry as a line from its bar; the ones still standing carry a tag with how much is trapped. */
function drawEntries() {
  for (let i = 0; i < start.length; i += 1) {
    const standing = end.get(i) < 0;
    const tone = size.get(i) > 0 ? LONGS : SHORTS;
    const to = standing ? chart.index : end.get(i);
    draw.line({ from: { bar: start.get(i), price: entry.get(i) }, to: { bar: to, price: entry.get(i) }, color: color.withAlpha(tone, standing ? 1 : 0.5), width: standing ? 2 : 1, style: standing ? 'solid' : 'dashed' });
    if (standing) draw.label({ at: { bar: chart.index, price: entry.get(i) }, text: `${size.get(i) > 0 ? 'Longs' : 'Shorts'} ${fmt.usd(Math.abs(size.get(i)))}`, style: 'left', color: color.panel, textColor: tone, size: 'small' });
  }
}