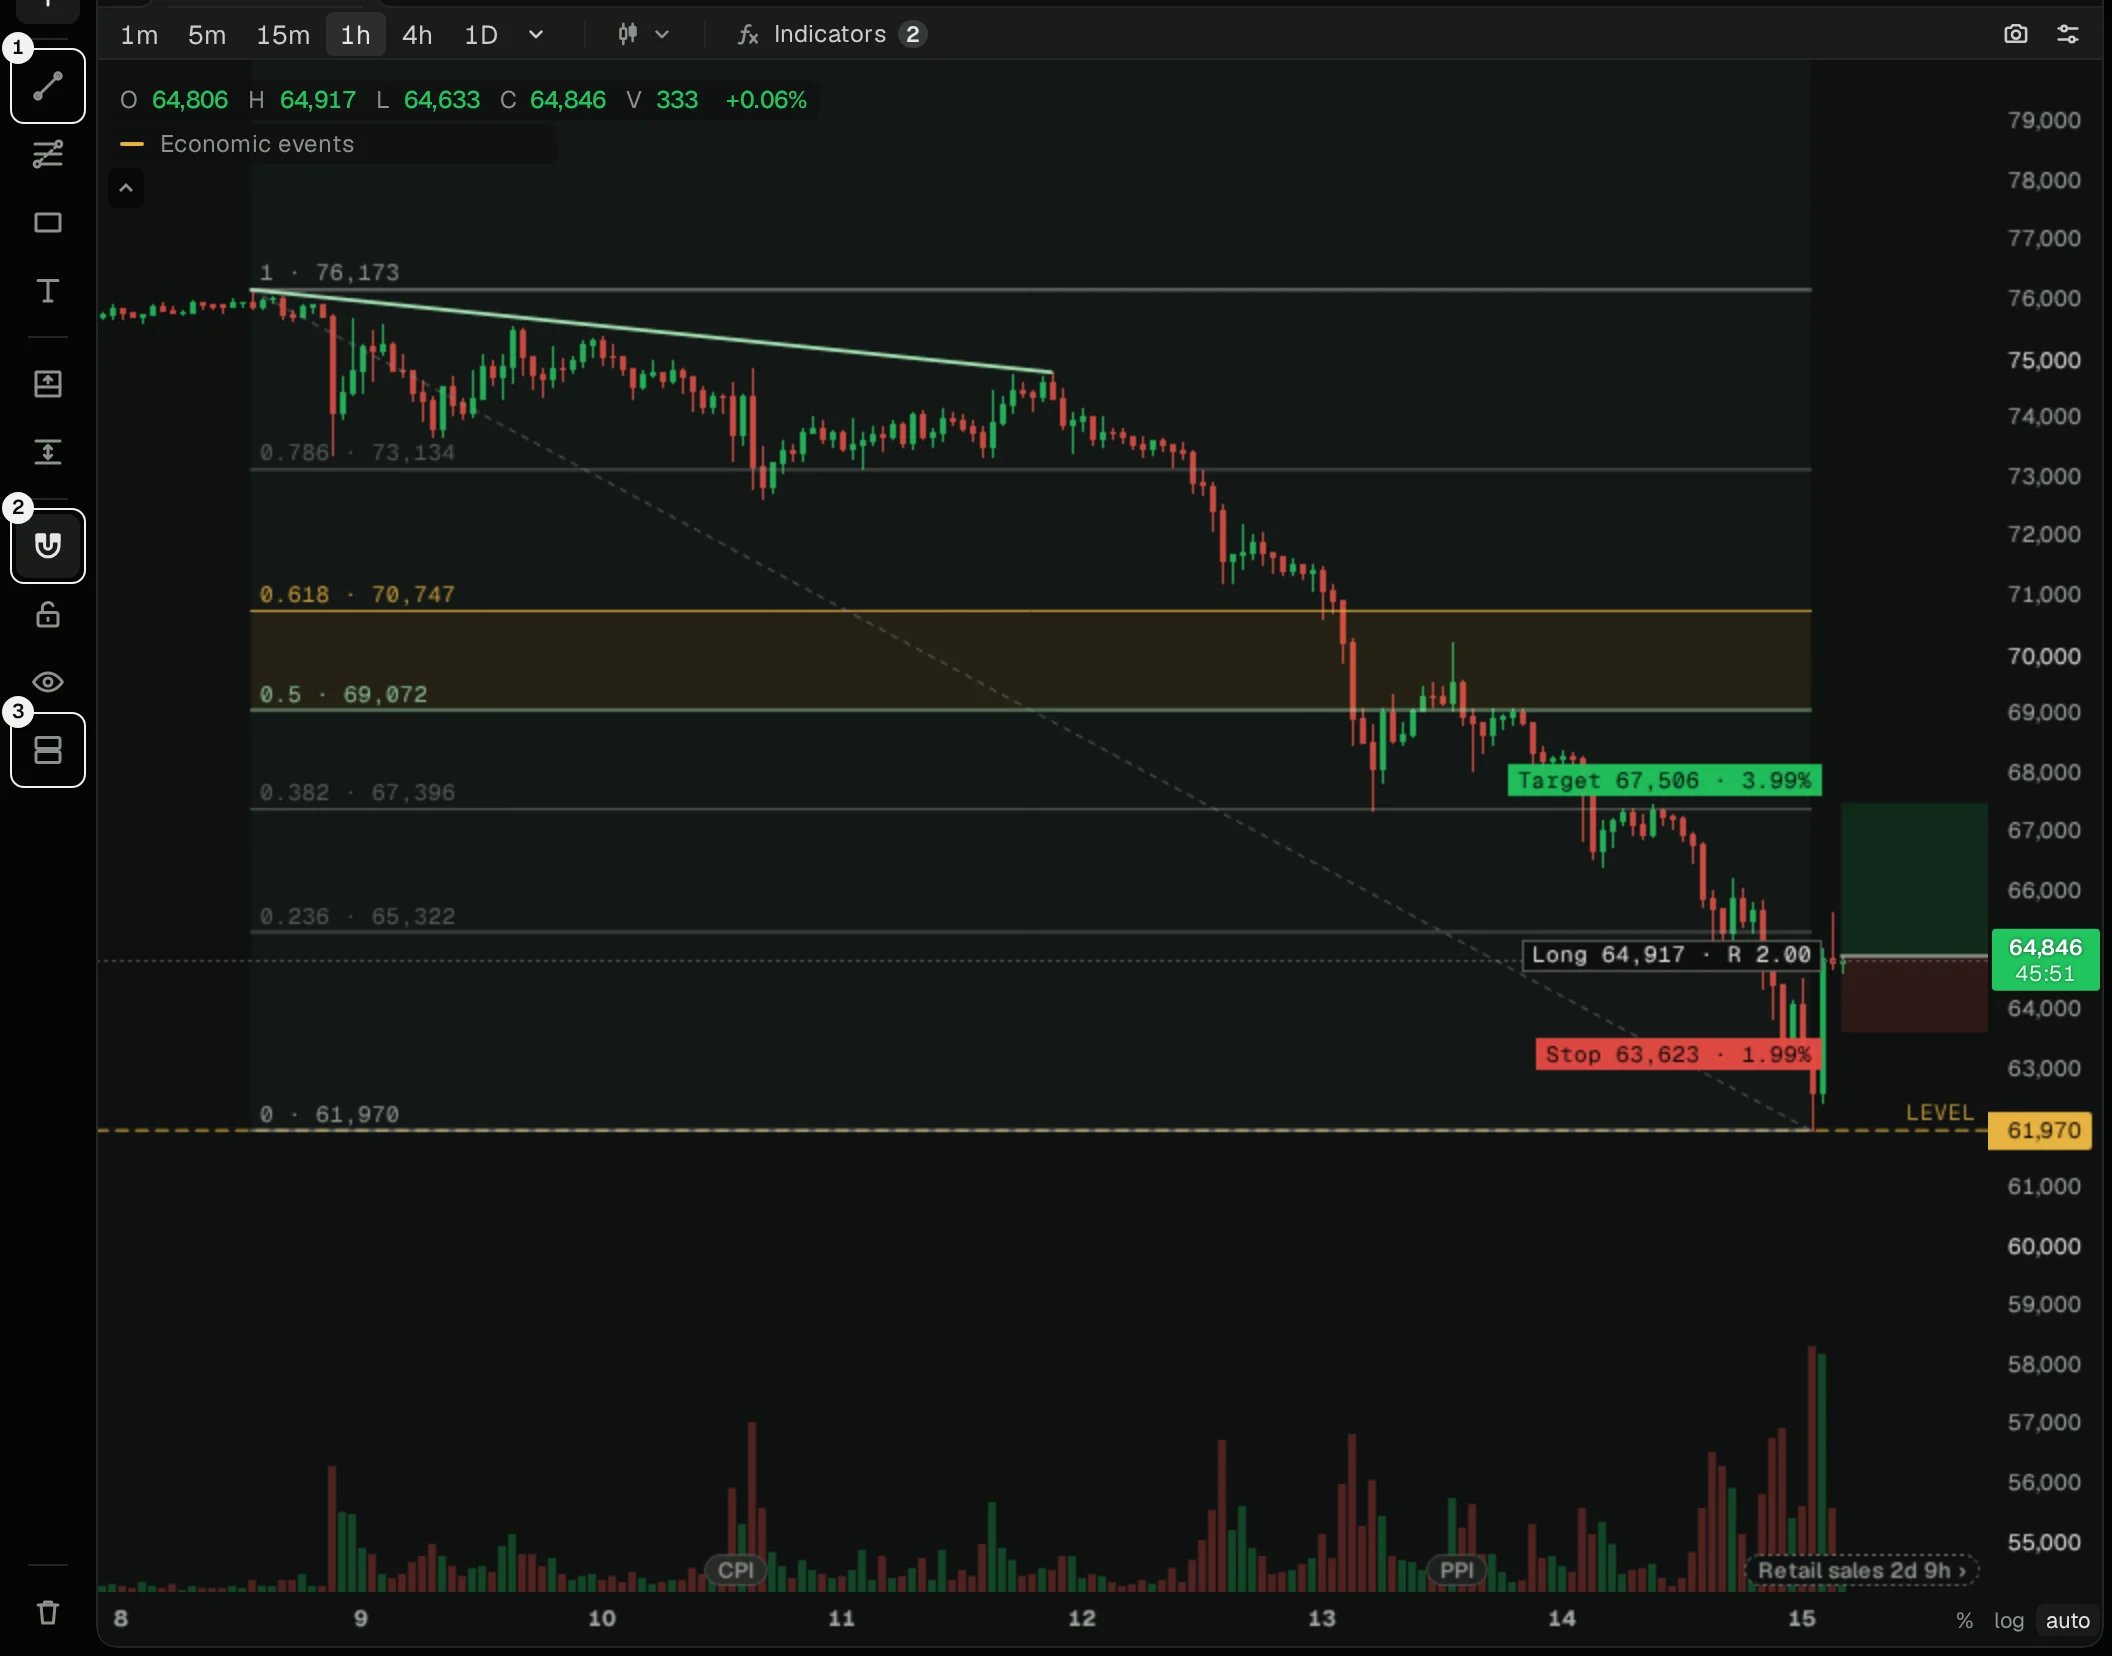
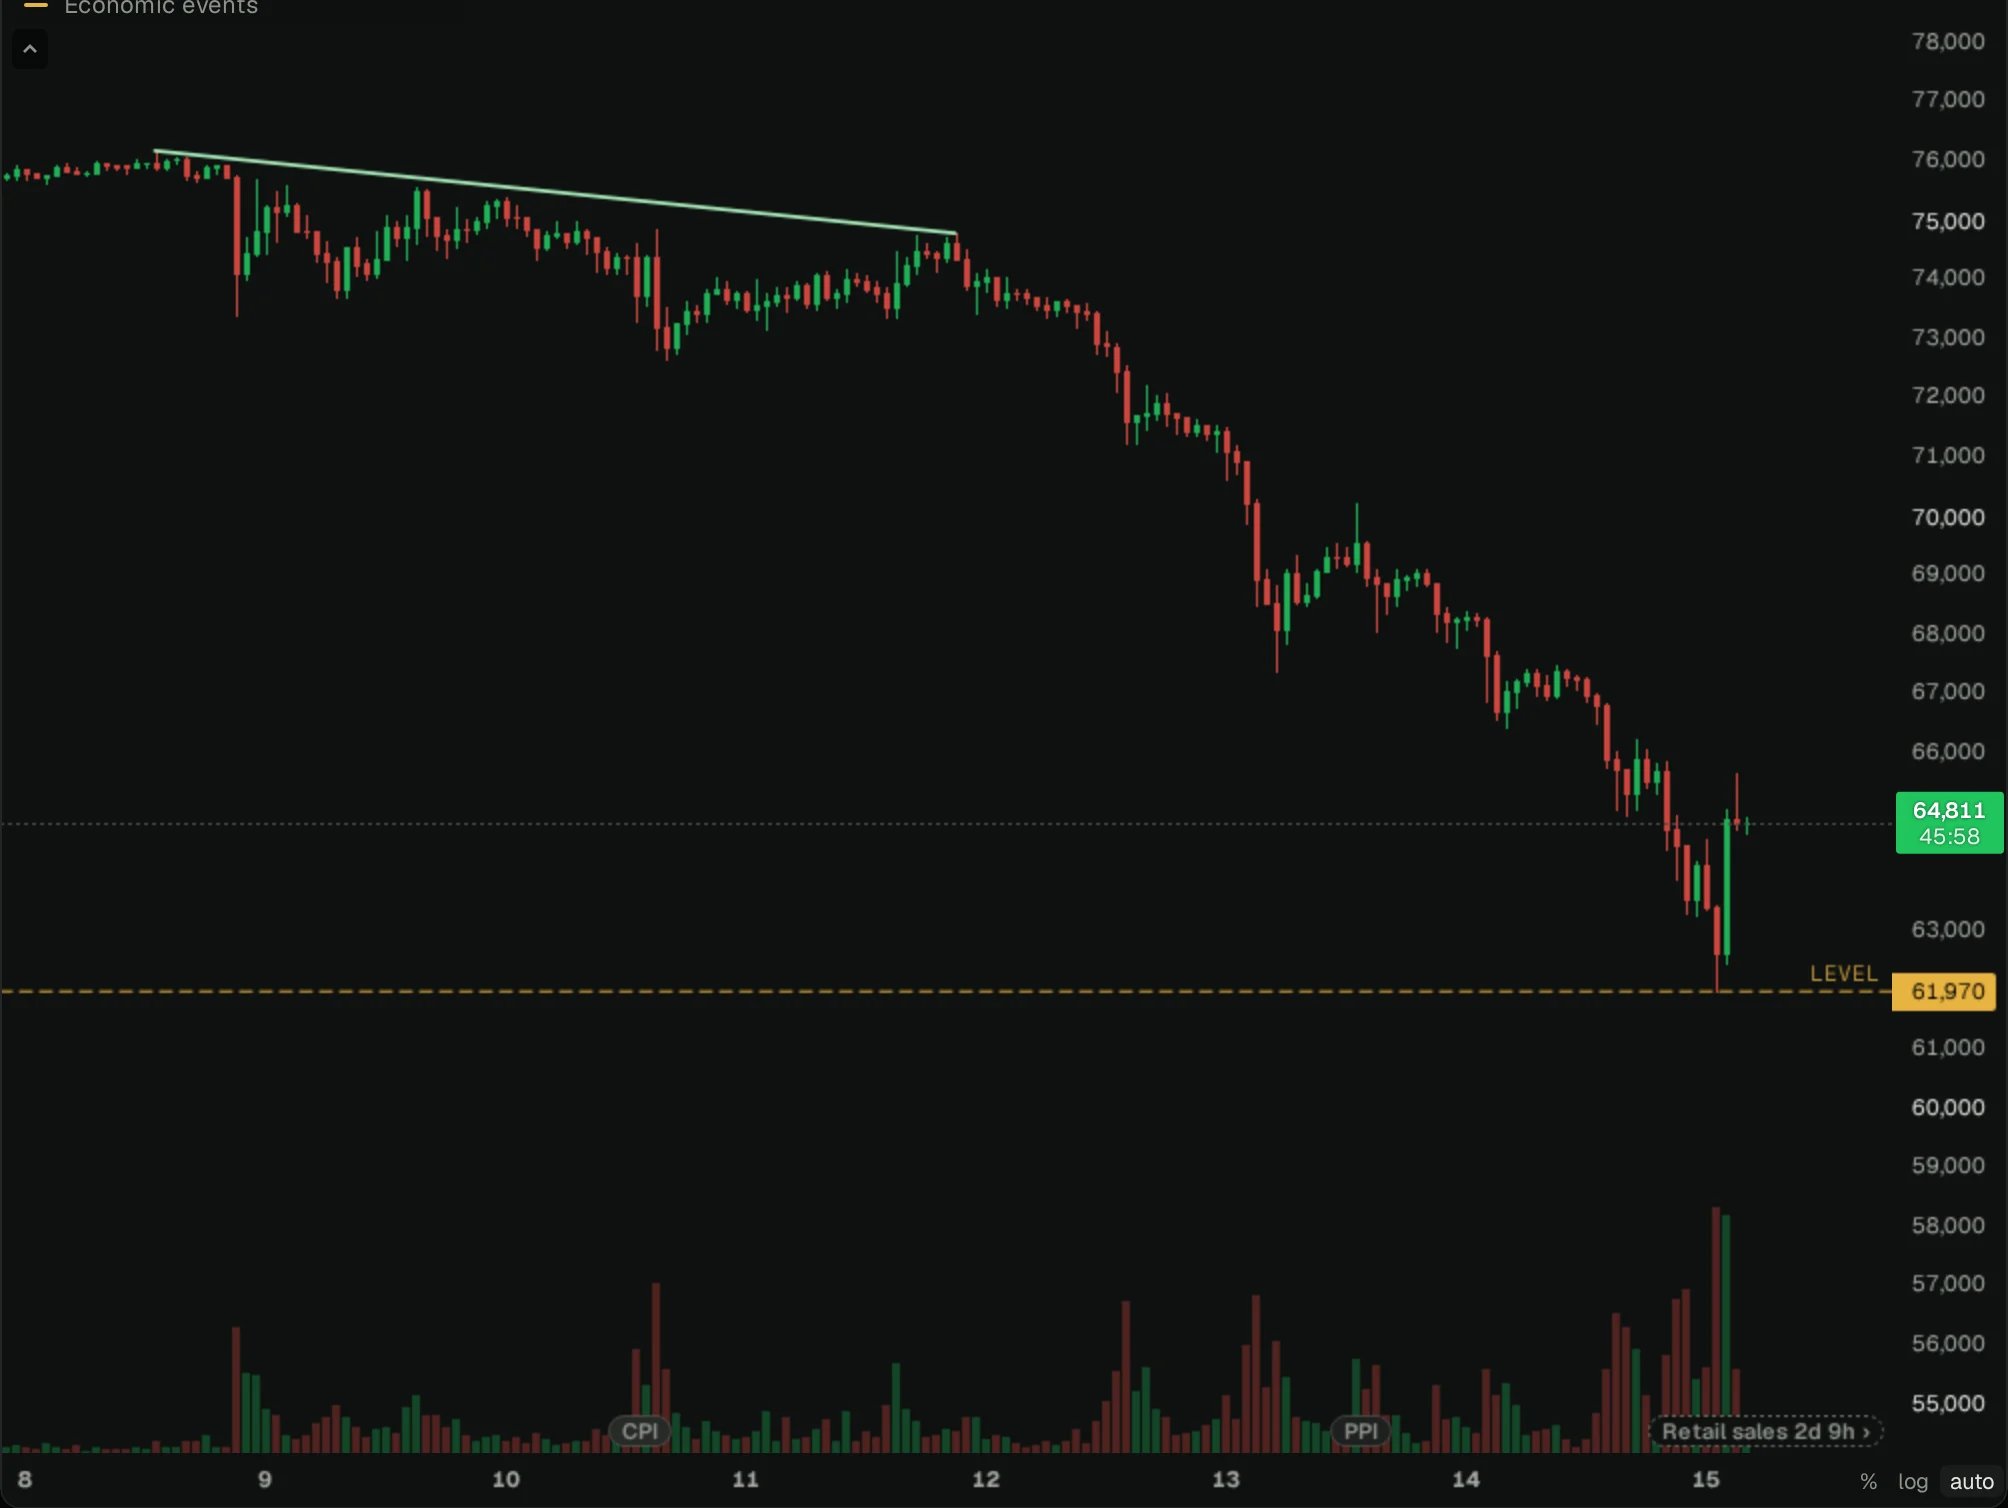
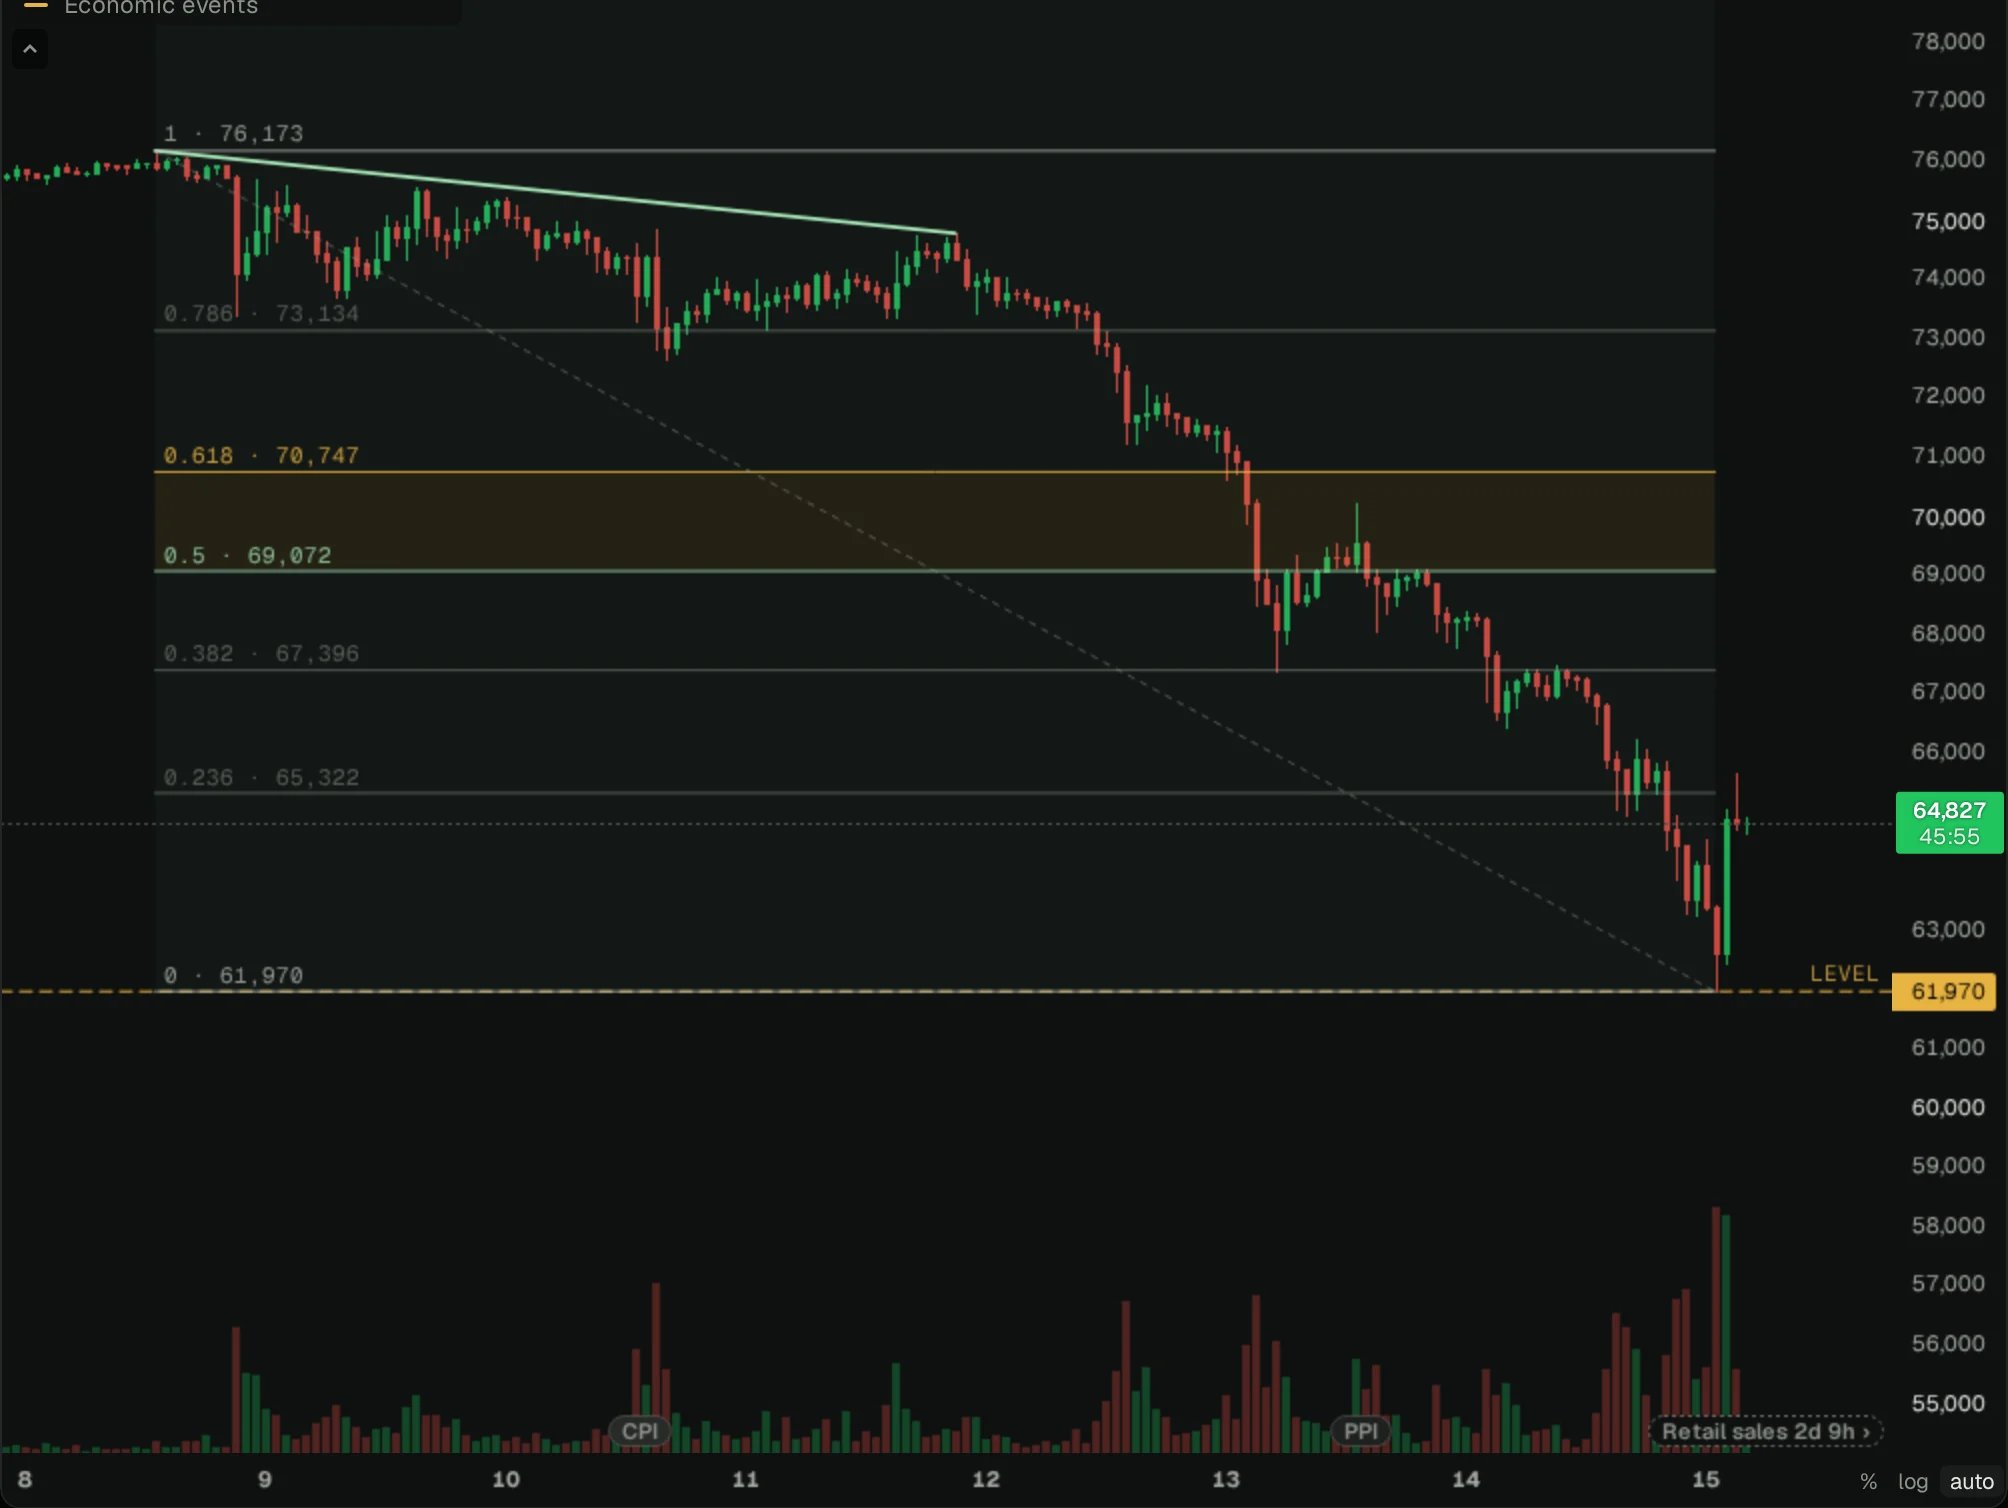
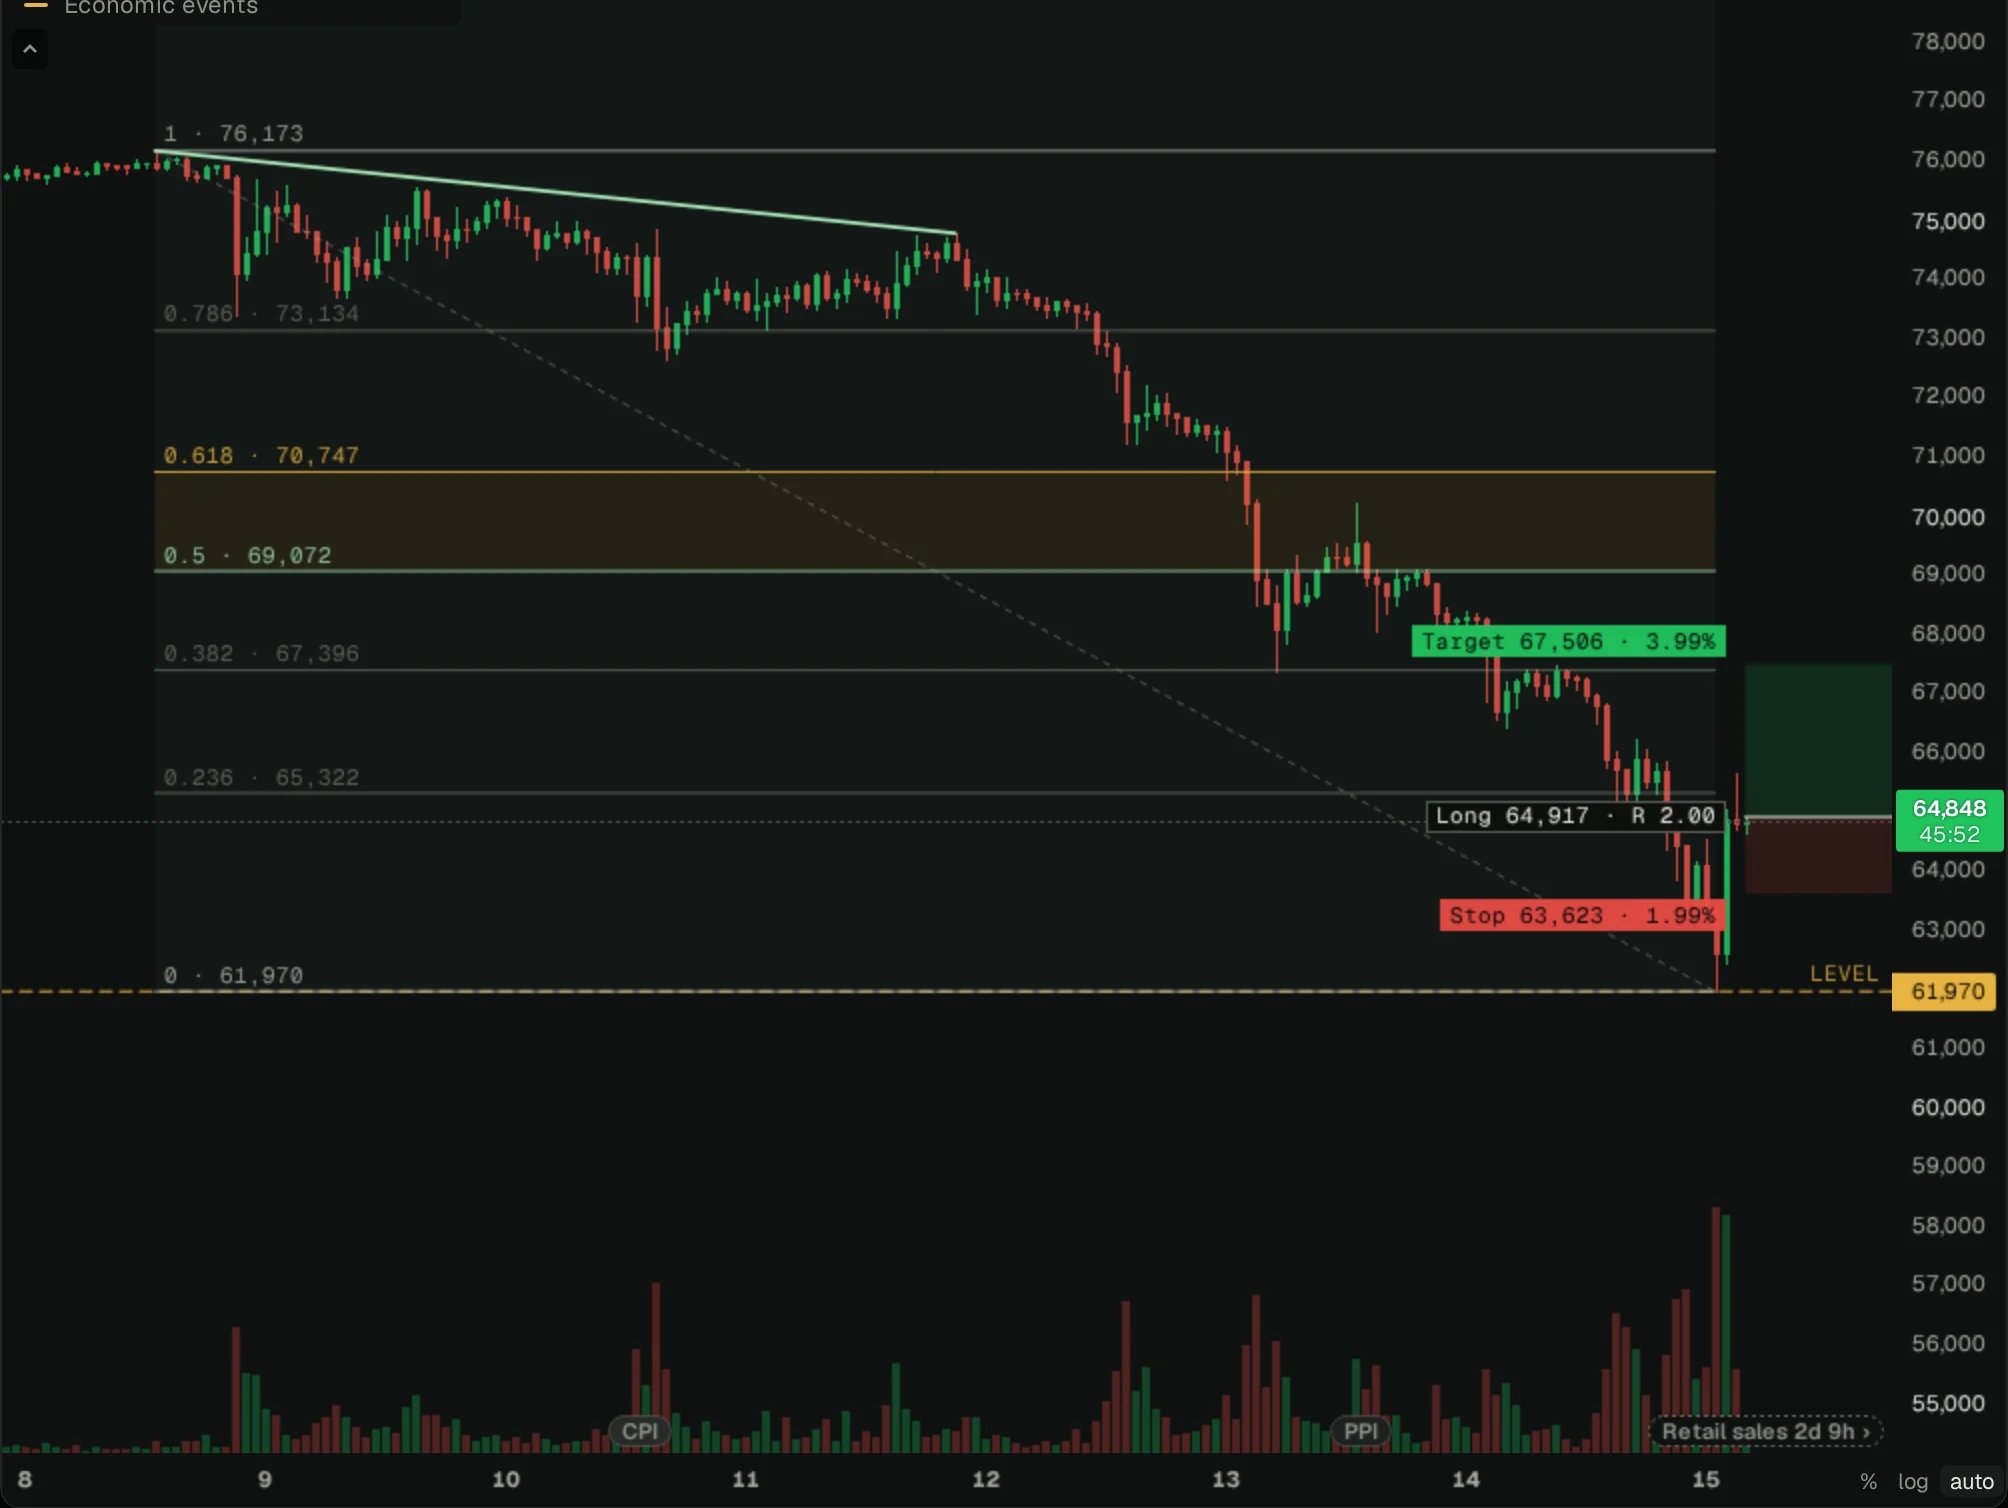
BTC hourly: a level on the low, a trend line along the highs, a retracement of the fall and a planned long.
- The tool groups: lines, Fibonacci, shapes, text, positions and measures.
- The magnet: snaps each point to a bar’s open, high, low or close.
- The drawing list: every drawing on the chart, to find, hide or remove.
1. Pick a tool
Each group’s button picks the tool you used last in it. The arrow beside it opens the whole group.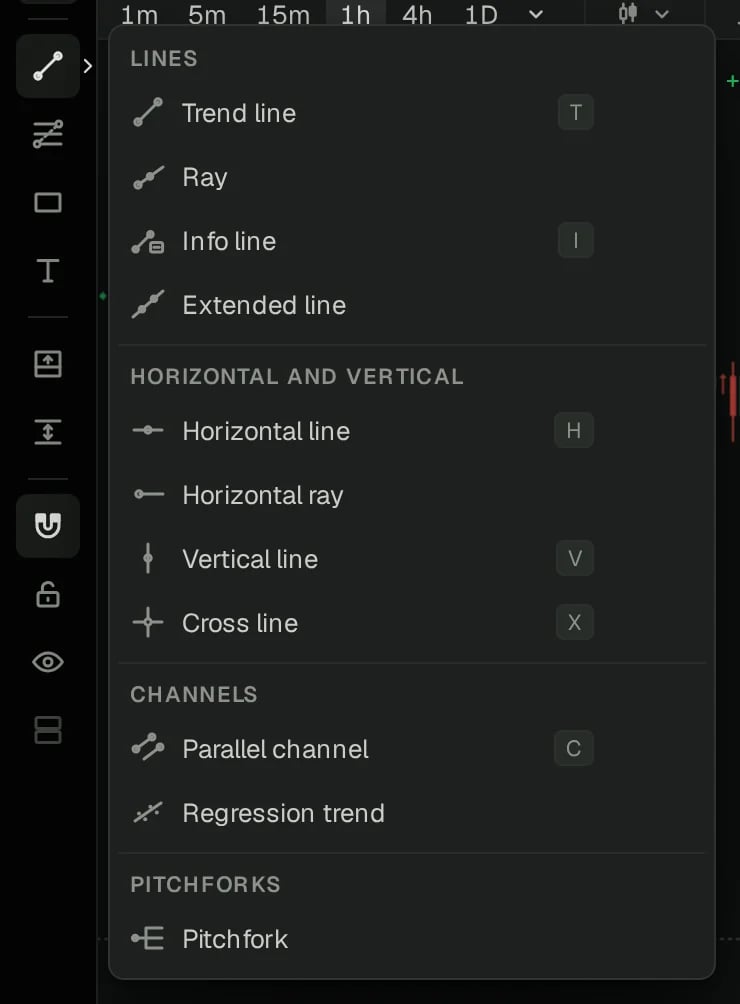
The button at the top of the rail is the pointer: a cross, a dot, an arrow, or the eraser, which deletes a drawing you click. Escape puts a tool down.
2. Turn on the magnet
The magnet makes each click land on a real price instead of empty space.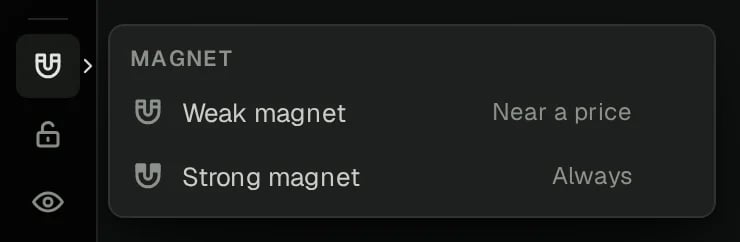
- Weak snaps a point to the bar’s open, high, low or close when you click near one.
- Strong always snaps to the nearest of the four. Click above a candle and the point lands on its high.
- Hold ⌘ while you draw to flip it for one drawing: on if it’s off, off if it’s on.
3. Draw your levels
Every drawing below was made with the strong magnet on, so each point sits on a bar’s high or low.- Level
- Trend line
- Fibonacci
- Long position
Horizontal line (H): one click. Here it sits on the low of the fall, the price to watch if BTC comes back down.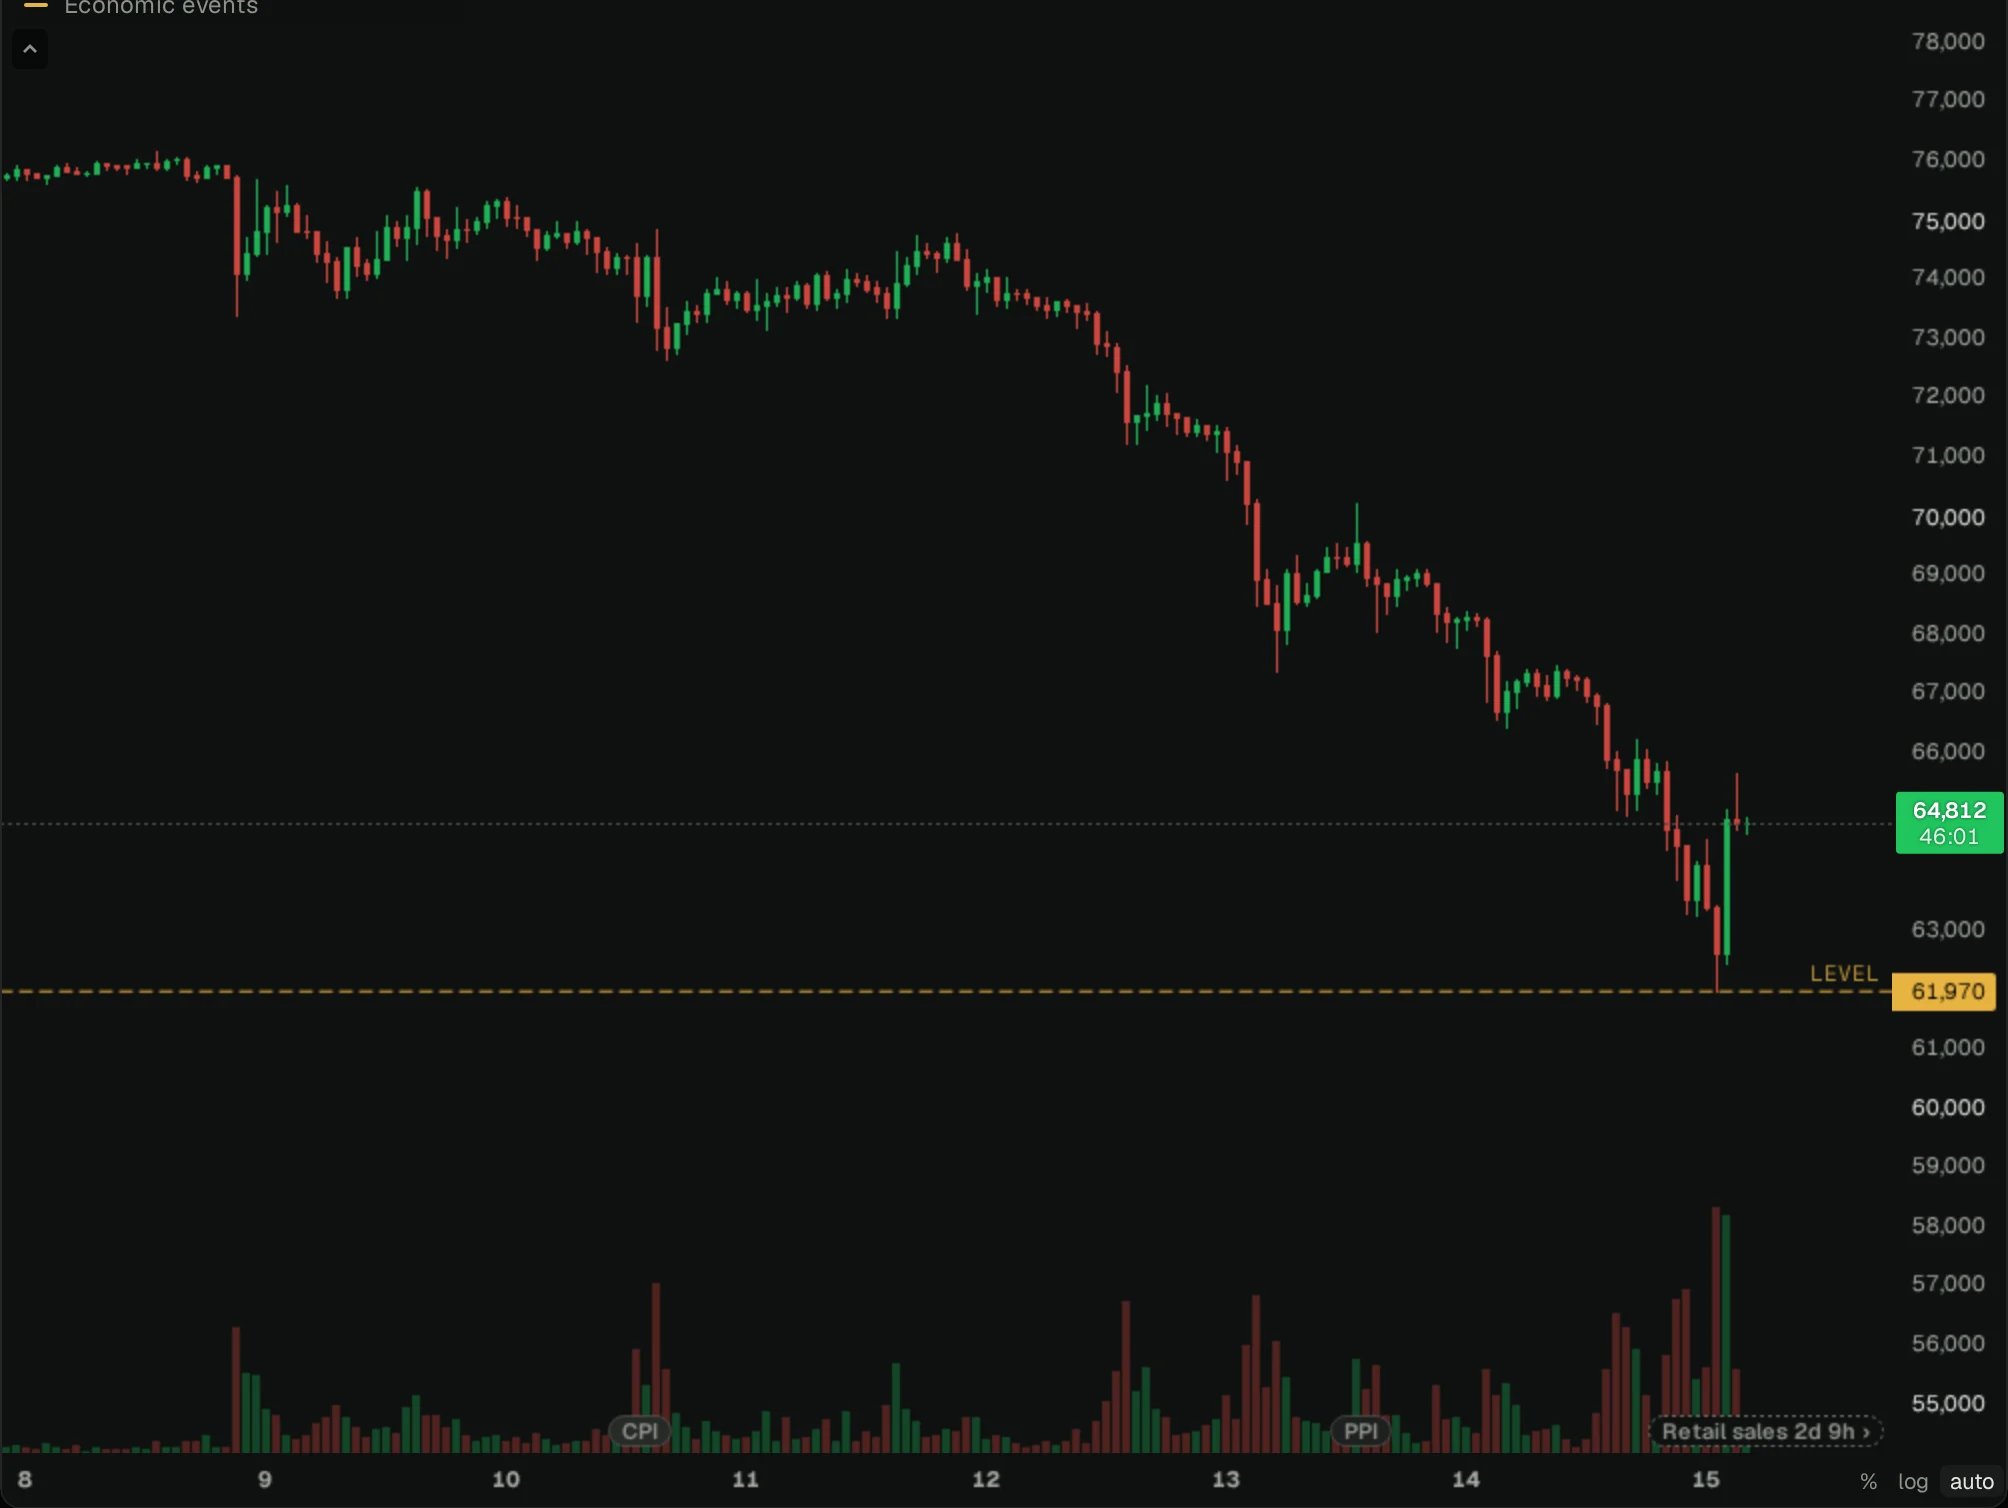
4. Style a drawing
Click a drawing to select it. A bar of tools appears beside it.
- Price: type a horizontal line’s exact price.
- Colour, width and line style change it in place.
- Settings (or double-click the drawing) opens everything else: its text, its exact points and the timeframes it shows on.
- Copy, lock and delete: a locked drawing can’t be moved by accident.
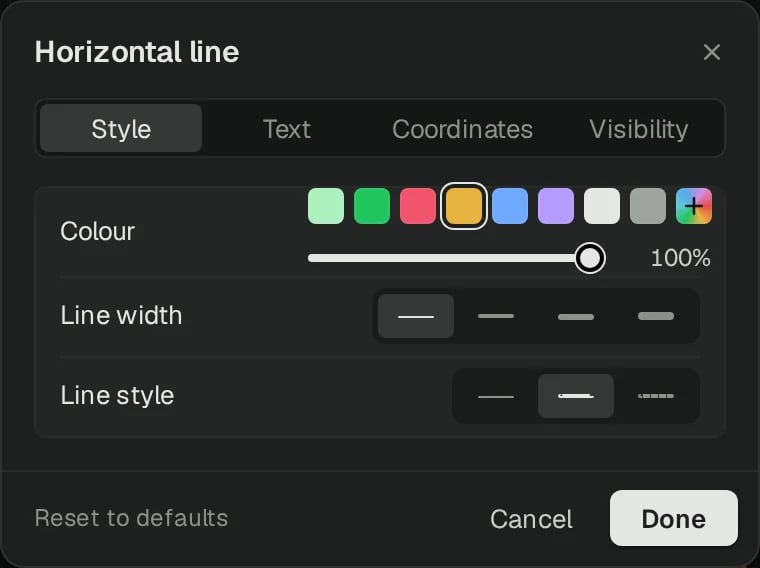
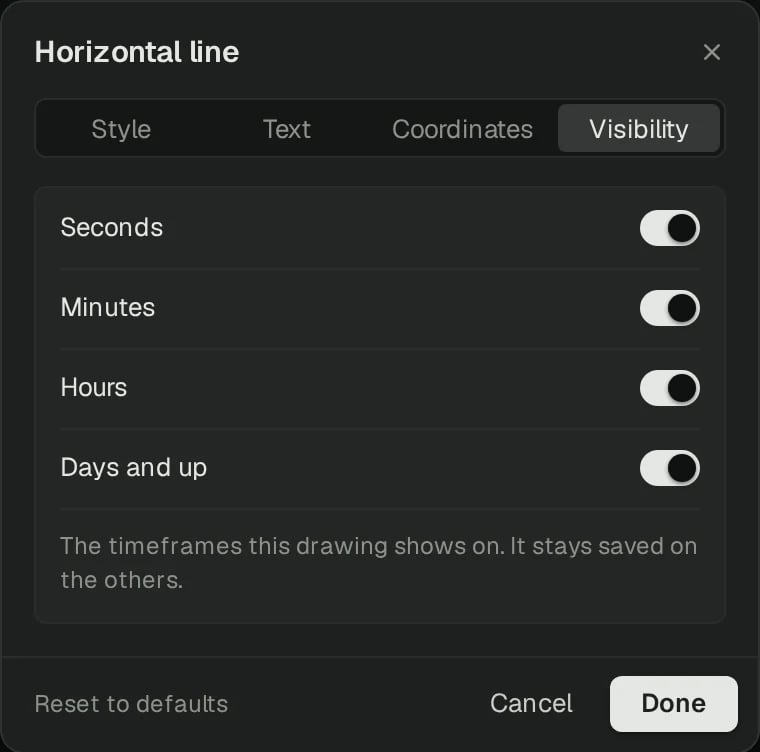
5. Find, hide and remove drawings
The lower half of the rail acts on every drawing at once.- Lock all drawings: the padlock. Nothing on the chart moves until you unlock it.
- Hide: the eye. Hide drawings, indicators, or both, for a clean look at the bars.
- Drawings: the list of every drawing on this chart, with its price. Click one to select it. Each row can also hide, lock or delete its drawing.
- Remove: the bin at the bottom. Delete the selected drawing (Del), or remove all of them.
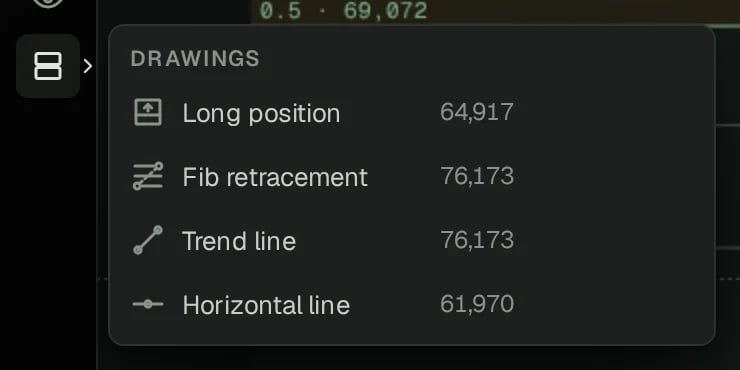
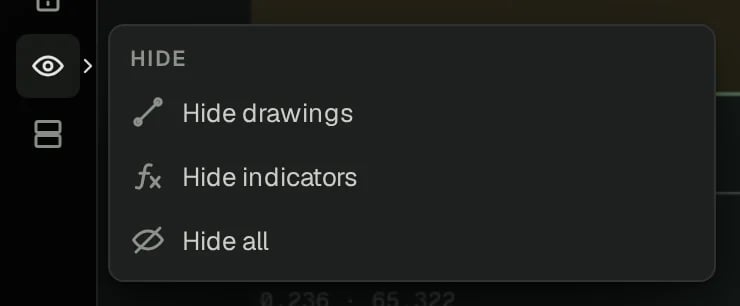
6. Keep your favourite tools close
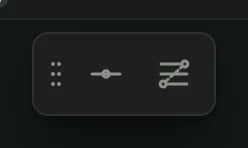
In any group, the star beside a tool adds it to a small bar of favourites that floats over the chart. Drag the bar by its grip to put it where your hand is.