

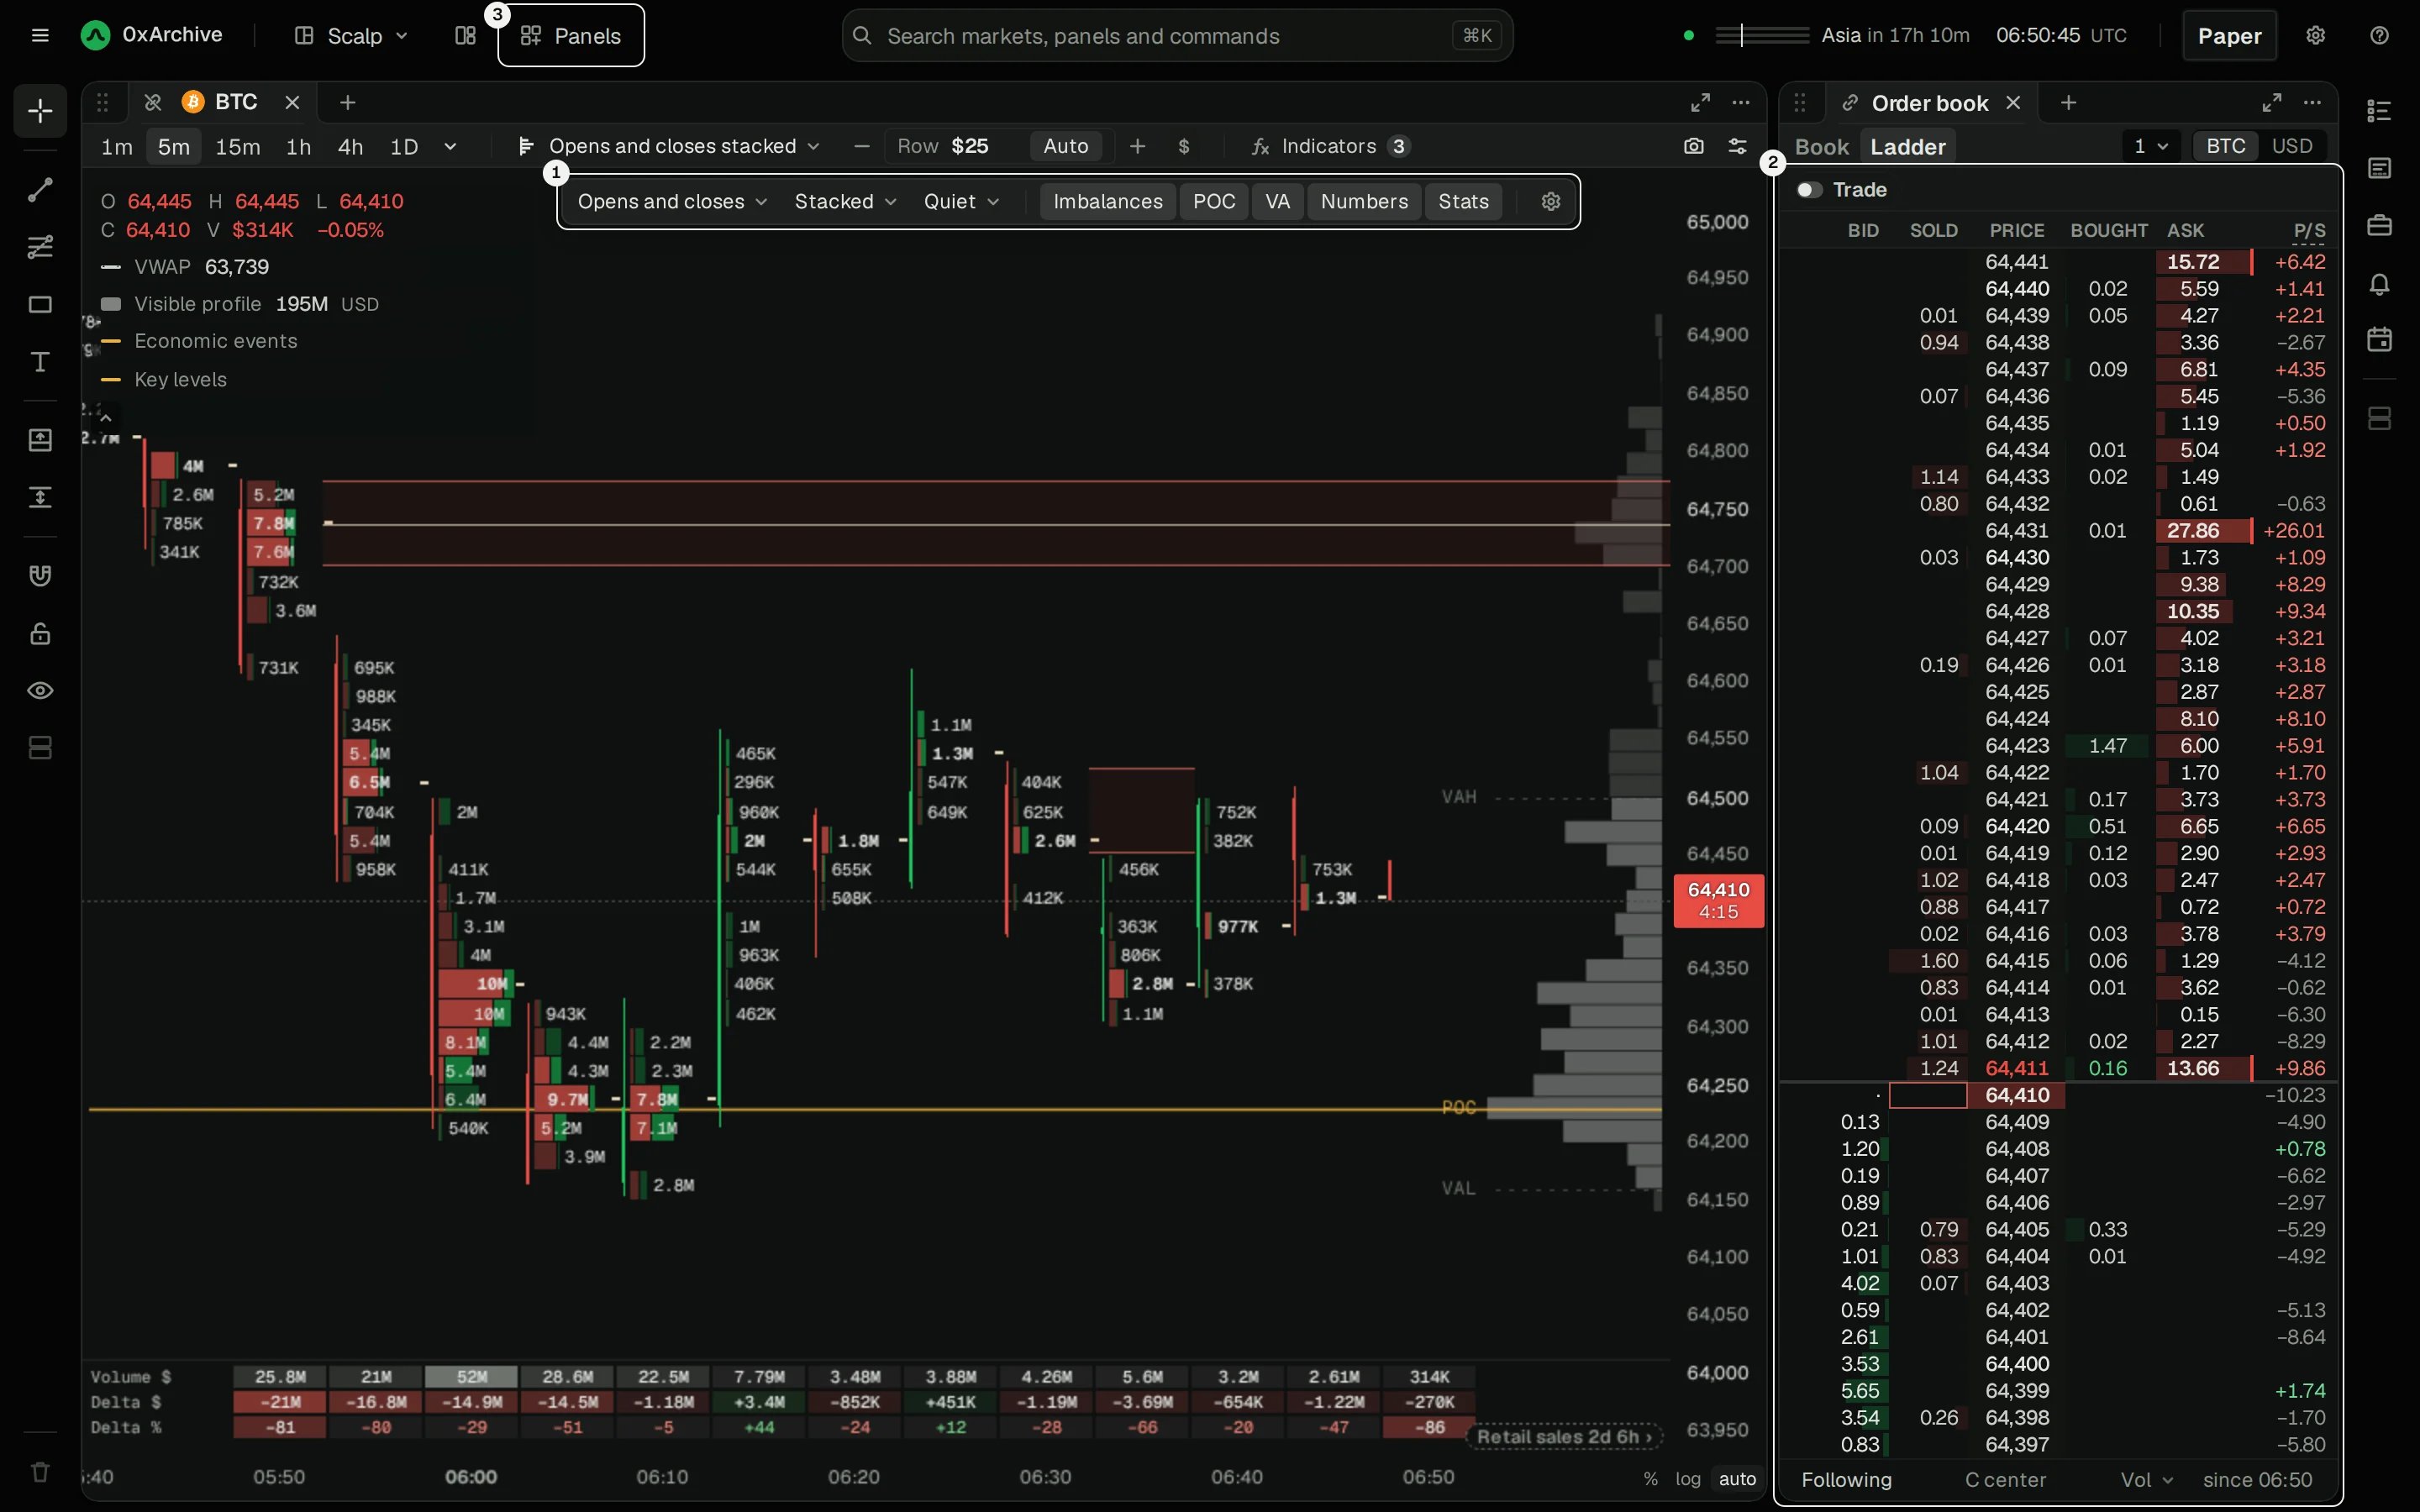
The Scalp view: BTC's 5-minute footprint of opens and closes, beside the ladder.
- The footprint: every 5-minute bar split by price, showing who opened and who closed there. Its own controls sit over the chart.
- The ladder: the book and the trades at each price, where you can trade from.
- Panels: the Trades tape, Wallet flow and the Order-flow regime are a click away in the Panels list, under Order flow.
1. Read the footprint
Each bar of the footprint is a column of rows, one per price. Scalp opens it on Opens and closes, data only 0xArchive has: for every trade at a price, whether the taker opened a new position or closed one.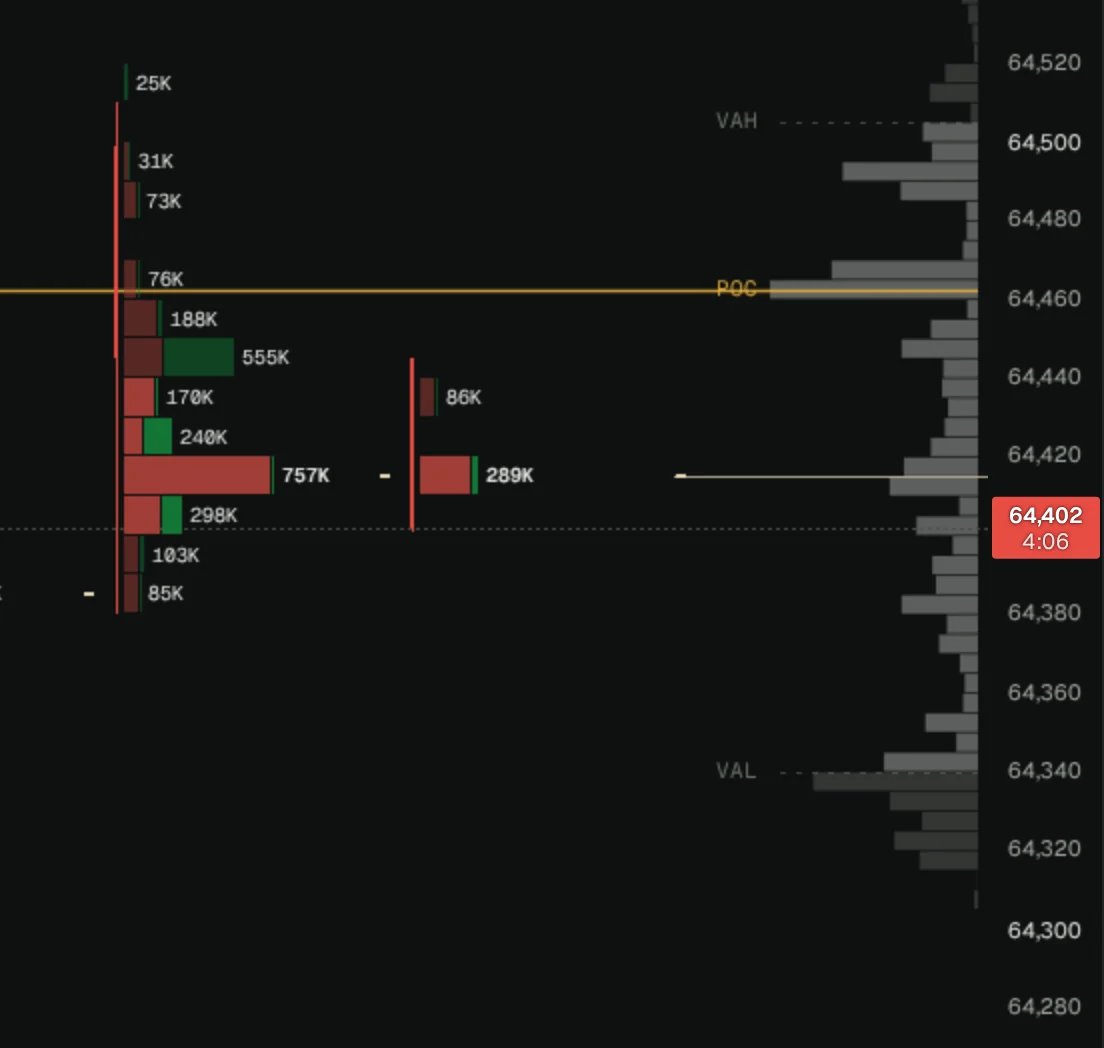
- New shorts: sellers opening a short.
- Longs closing: sellers getting out of a long, at a profit or a stop.
- Shorts closing: buyers getting out of a short.
- New longs: buyers opening a long.

- Imbalances: where new shorts are 3x new longs at a price, or the other way. Three or more such prices in a row draw a band, which runs right until price trades back into it.
- POC: the price each bar traded most at, marked with a short notch. Scalp also draws a line from each POC until a later bar trades there: an untested price, often revisited.
- VA: the value area, where 70% of each bar’s volume traded. In Stacked and Profile, rows outside it are dimmed.
- Numbers: each row’s total, where the rows are tall enough to fit it.
- Stats: the statistics under each bar (step 2).
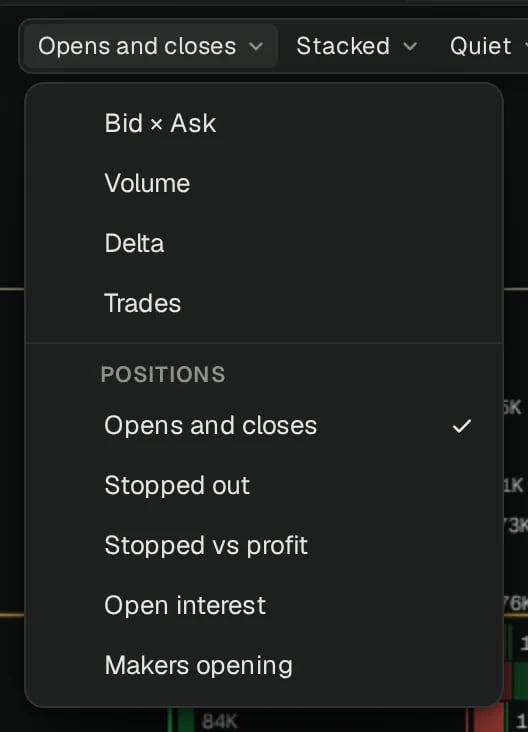
The Positions data is Hyperliquid’s: Lighter’s trades don’t say who opened or closed. With Bid × Ask, an imbalance compares a price’s buying with the selling one row below it, the usual diagonal read.
The next two menus set how a row is drawn (Cells with numbers, Profile bars or Stacked) and coloured (Quiet keeps numbers in ink and only imbalances in colour; Size shades by how much traded; Side by the side that traded more).
2. Read the bar statistics
Under the bars, a strip sums each one up.
- Volume: everything traded in the bar.
- Delta: bought less sold. Positive is green, negative red.
- Delta %: delta as a share of the volume. −81 means sellers took 90% of the bar.
3. Read the ladder
The ladder is the book drawn on a fixed column of prices, with the trades at each price beside it. It stays centred on the price as it moves.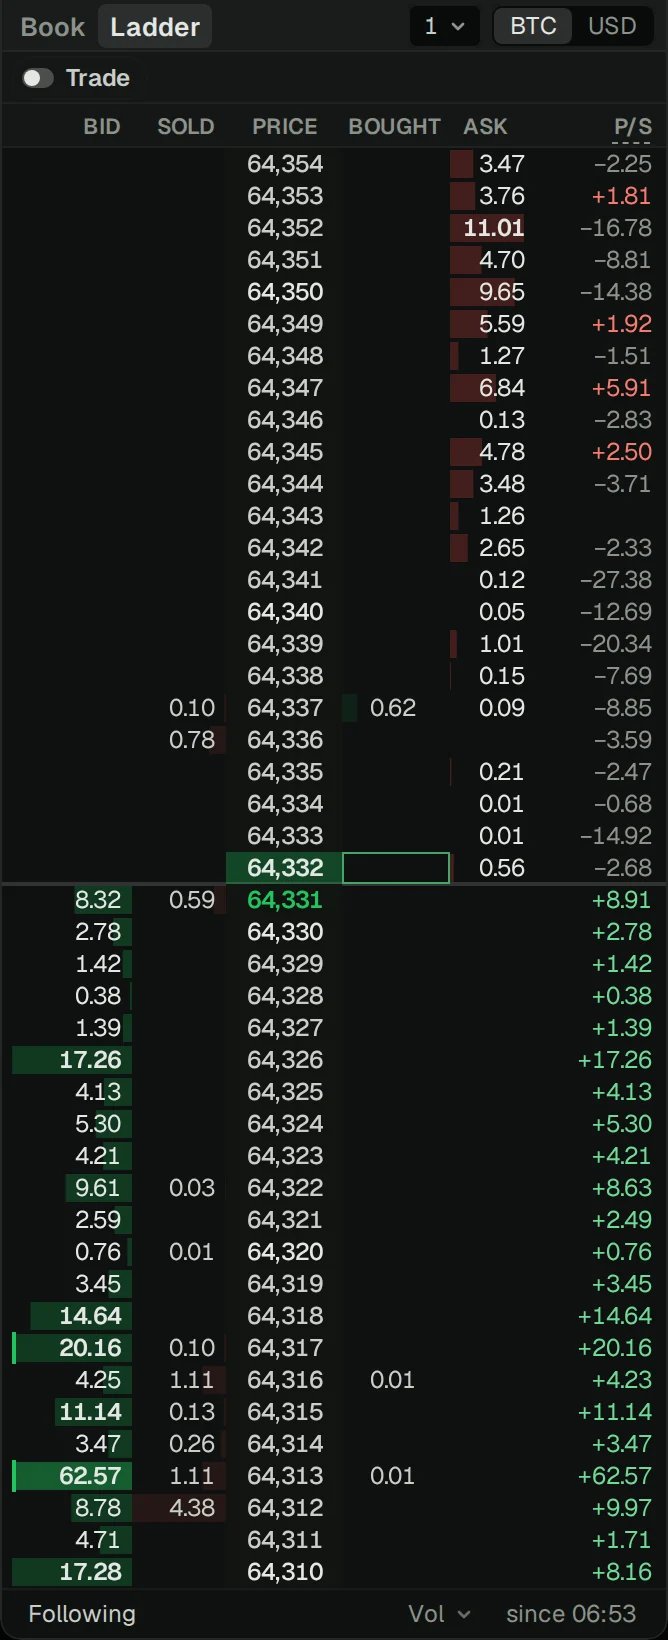
- Bid and Ask: the size resting at each price, with bars on one scale. A bold size is at least 3x a typical level: a wall.
- Sold and Bought: what takers sold into the bid or bought from the ask there. Fresh prints flash bright, and the last one is outlined.
- P/S: size pulled (−) or stacked (+) at a price in the last 10 seconds, with fills taken out. A wall that shrinks with no trades was pulled, not hit.
- Following says the ladder is keeping the price in view. It pauses while your pointer is over it. Press C to centre it again, and − and = to group prices finer or coarser.
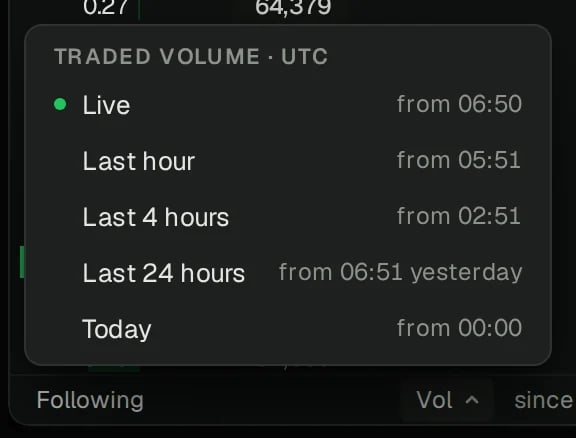
- Vol picks how far back Sold and Bought count: live, the last hour, 4 hours, 24 hours or today.
- since shows when the live count started. Click it to start again.
4. Read the book
Book, beside Ladder, shows the same orders as a list: the asks above, the bids below, and the spread between.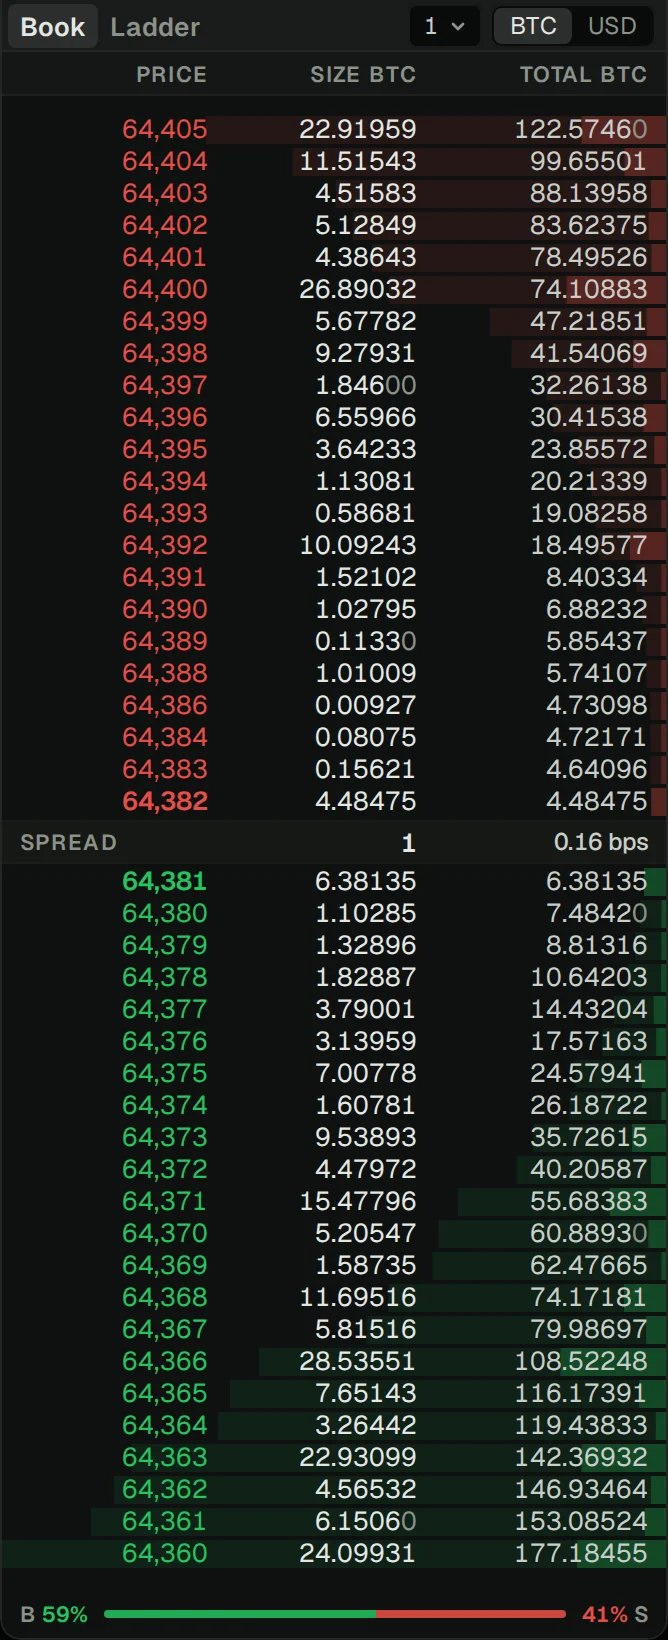
5. Read the tape
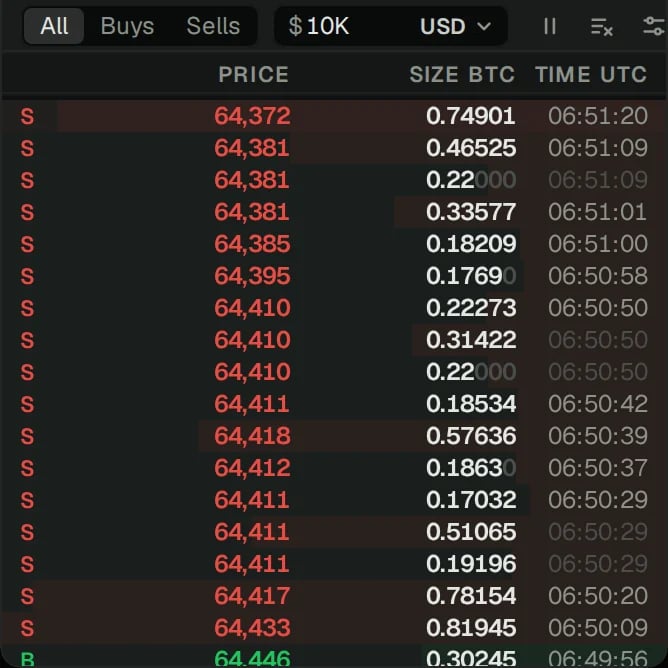
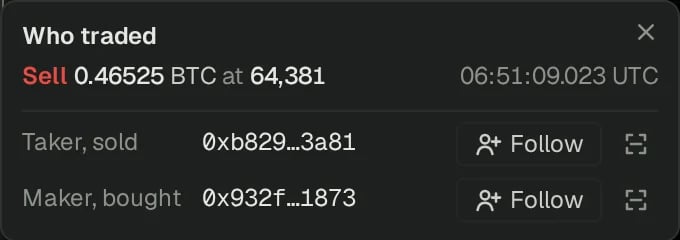
Add Trades from the Panels list (⌥⇧T). It prints every trade as it happens: B for a taker buy, S for a sell. Most prints are small, so filter it. The Any menu sets a minimum, in dollars or coin: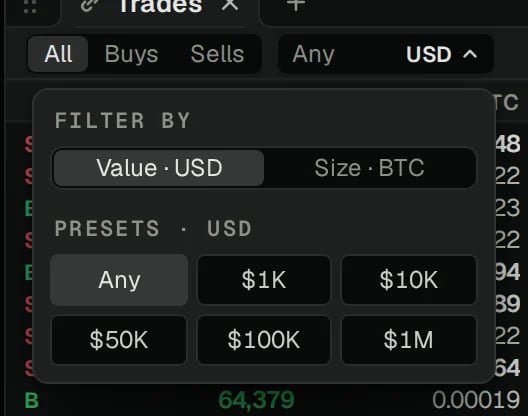
6. Find wallets working a big order
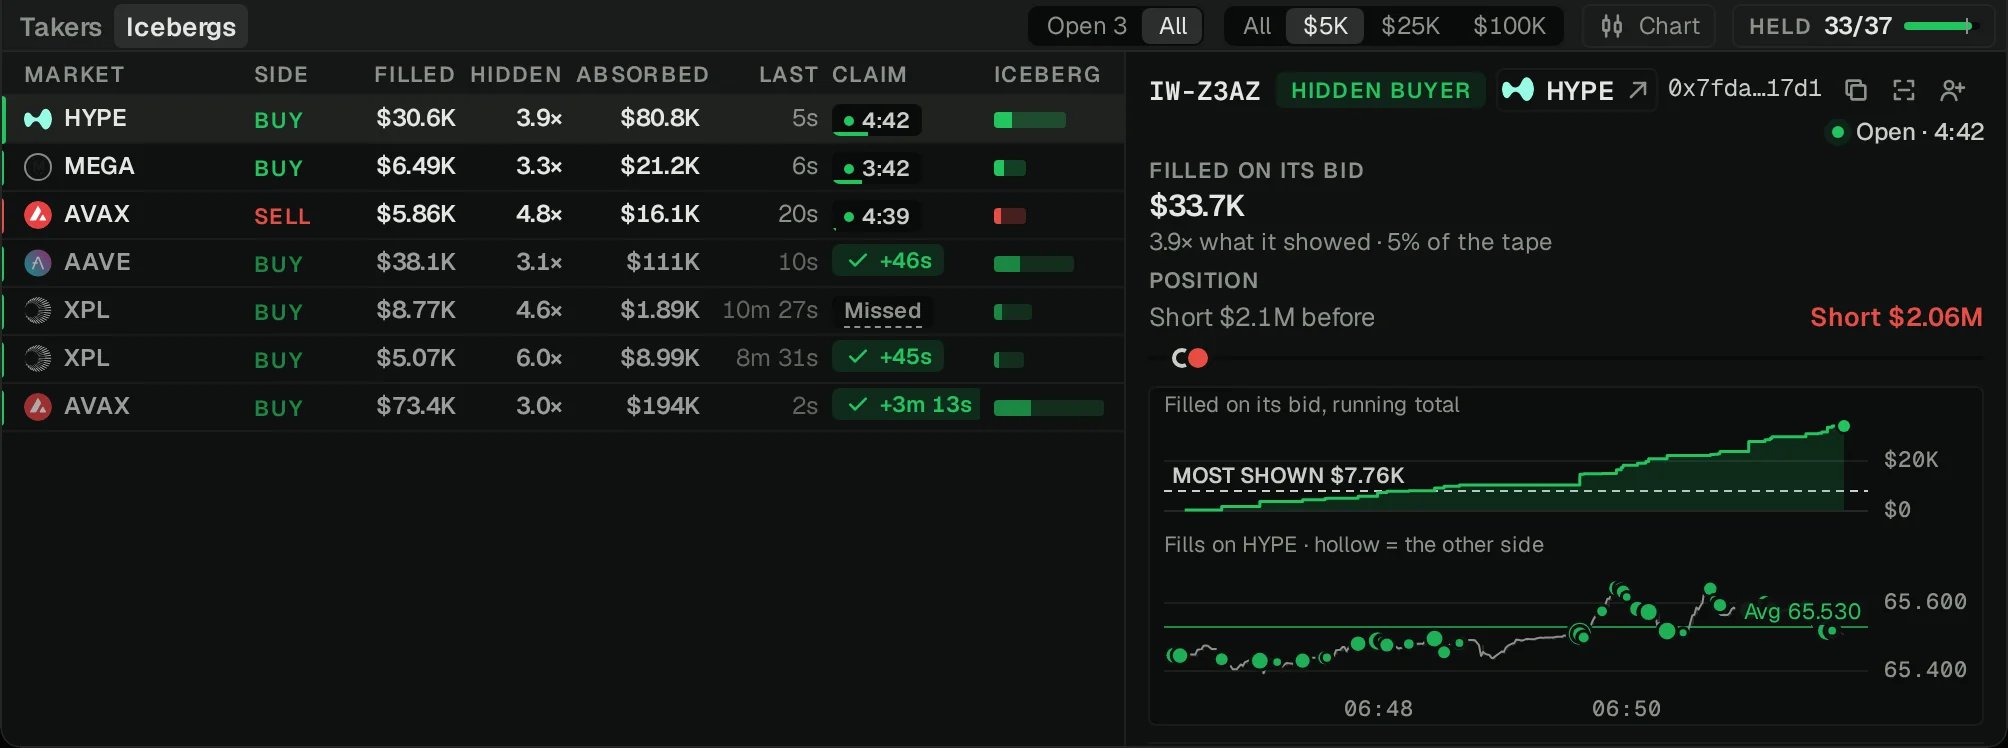
A big order rarely trades at once. Add Wallet flow from the Panels list to see the wallets working one, across every Hyperliquid market.- Takers
- Icebergs
Takers lists wallets buying or selling at market in small clips. A wallet shows here when, over 5 minutes, it takes at least 2% of a market’s taker flow, at least 90% on one side, in five or more clips, none of them a third of the total. Market makers and Hyperliquid’s own TWAPs are left out.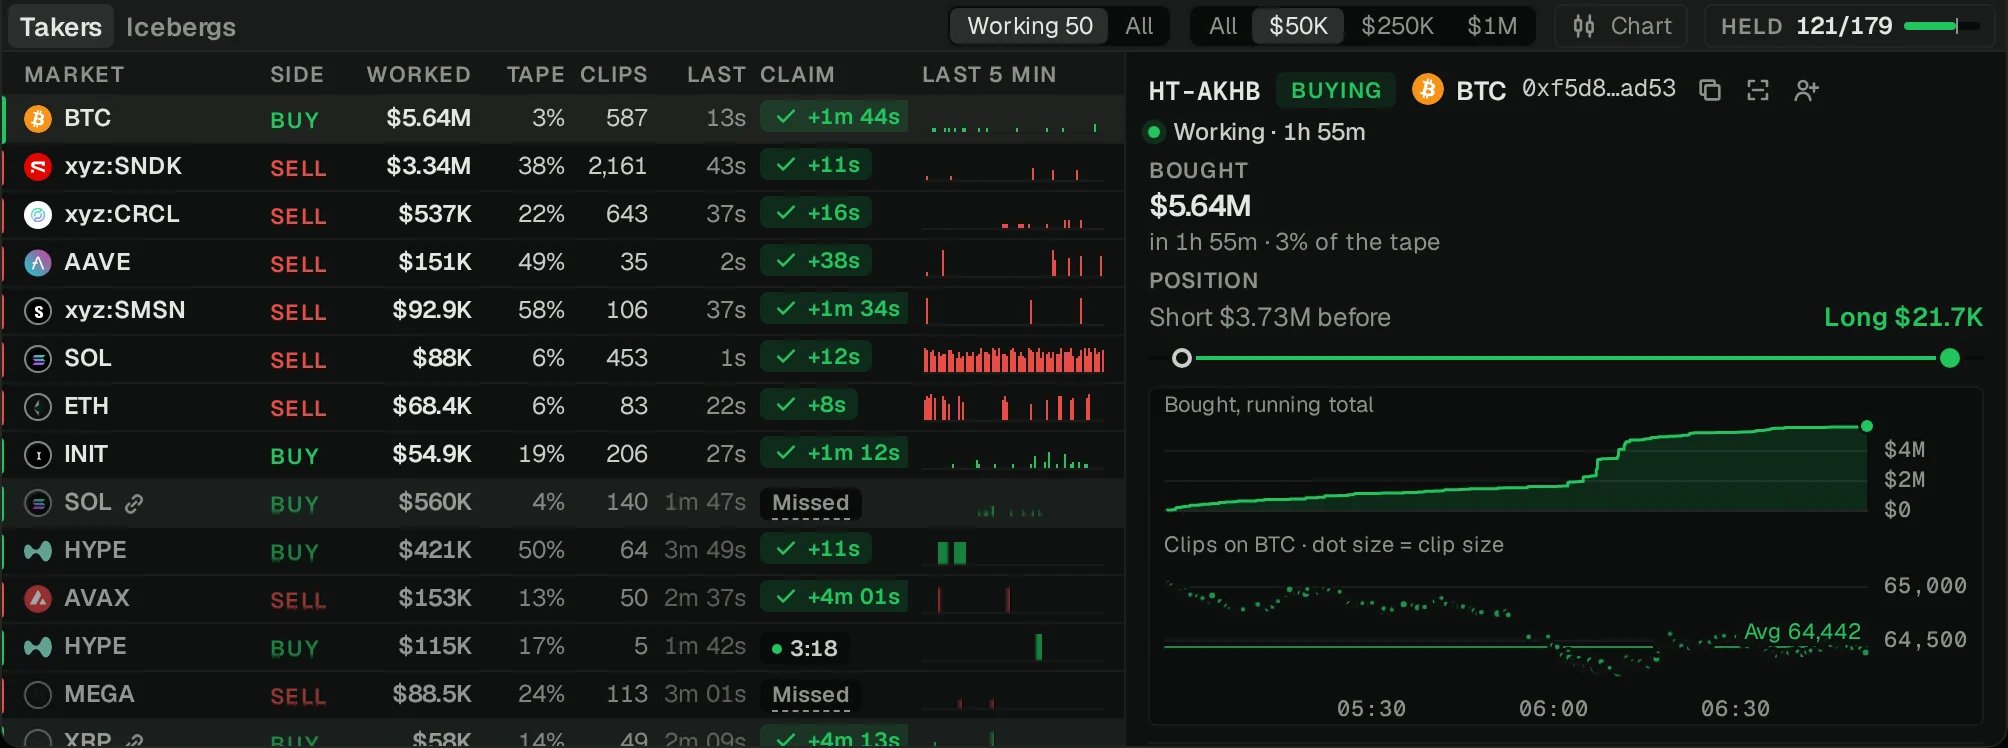
7. Read the regime
Add Order-flow regime from the Panels list. It plots the book against the flow every tenth of a second, with the last minute as a trail.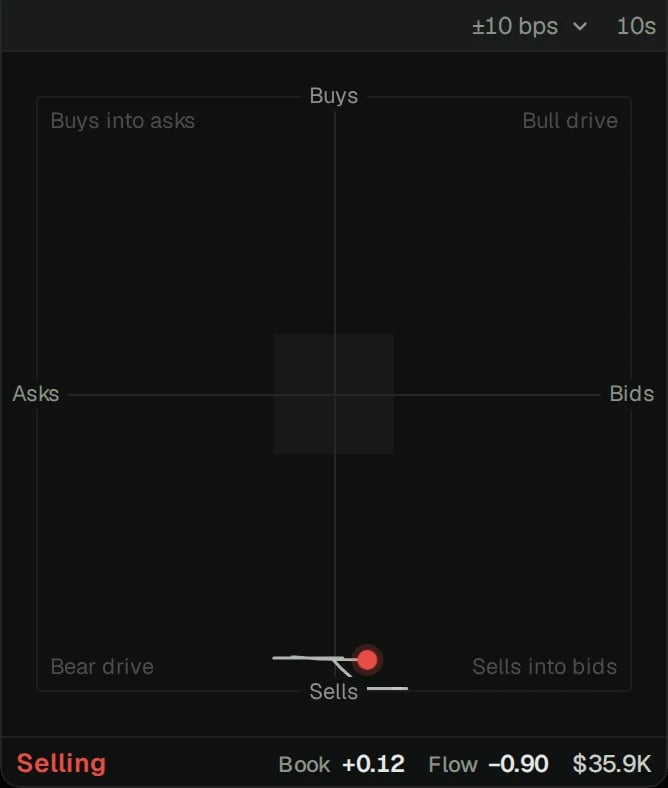
- Across: the book. Right, more resting size on the bids within 10 basis points of the price; left, more on the asks.
- Up and down: the flow over the last 10 seconds. Up, takers buying more than selling; down, selling more.
A drive has the book behind it. Buys into asks or sells into bids is aggression meeting the other side, which can turn either way. The square in the middle is balanced. The foot gives the state, both readings and the dollars traded in the window. The ±10 bps menu sets how much of the book counts, from the top of book to ±100 bps.