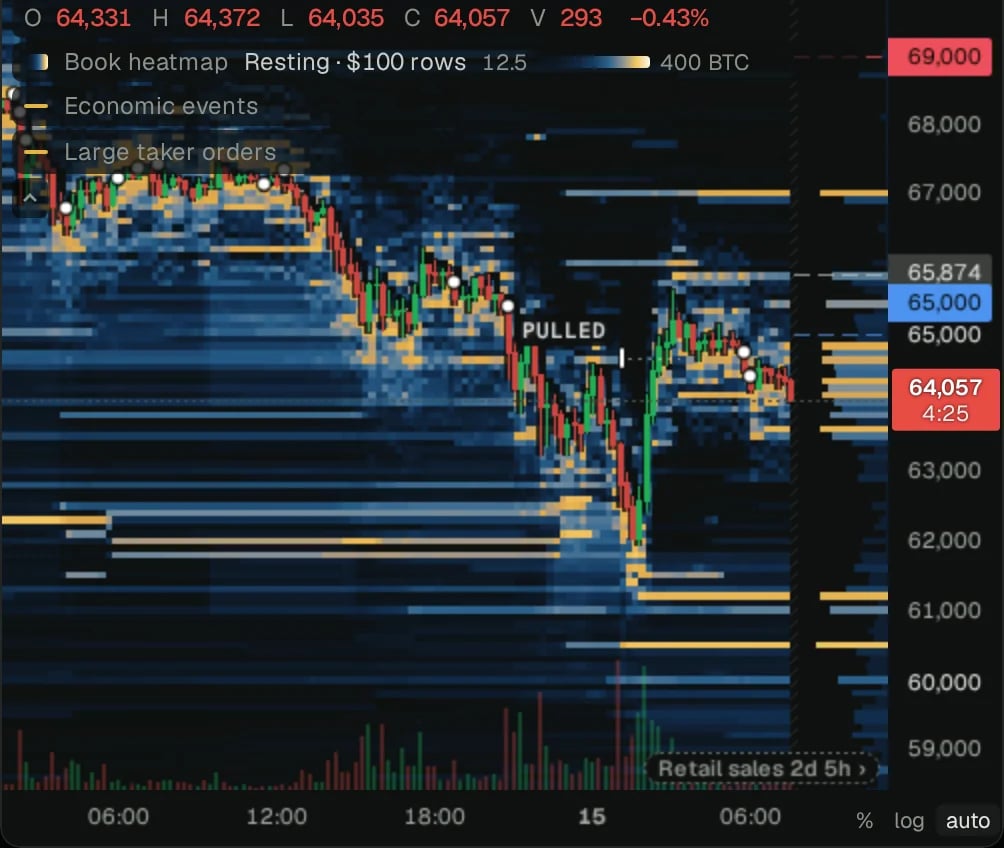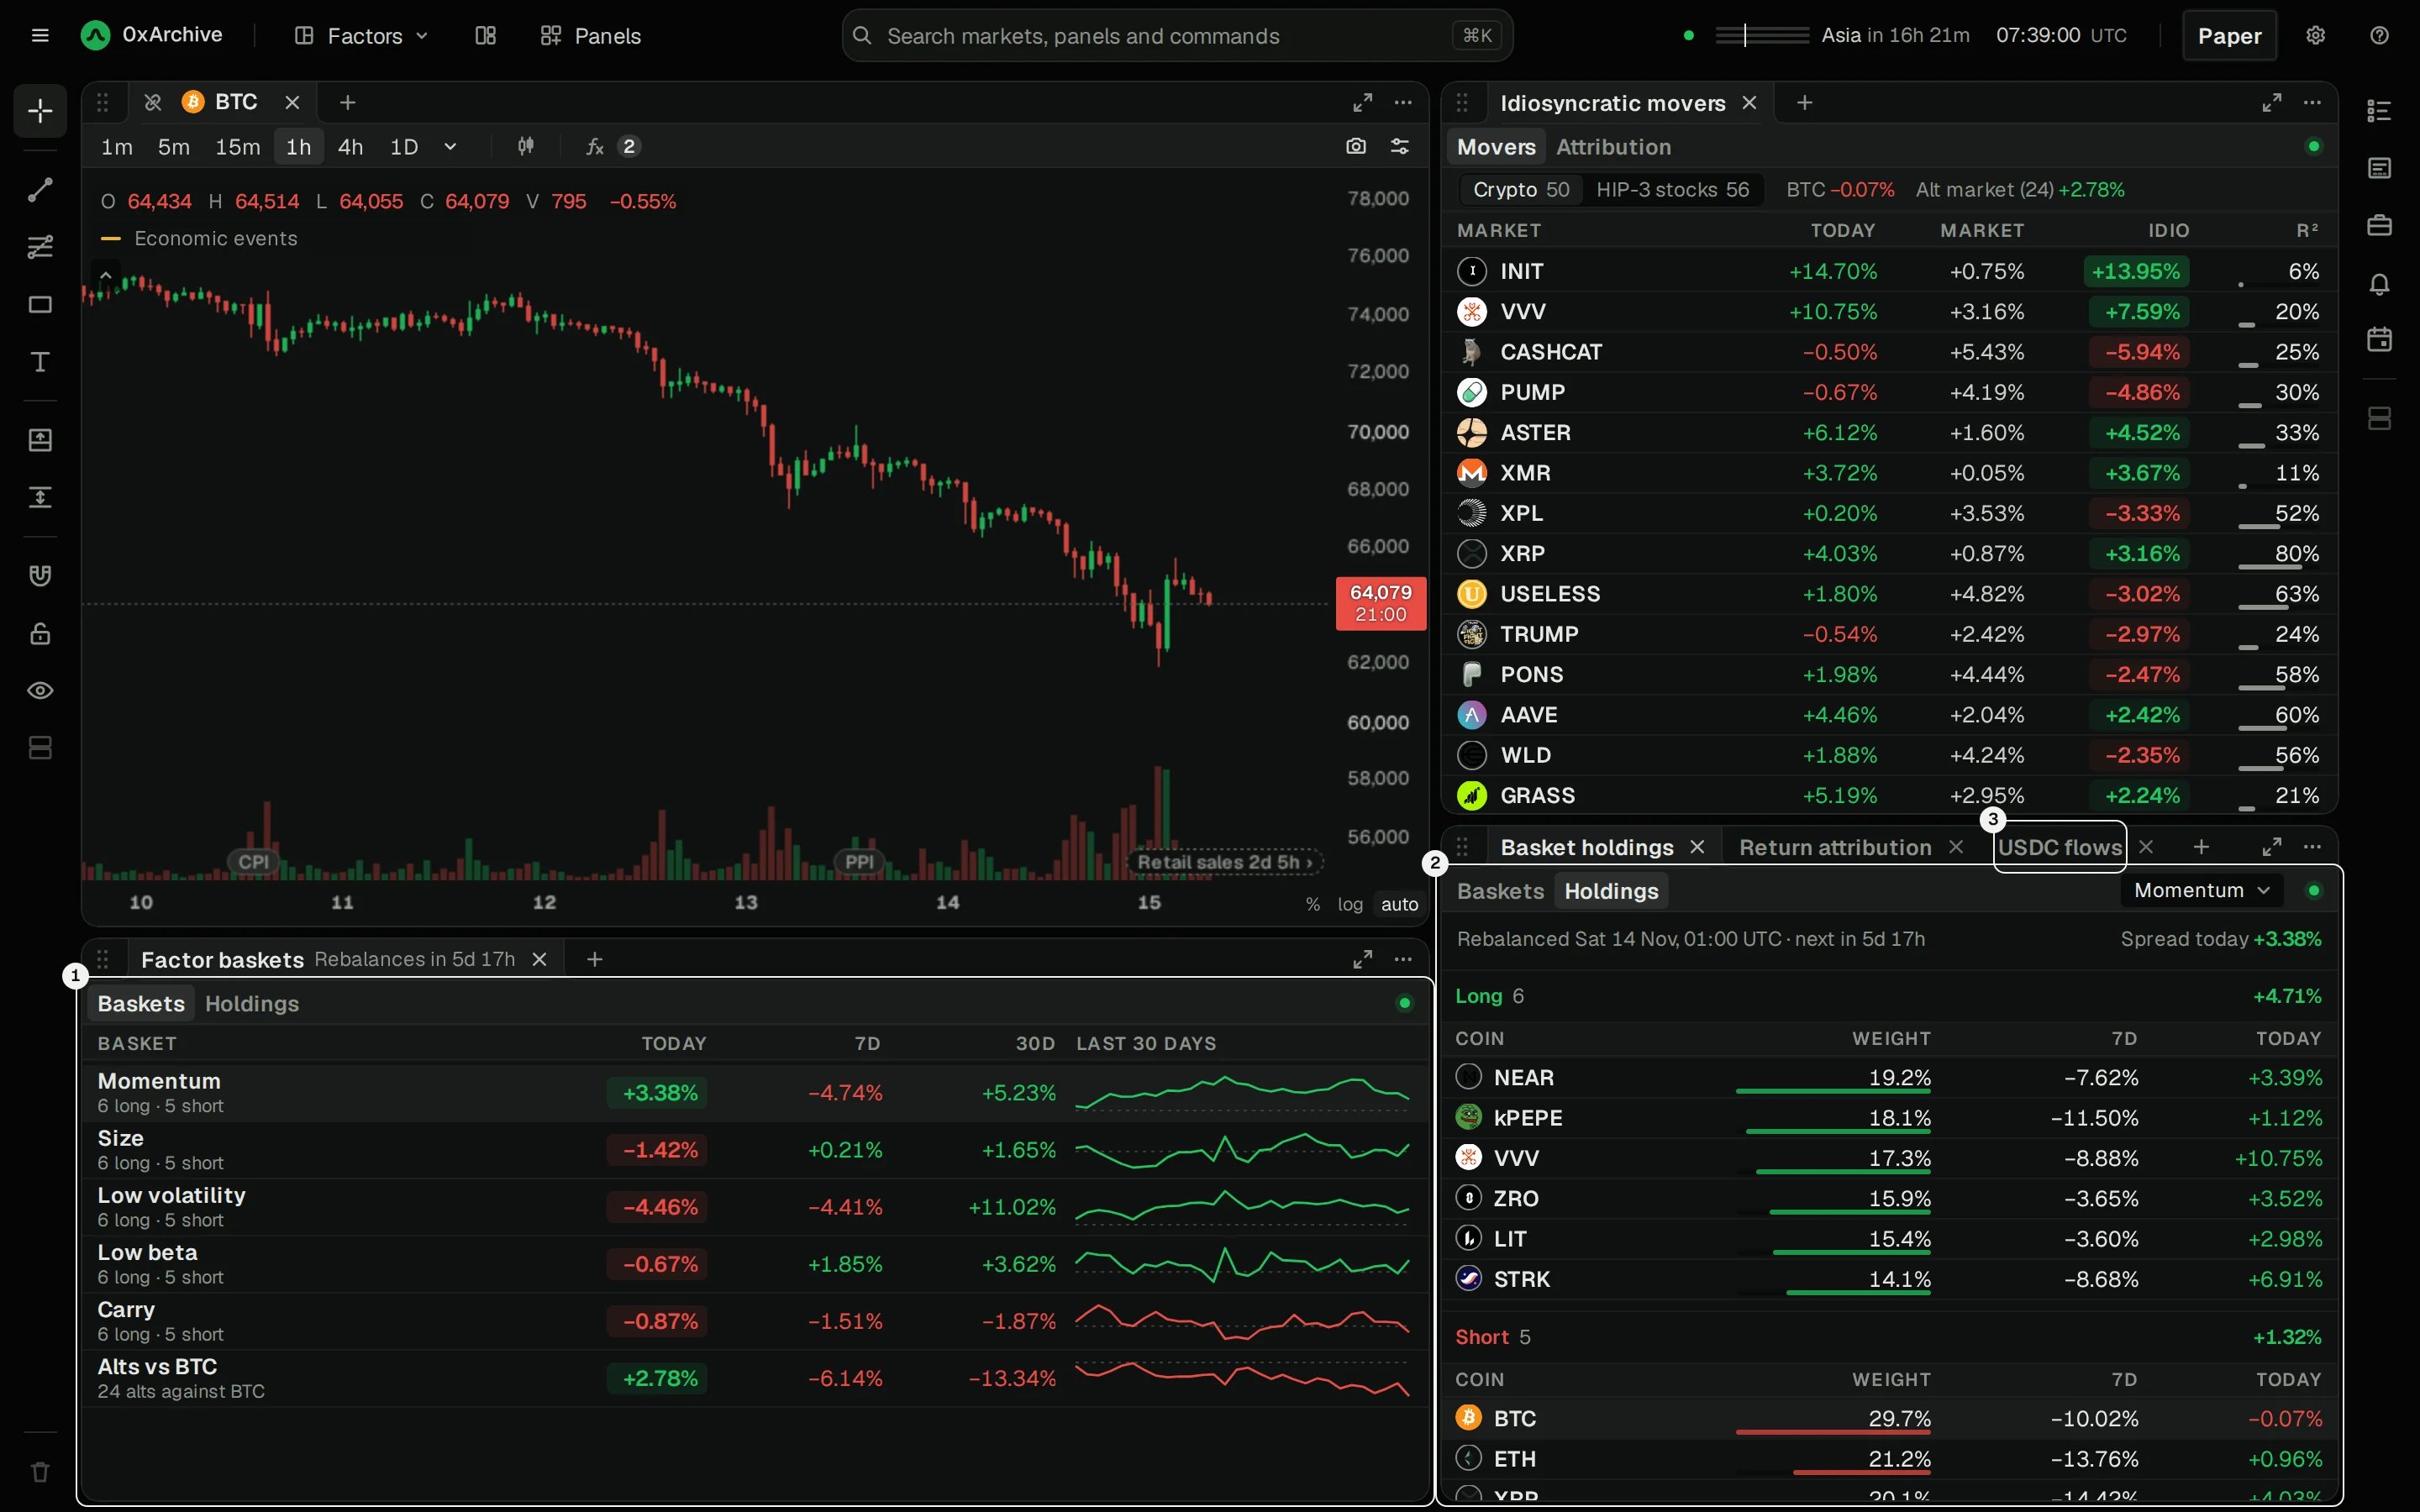
The Factors view: the factor baskets, one basket's holdings, and USDC flows behind a tab.
- Factor baskets: which kind of coin is winning, and each basket’s longs and shorts. In the Factors view (⌥6).
- USDC flows: money moving onto and off Hyperliquid. Also in Factors, behind a tab.
- Long/short: every account against the largest 100. In the Whales view (⌥5) and on Overview.
- Dealer exposure: where BTC option dealers have to buy or sell. In the Panels list.
1. See which kind of coin is winning
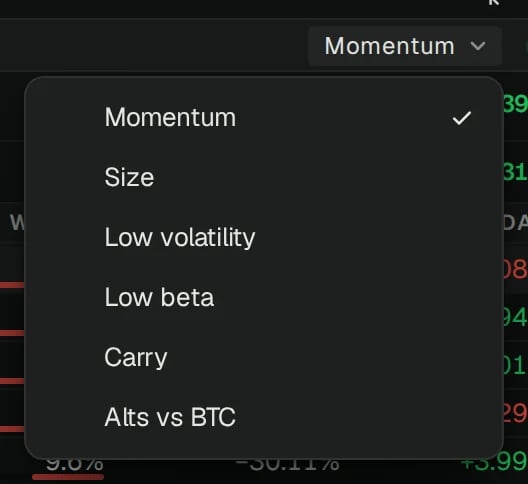
Factor baskets holds six baskets. Each is long one kind of coin and short its opposite, so its return says which kind is winning.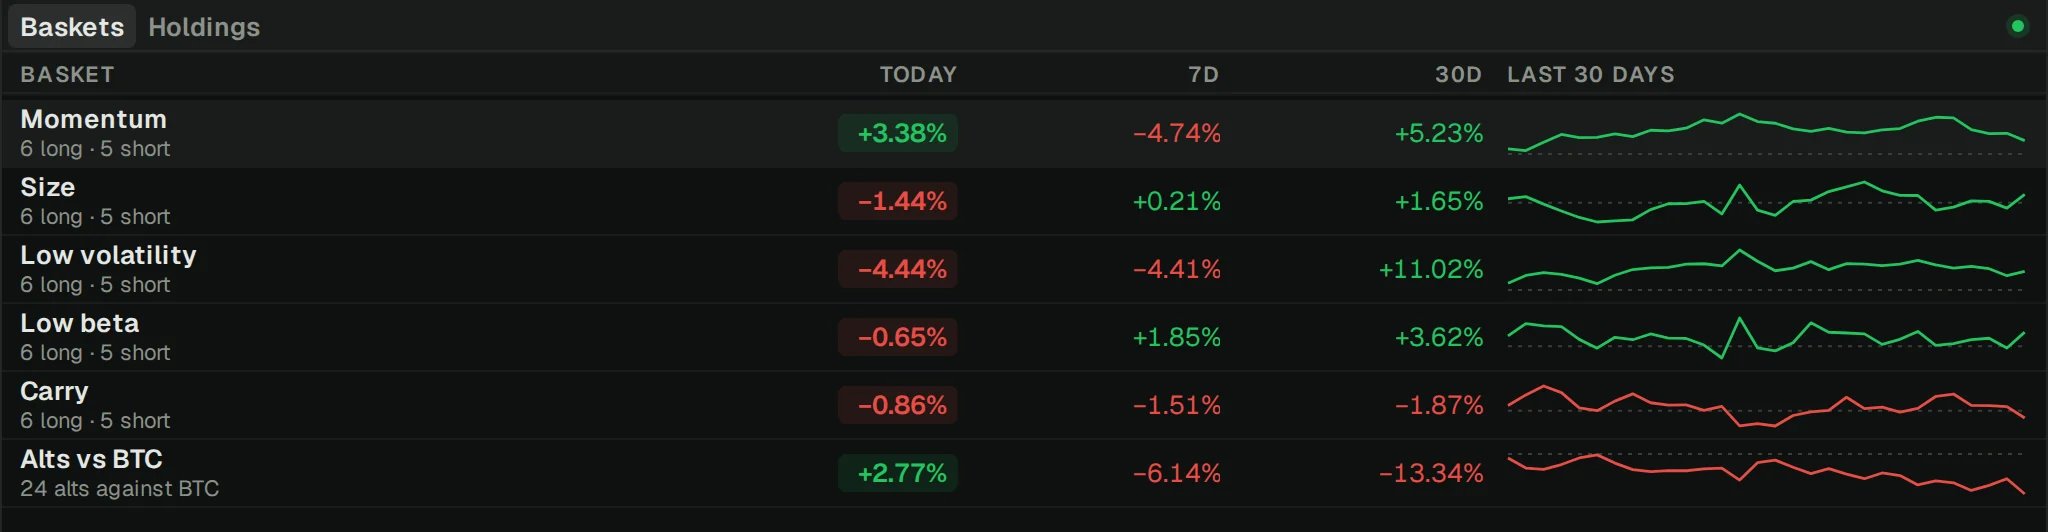
- Today: long leg less short leg since 00:00 UTC, at live prices.
- 7D and 30D: the last 7 and 30 full UTC days, held as each week’s rebalance had it.
- Last 30 days: the running total, day by day.
2. How each basket is built
Every basket is rebuilt the same way, from the same coins:- The coins: the 25 Hyperliquid perps with the most dollar volume over the last 30 days, among those with at least 60 days of history. HIP-3 markets are left out. The 25 are re-picked every 30 days.
- The rebalance: every Saturday. The new weights take effect at 01:00 UTC and are held all week.
- The legs: each coin is ranked on the basket’s signal. The top fifth is the long leg and the bottom fifth the short leg: 6 longs and 5 shorts out of 25.
- The weights: inside each leg, each coin is weighted by 1 over its volatility (the standard deviation of its hourly returns over the last 30 days), so calm coins weigh more. Each leg adds up to 100%.
- The return: the long leg’s price return less the short leg’s. Fees and funding are not taken off.
Alts vs BTC is the one basket not built from fifths: it’s the average of the other 24 coins less BTC, re-picked with the 25.
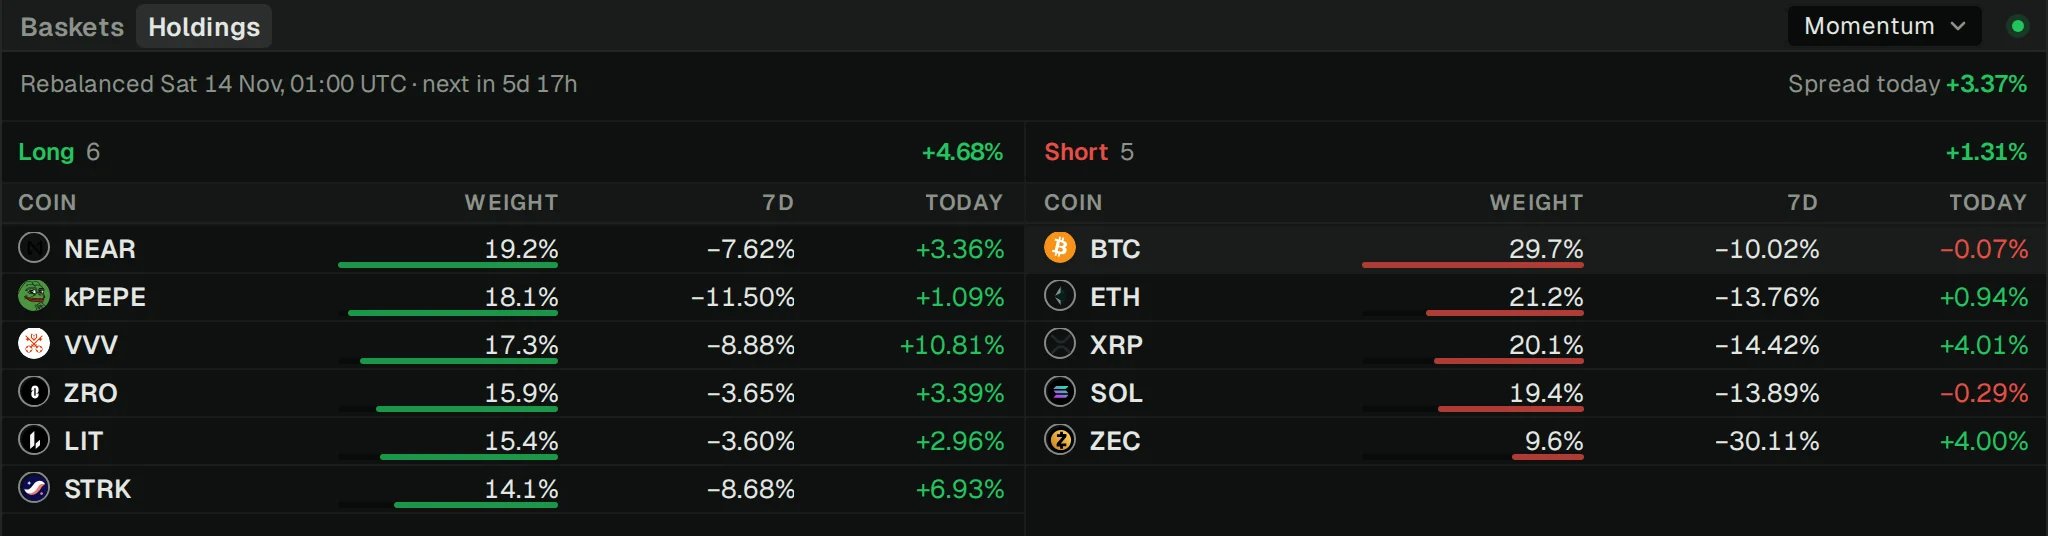
Holdings shows the picked basket’s longs and shorts: each coin’s weight, the signal it was ranked on (7D for momentum), and its move today. The menu at the top picks the basket.
3. Watch USDC onto and off Hyperliquid
The USDC flows tab counts the dollars moving onto Hyperliquid and off it, over the Arbitrum bridge and to and from HyperEVM.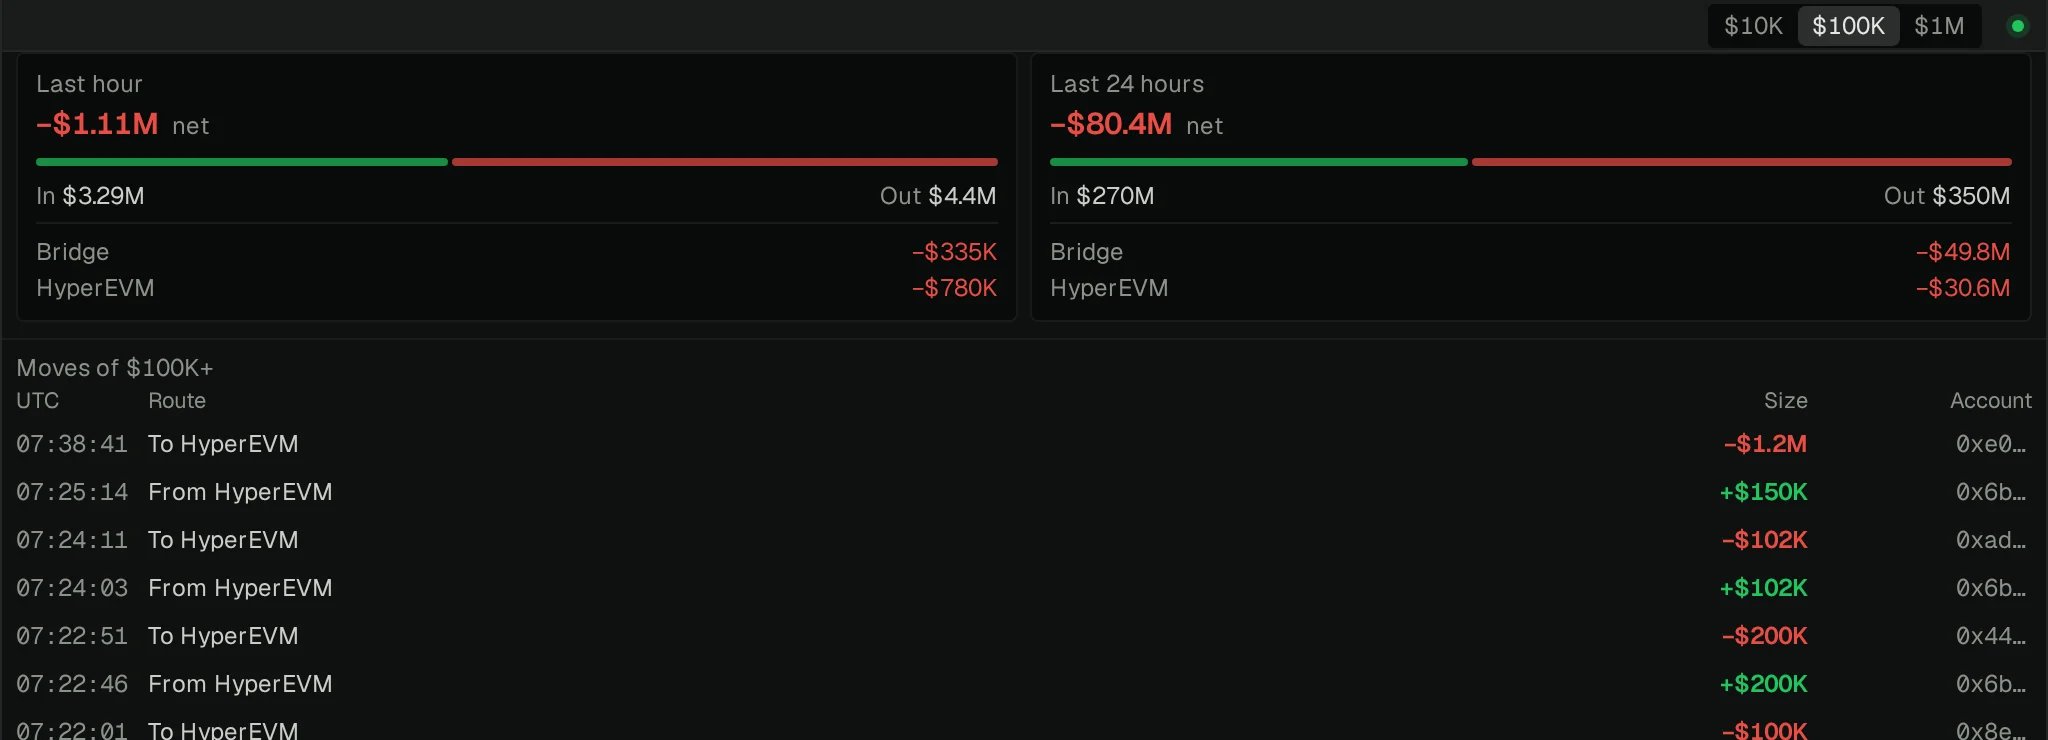
- Net: USDC in less USDC out, over the last hour and the last 24 hours.
- In and Out, and the net for each route: Bridge and HyperEVM.
- The list: every move of $100K or more in the last 24 hours. $10K and $1M change the list; the totals always count every move.
4. See every account against the largest 100
Long/short splits a market’s open positions two ways. It follows the chart’s market, on Hyperliquid and HIP-3.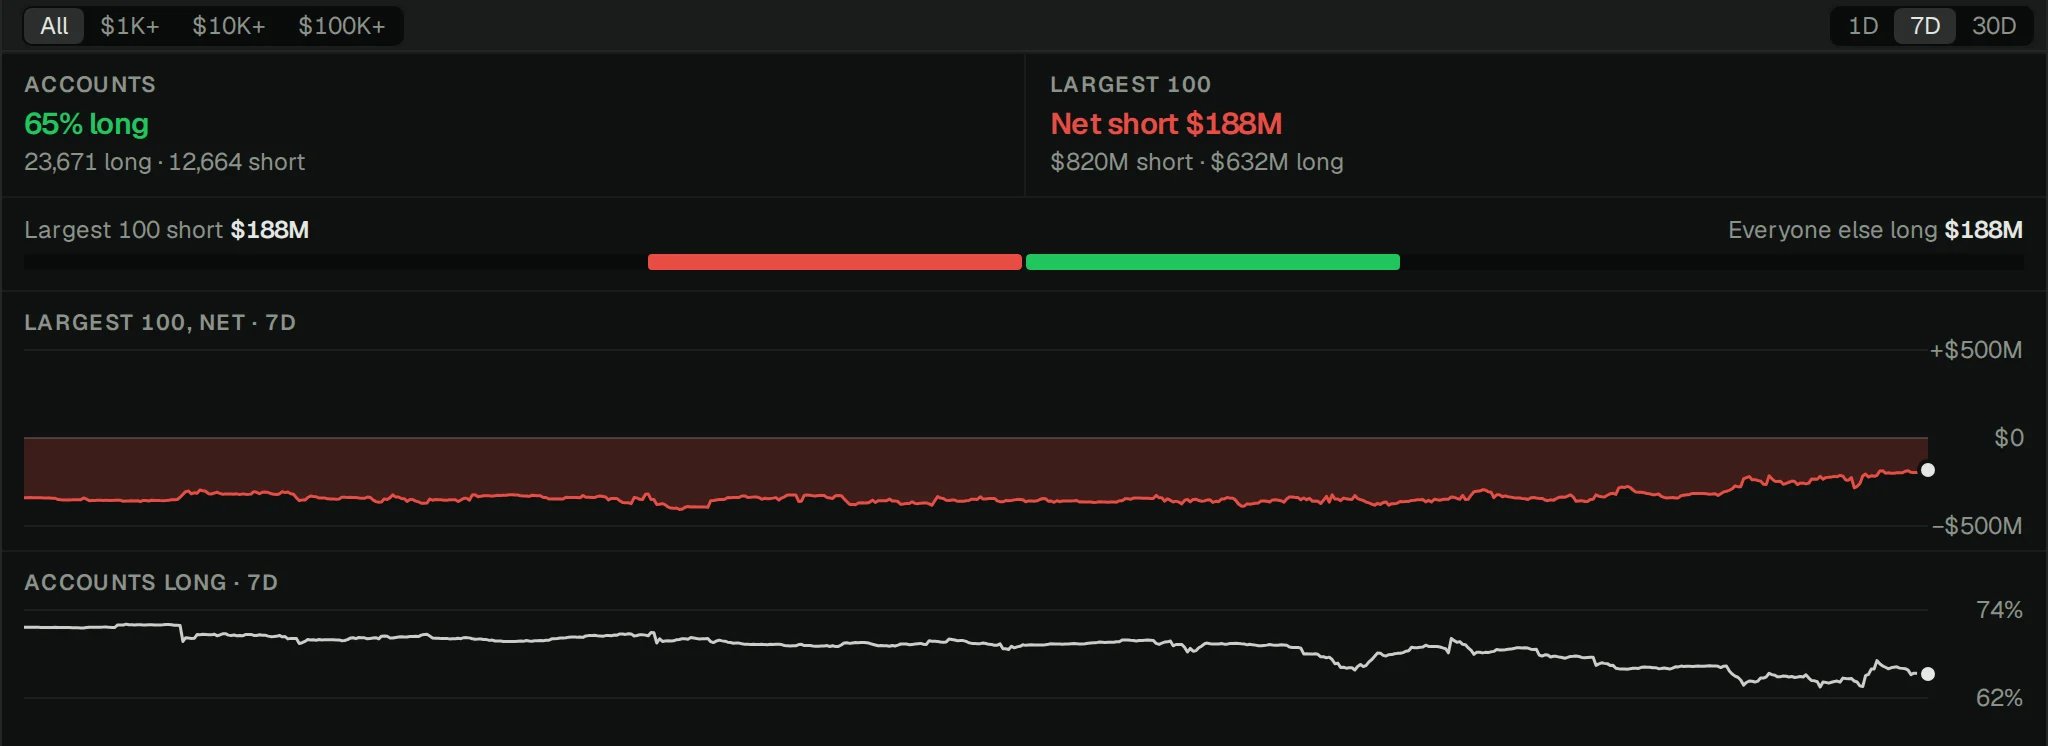
- Accounts: how many accounts are long and how many short. Here, 65% are long.
- Largest 100: the 100 biggest positions by value, long and short together, and their net. Here, net short $188M.
- The bar: every long has a short on the other side, so the largest 100 and everyone else always net to zero. If the largest 100 are short $188M, everyone else is long $188M.
- The charts: the largest 100’s net, and the share of accounts long, over 1, 7 or 30 days.
5. Find where dealers have to trade
Option dealers hedge what they’ve sold, and their hedges move price. Dealer exposure maps where BTC option dealers would have to buy or sell, from Deribit’s BTC options. Add it from the Panels list: it opens beside the layout, and it shows BTC whatever the page’s market.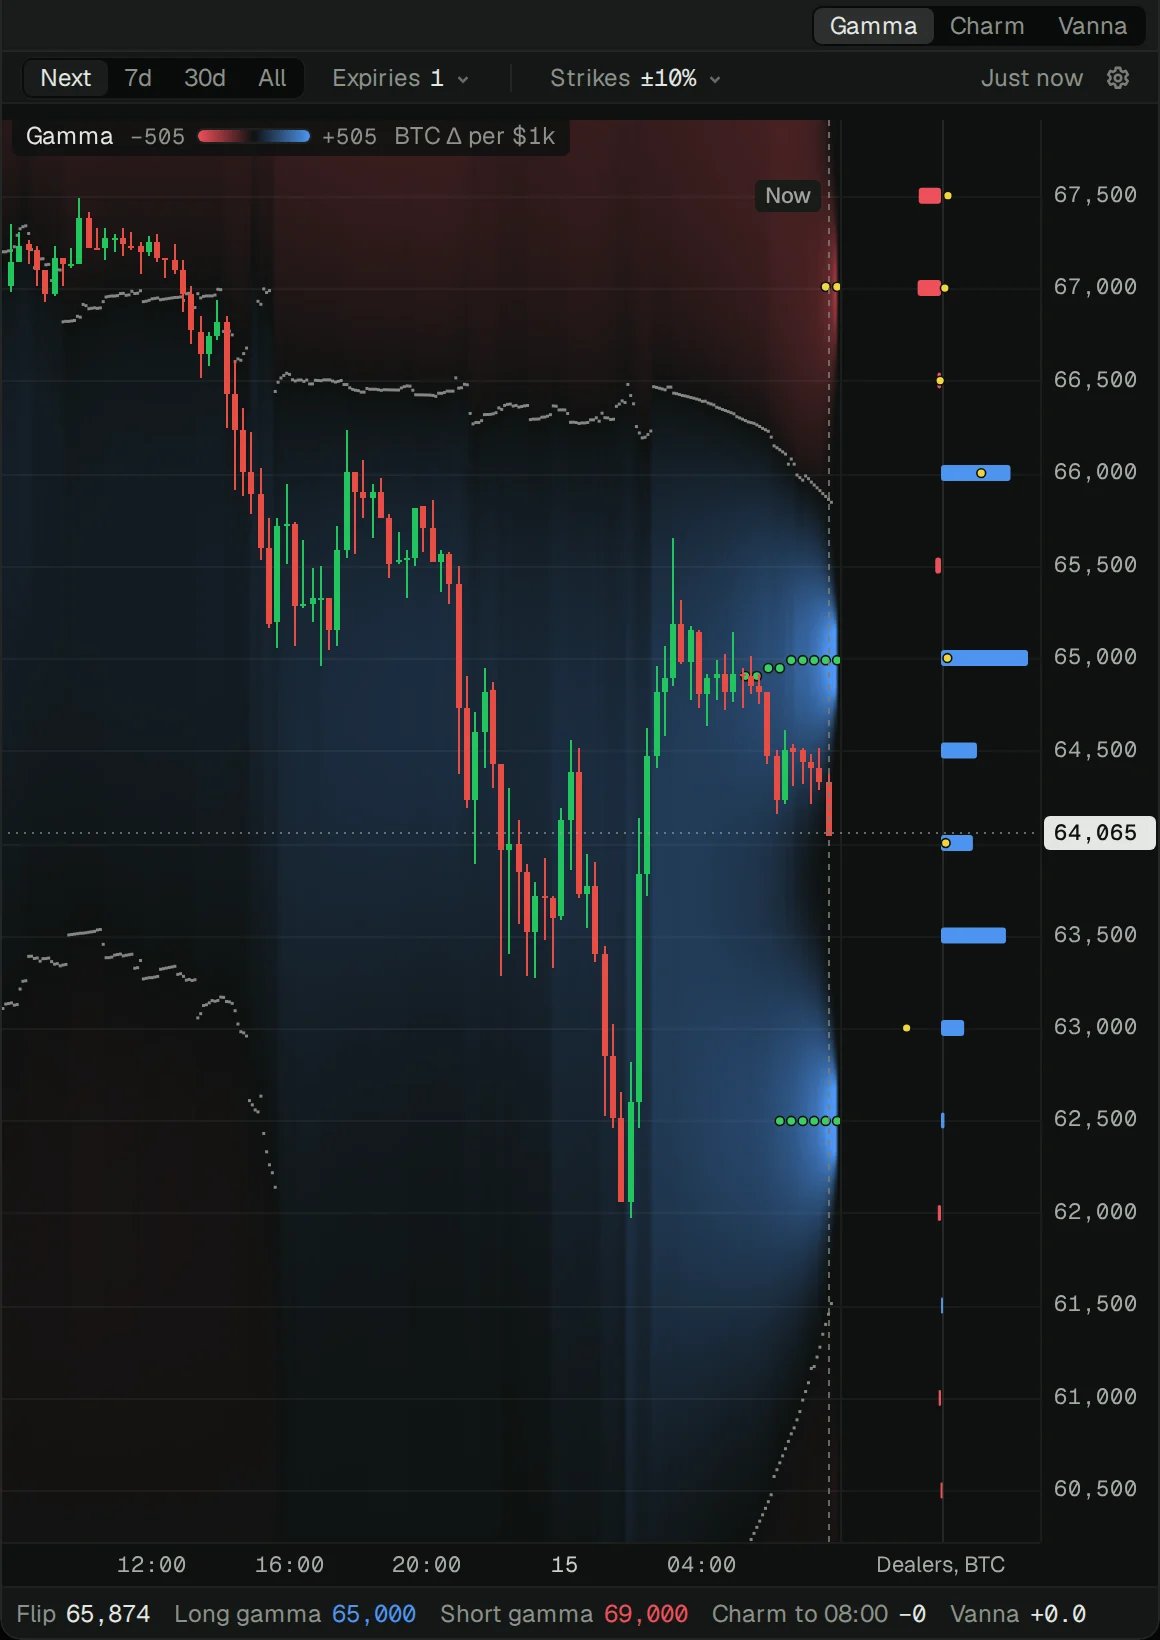
- Blue, long gamma: dealers sell rises and buy dips. Price tends to slow and pin there.
- Red, short gamma: dealers buy rises and sell dips. Moves through it tend to speed up.
- Flip: where gamma changes sign nearest the price.
- Long gamma: the strike where dealers hold the most long gamma.
- Short gamma: the strike where they hold the most short gamma.
- Charm
- Vanna
How much dealers must buy or sell as time passes, in BTC an hour, with nothing else moving. Charm to 08:00 at the foot totals it to the expiry: + is dealers selling, − buying.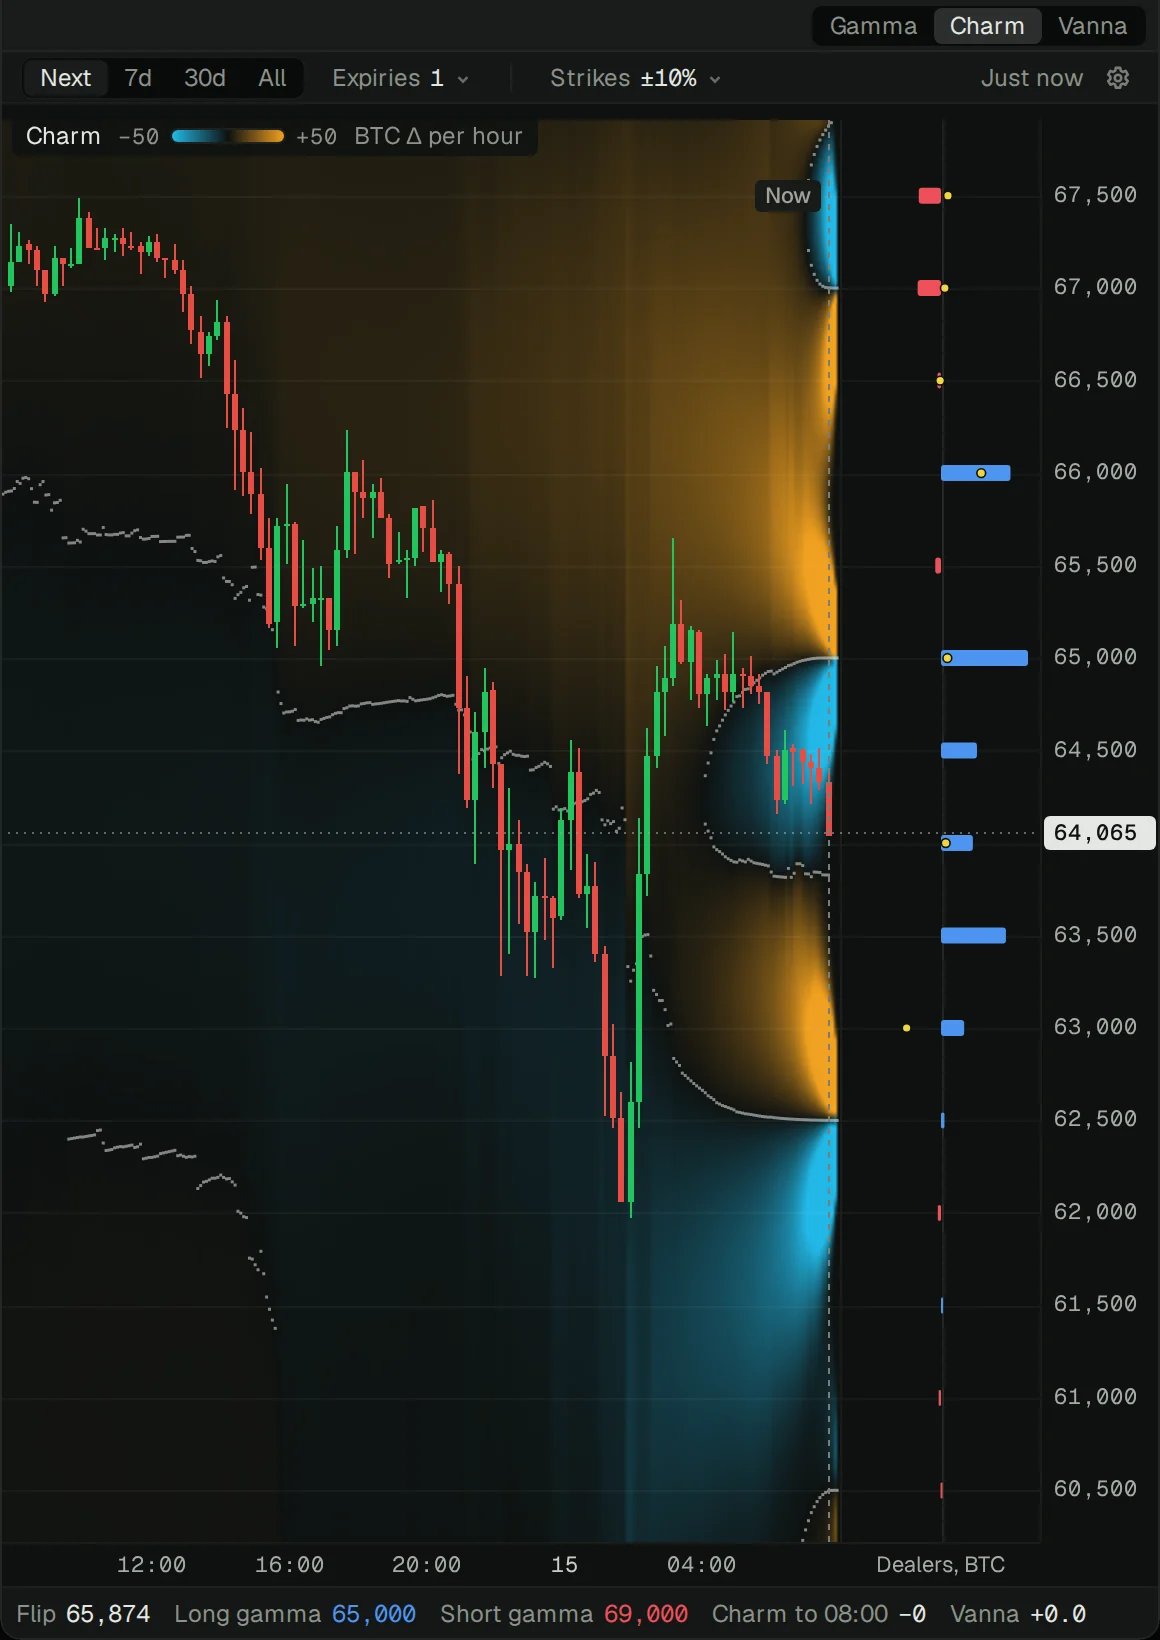
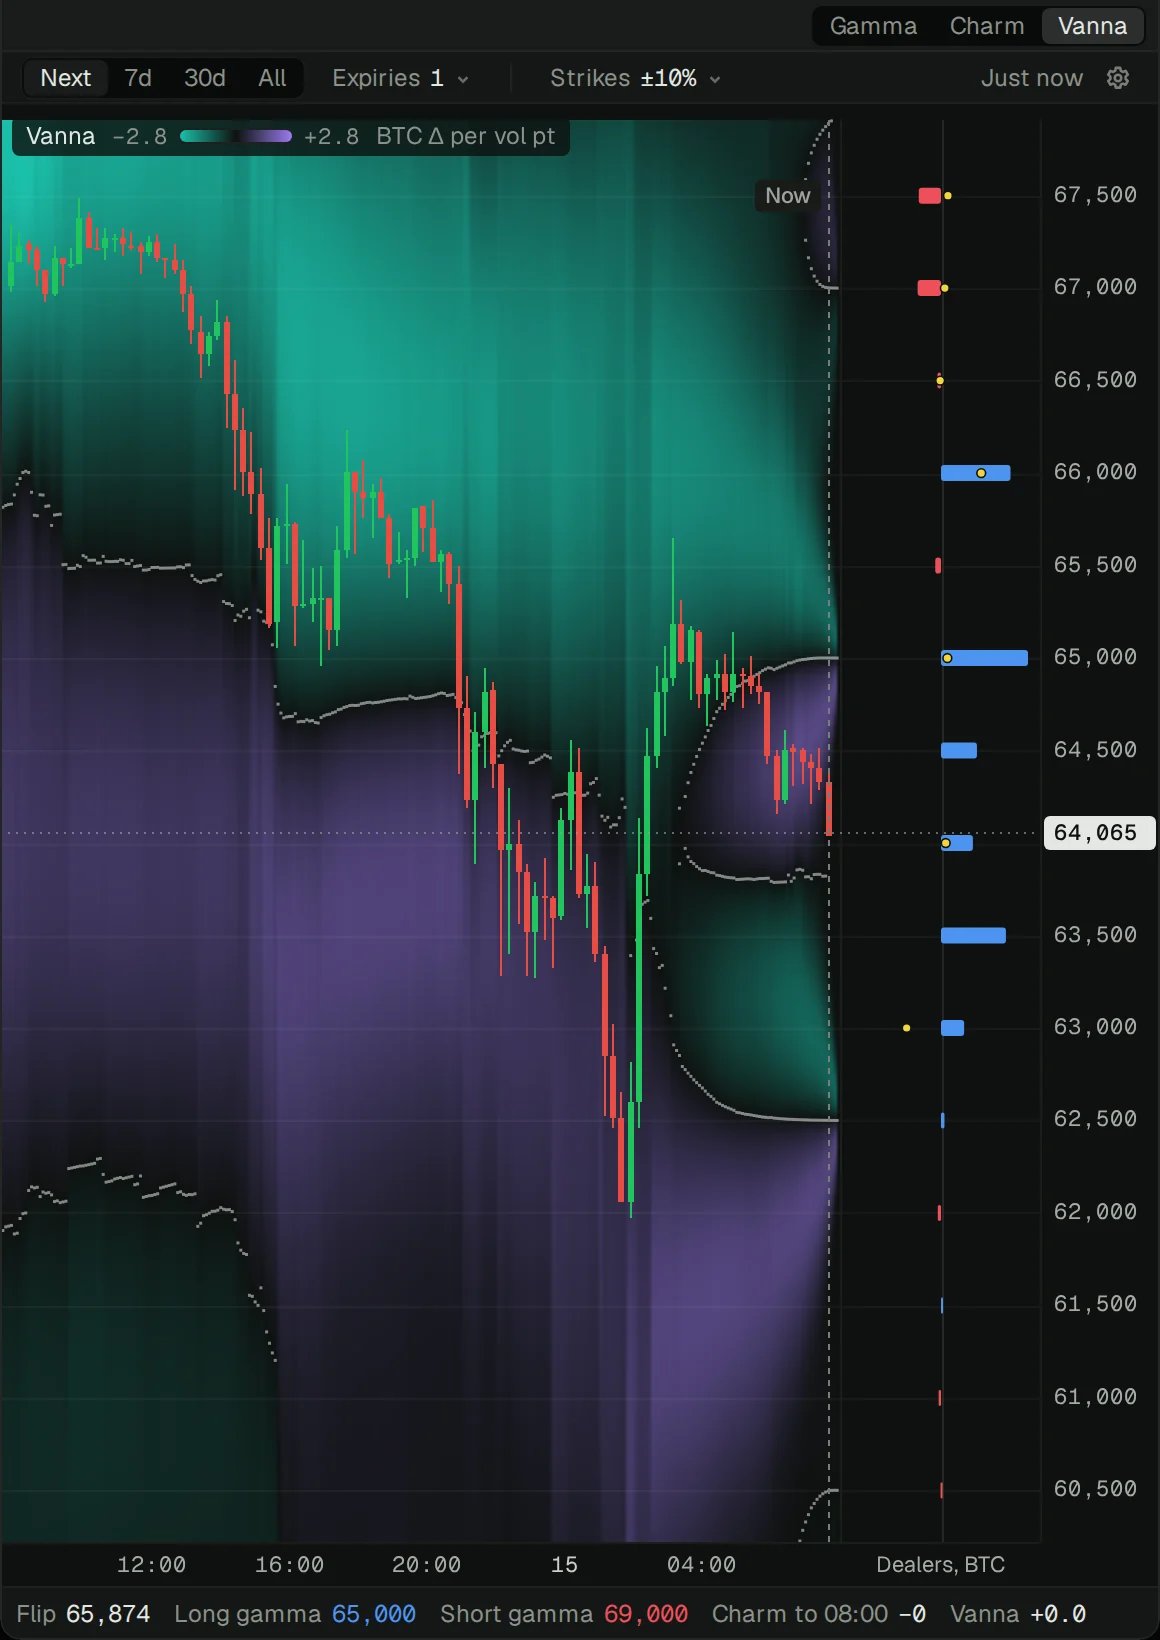
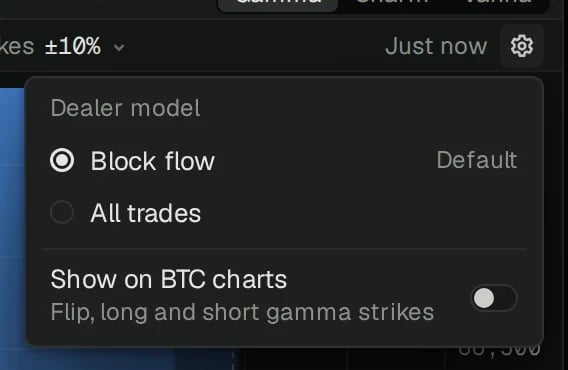
- Block flow (the default) counts only block trades, where a dealer quoted the other side.
- All trades counts screen trades too. Its map is fuller, and its levels stand out more sharply, as in the pictures here. It can count a dealer twice when they lay a block off on screen.
- Show on BTC charts draws the flip, long gamma and short gamma on every BTC chart, on any venue.