

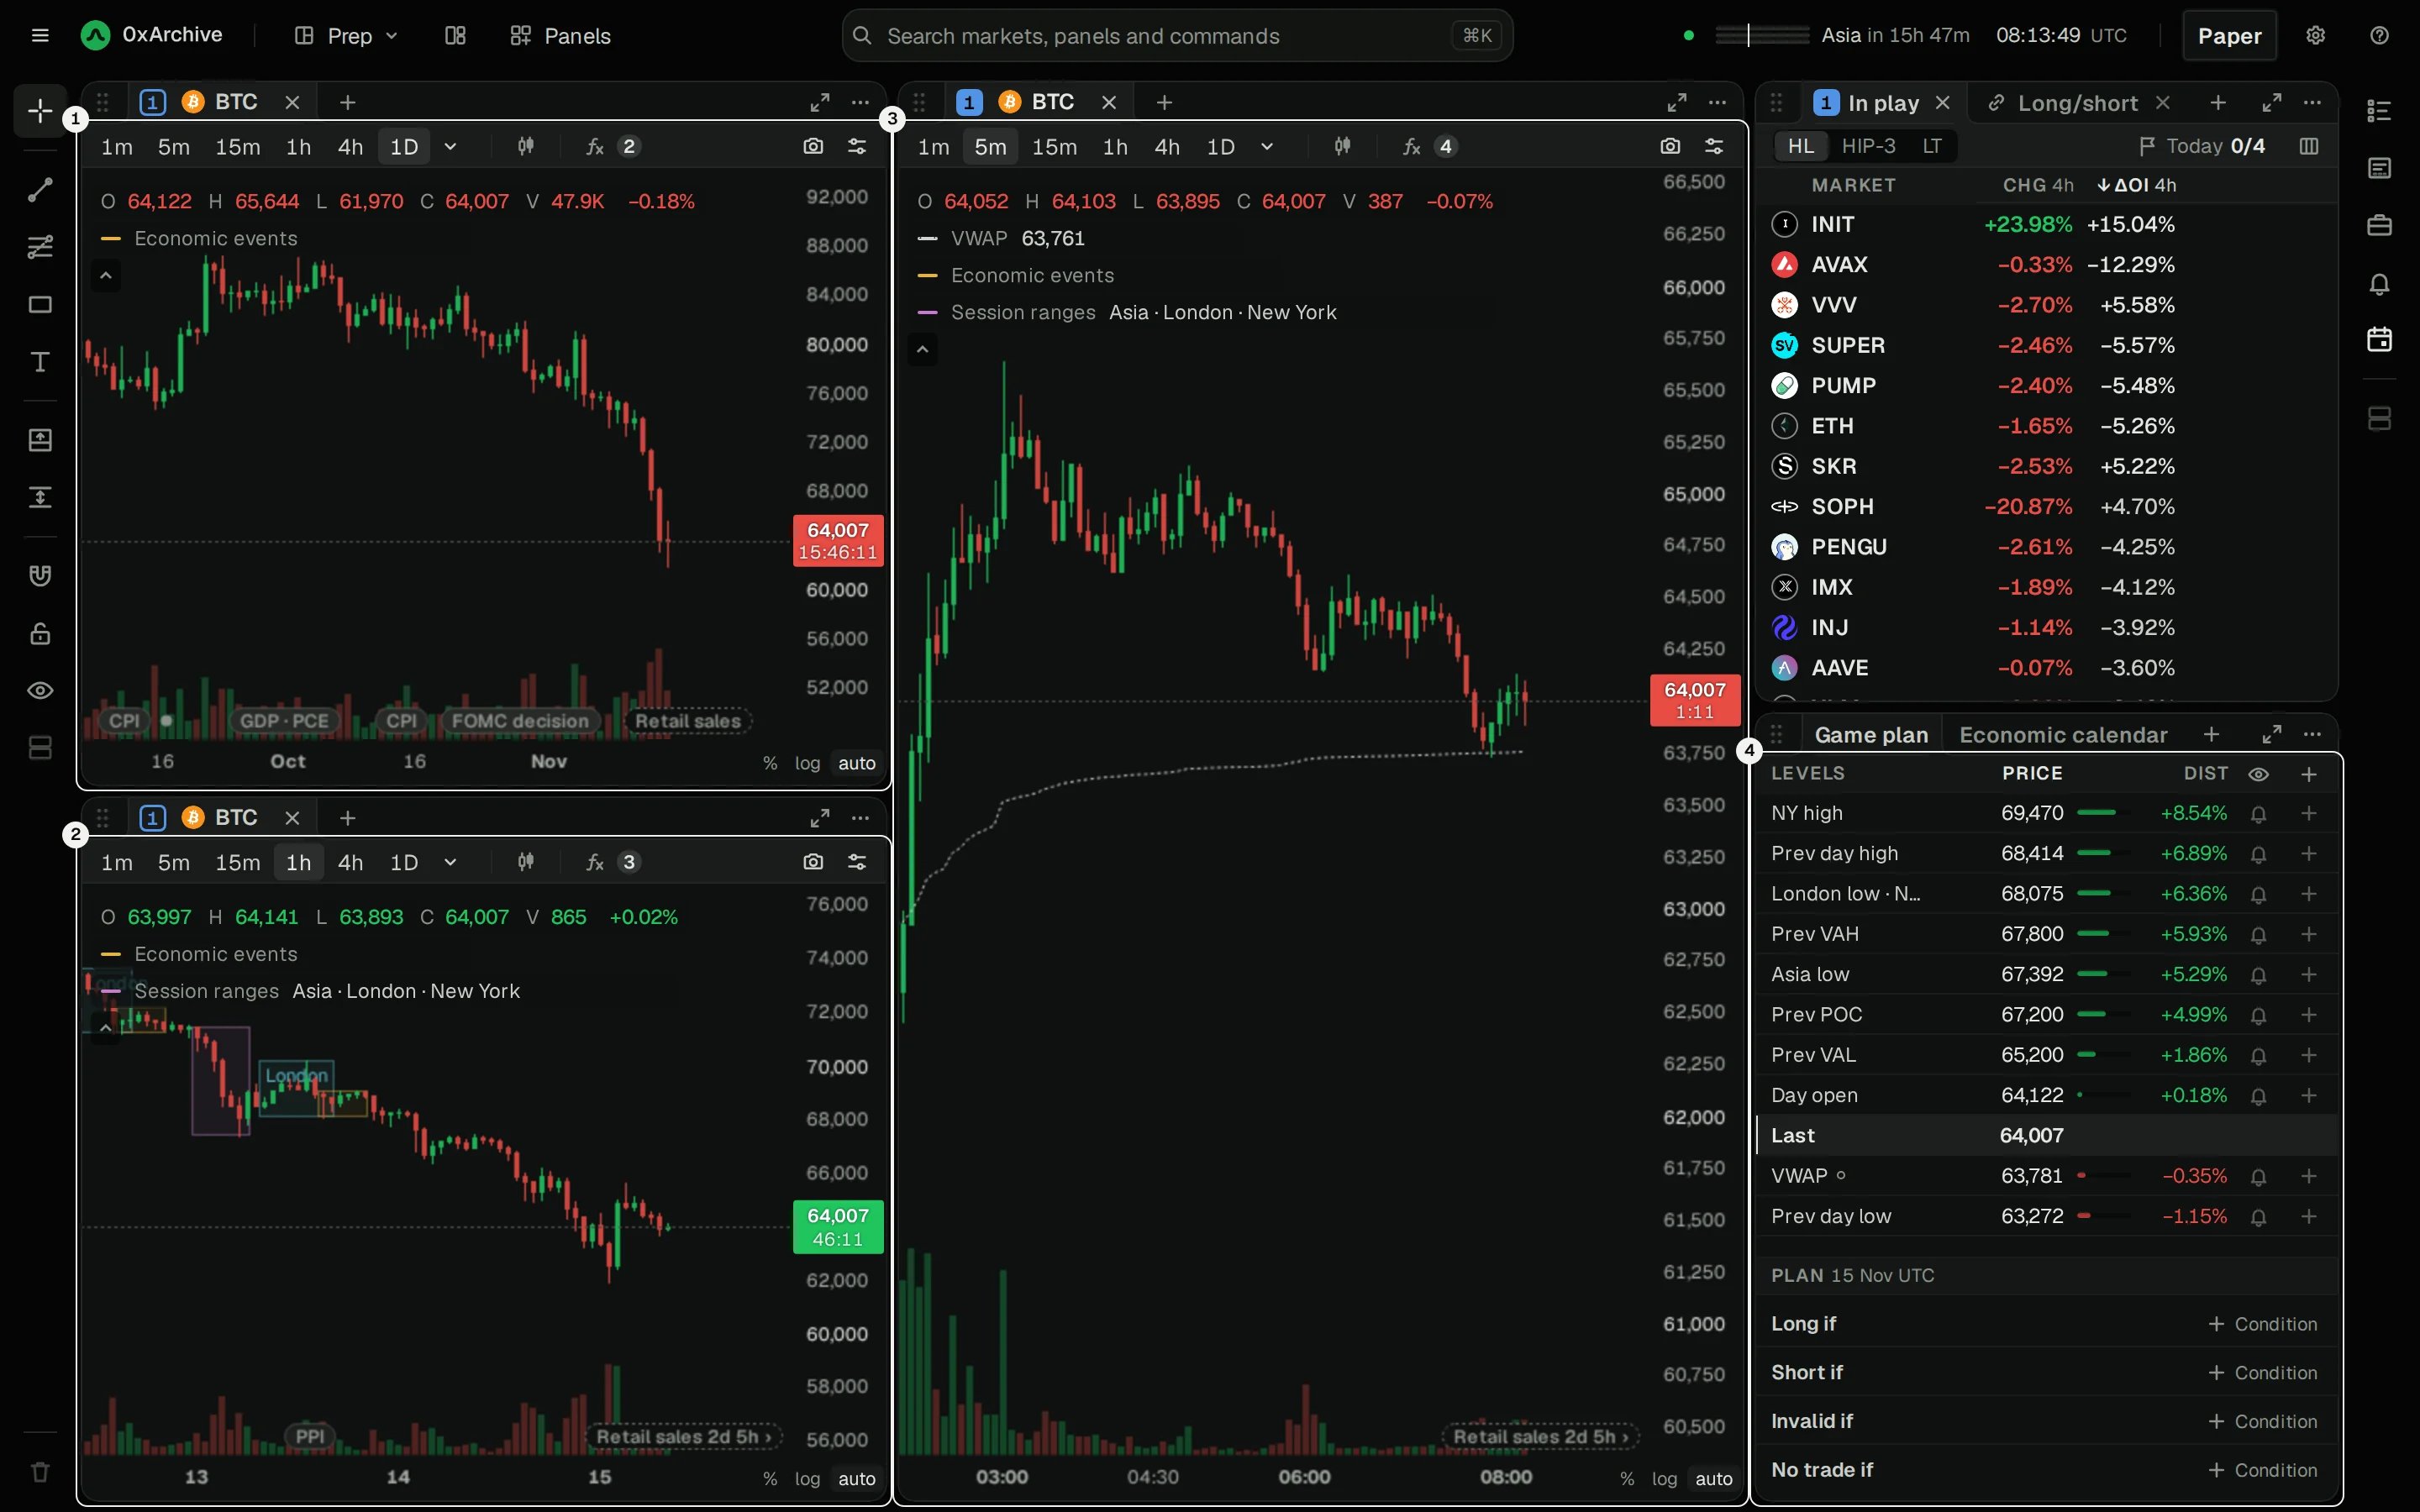
The Prep view: one market on three timeframes, beside In play and the Game plan.
- The daily chart: the bigger picture.
- The hourly chart: the last few days, with the sessions boxed.
- The 5-minute chart: where you’d enter, with VWAP.
- The Game plan: the day’s levels, an alert on each, and your plan for the day. The Economic calendar sits behind its tab.
1. One market on three timeframes
The three charts share link group 1, so they always show the same market. The 5-minute chart and In play drive the group: pick a market on either and all three charts and the Game plan move to it. The daily and hourly charts follow. A market picked on a following chart changes only that chart, for a quick look at another market. The next pick on the 5-minute chart or In play brings it back. The numbered chip in a chart’s header sets its link: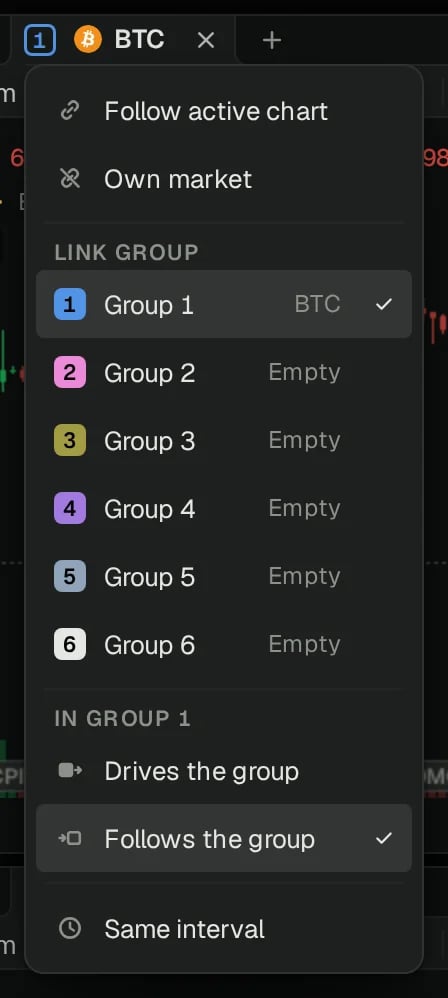
- Follow active chart: show the market of the chart you last clicked.
- Own market: keep its own market, linked to nothing.
- Group 1 to 6: share a market with the group’s other panels. Each group shows its market.
- Drives the group or Follows the group: whether a pick on this chart moves the group or only this chart.
- Same interval: the group’s charts change interval together. It’s off in Prep, so each chart keeps its timeframe.
2. See the sessions
Session ranges box each trading session from its high to its low, on the hourly and 5-minute charts: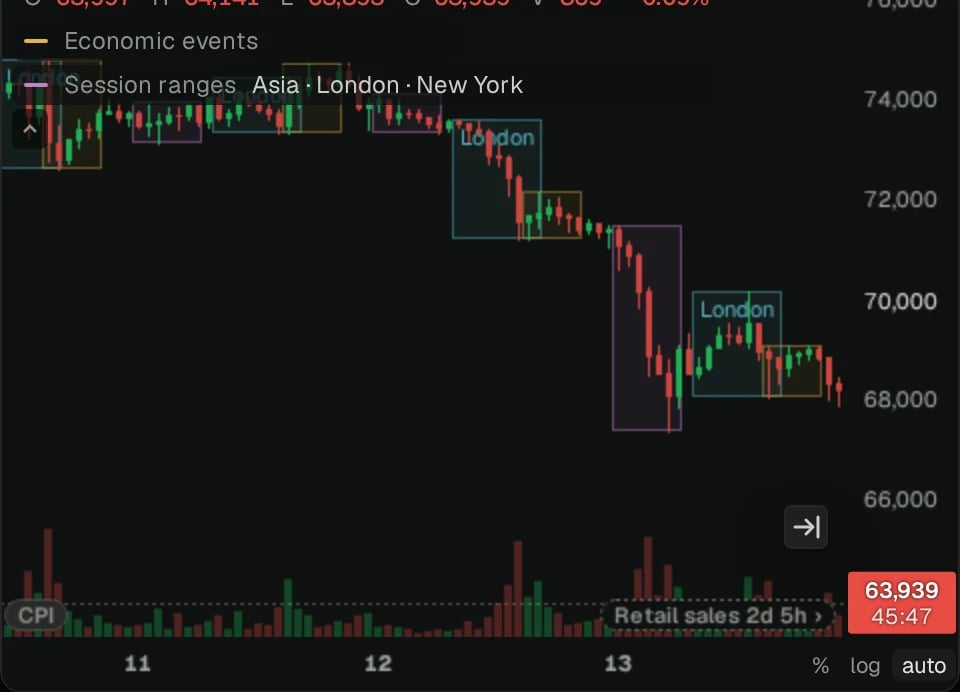
Each session keeps its city’s clock, so daylight saving moves it as it moves the city. There are none at weekends. The boxes draw on charts of 1 hour and finer; the gear on the legend’s Session ranges row turns each session off or on.
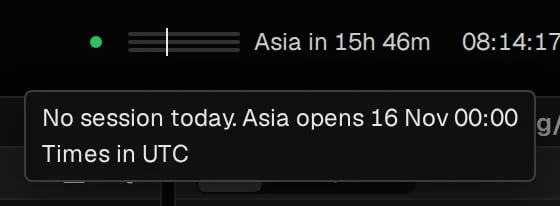
The session clock in the top bar shows today’s sessions as lanes, filling as each runs, and what’s left of the open ones or the time to the next. Point at it for each session’s hours:
3. Know the day’s levels
The Game plan (⌥⇧G) lists the market’s levels around its price, nearest first, above and below a Last row: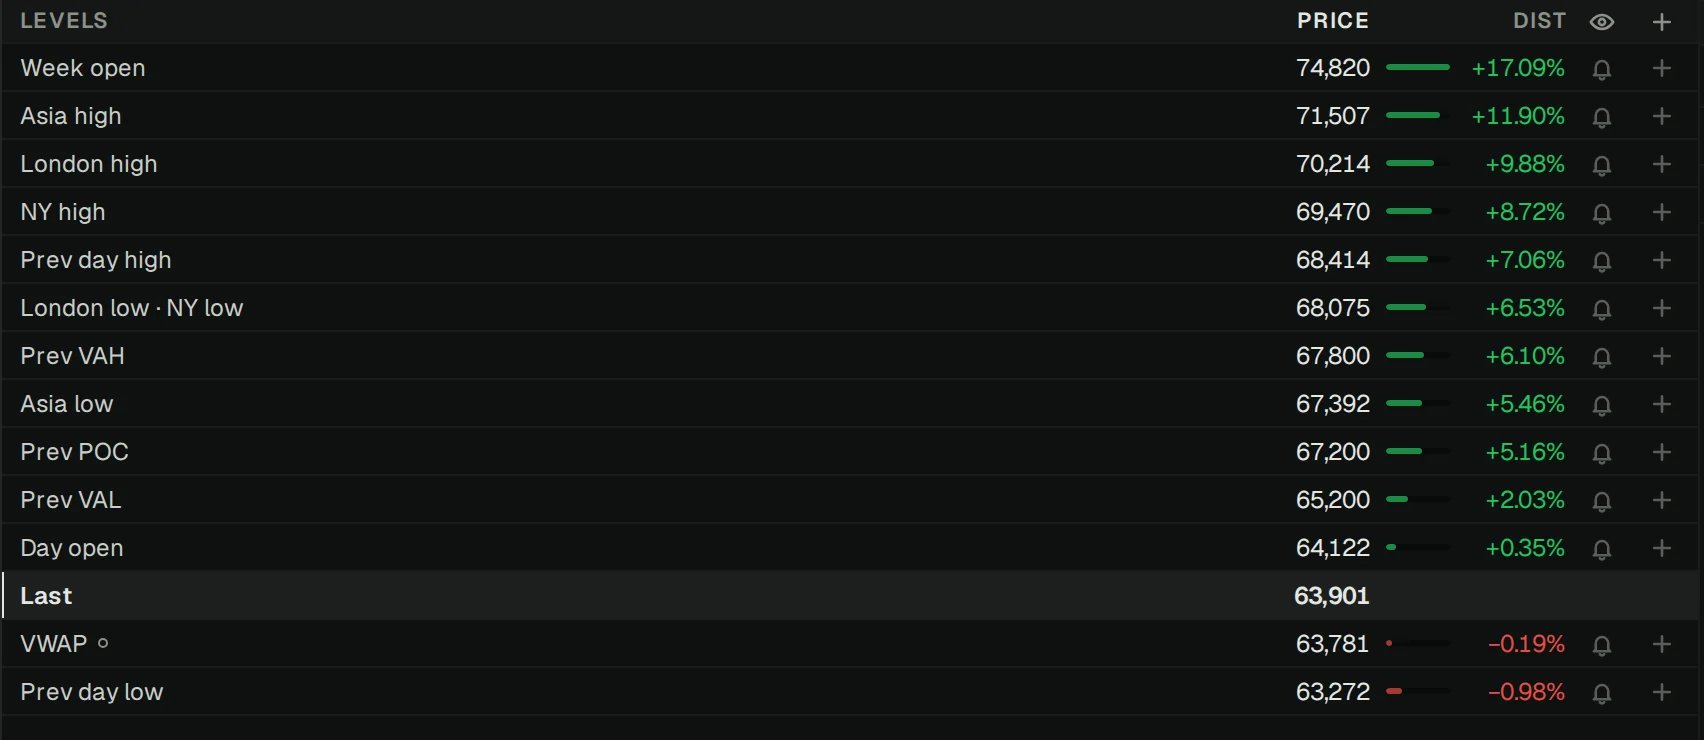
Every level comes from the market’s own 15-minute bars, and a level with no bars behind it is left out, never guessed. A level still forming has a small dot beside its name. Point at a name to see the period it comes from.
Levels at the same price share a row, such as London low · NY low. Dist is how far each is from the price, with a bar to compare them at a glance.
The + in the head adds a level of your own: a name and a price. You can keep 24 for each market, and they stay until you remove them.
4. Set an alert on a level
The bell on a level’s row sets an alert for when price crosses it. It’s the same alert the chart’s Alerts tool sets, so it shows in that list and draws a dashed line on the market’s charts. Click the bell again to remove it.5. Write the plan
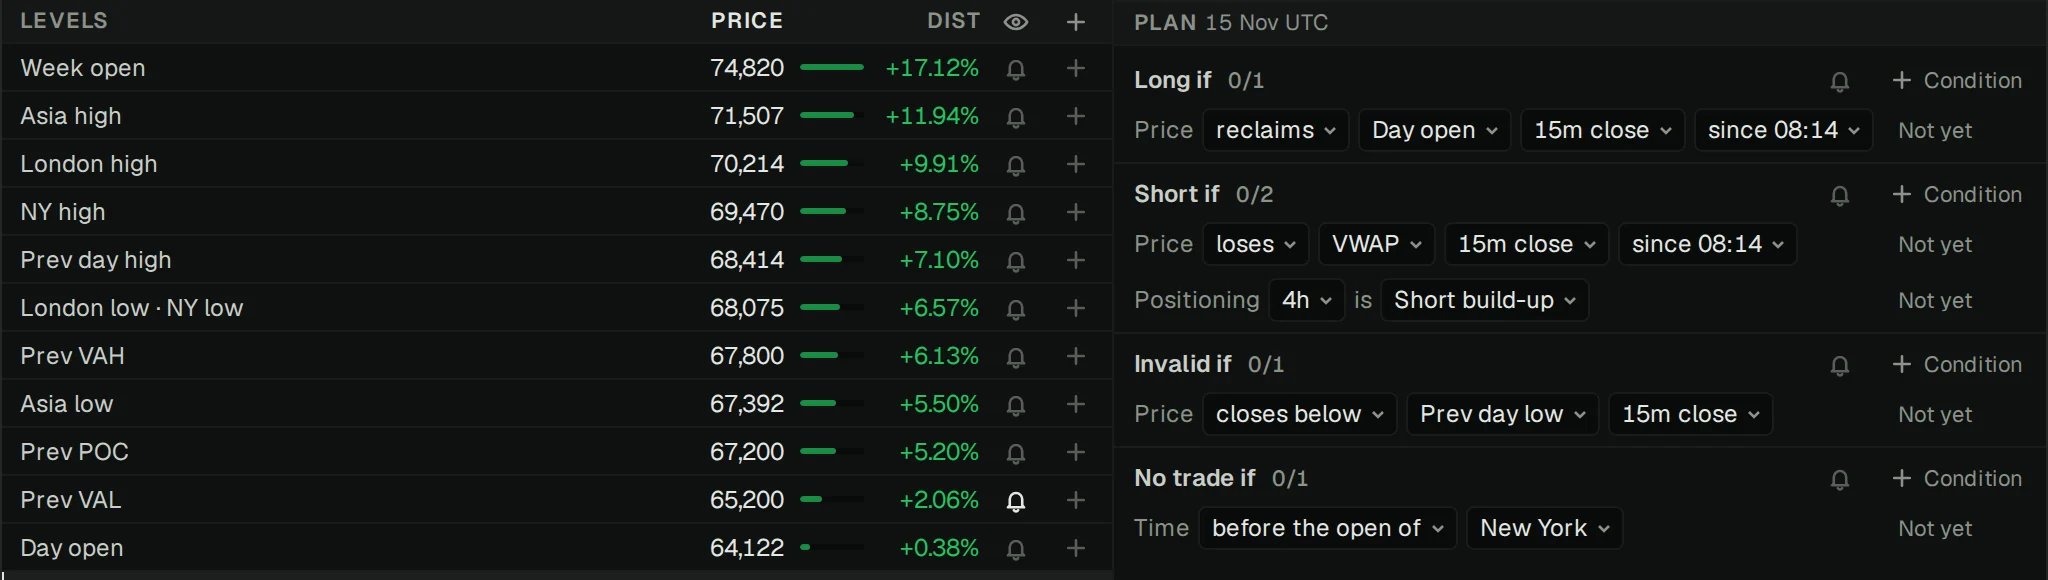
Below the levels is the day’s plan, in four parts: Long if, Short if, Invalid if and No trade if. Each holds the conditions that must be true, and the Terminal checks every one live. The quickest way in is a level’s +: pick the part, and it adds a condition on that level.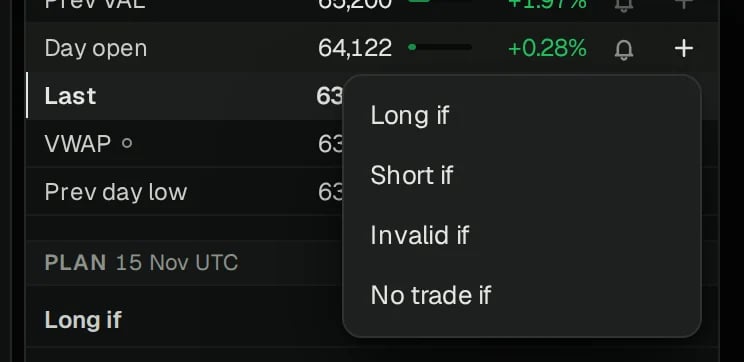
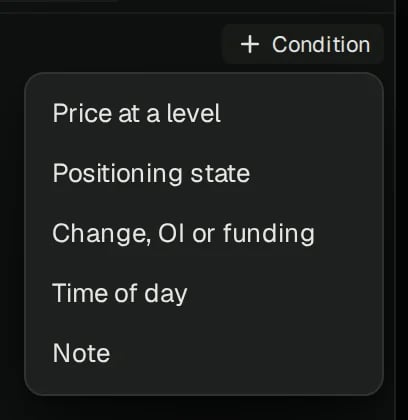
- Price at a level: price reclaims, loses, closes above or below, holds above or below (3 closes), sweeps or trades above or below a level, or is inside or outside two levels. On 5-minute, 15-minute, 1-hour or 4-hour closes, counted since you added it, this session or today.
- Positioning state: what open interest and taker flow read as over 1, 4 or 24 hours, such as Short build-up. In play’s State column reads the same way.
- Change, OI or funding: the price change, the change in open interest, or funding, above or below a percentage.
- Time of day: during, before the open of or after the open of a session.
- Note: anything else, in your own words. A note is never checked.
6. See the plan on the charts
The levels your plan uses draw on all three charts while the Game plan is on screen, each named at the right edge: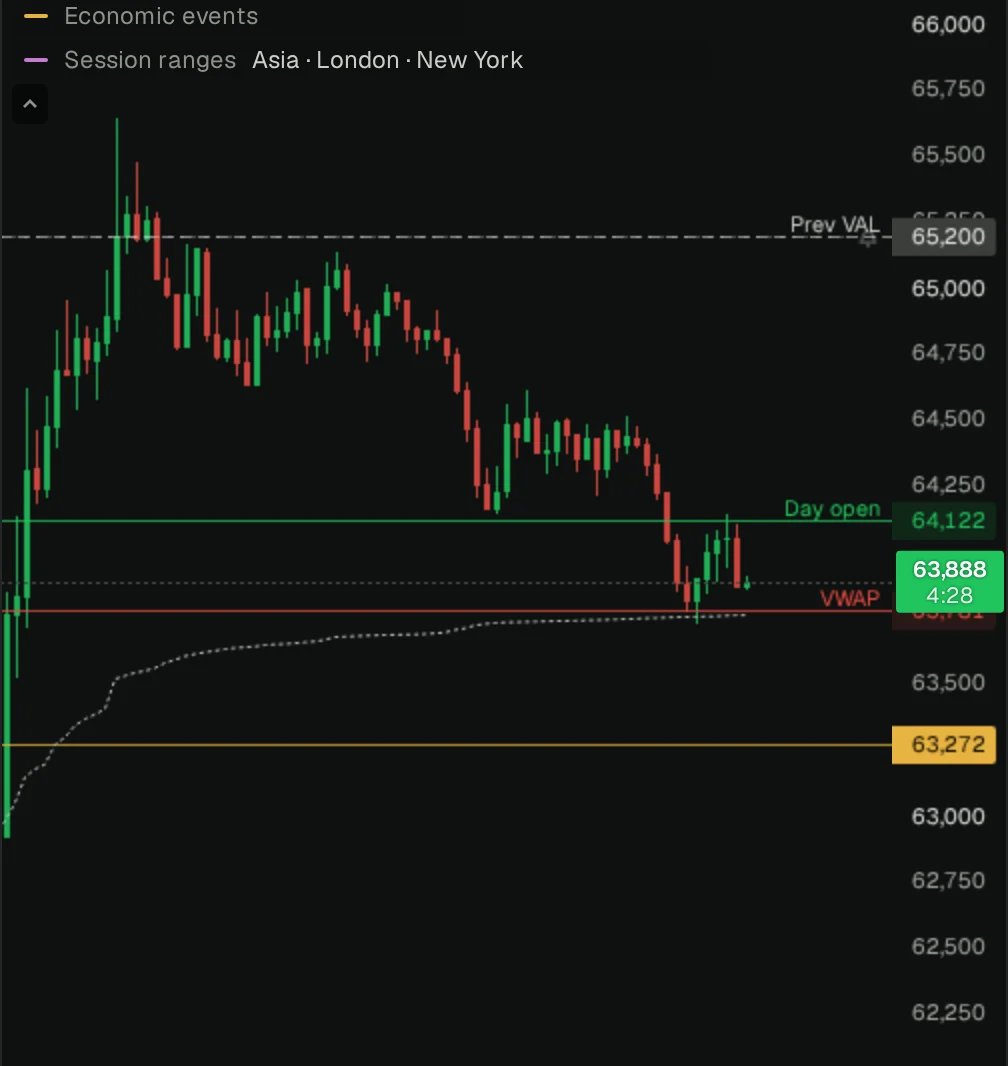
- A level a part uses is a solid line in its part’s colour: green for Long if, pink for Short if, amber for Invalid if and No trade if.
- Your own levels and levels with an alert are dashed.
7. Know what’s on the calendar
US economic releases mark every chart, at its foot: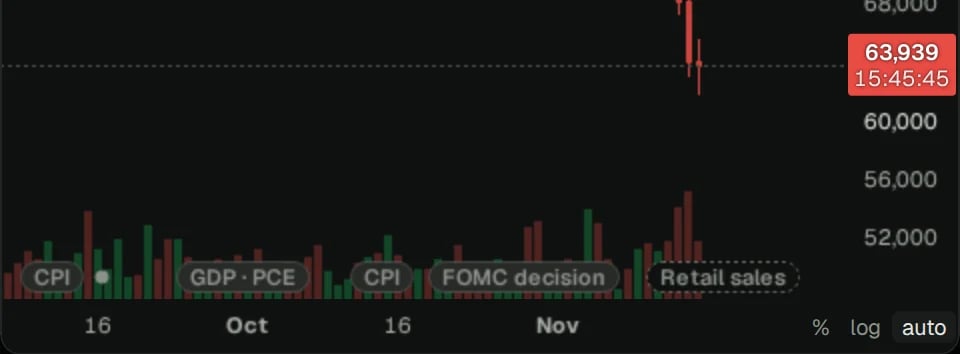
- A release past is a filled tag. One still ahead is dashed, and the next beyond the chart’s right edge is pinned there with its countdown, such as Retail sales 2d 5h ›.
- A tag turns amber in the hour before its release.
- Point at a tag to draw a line up the chart at its time.
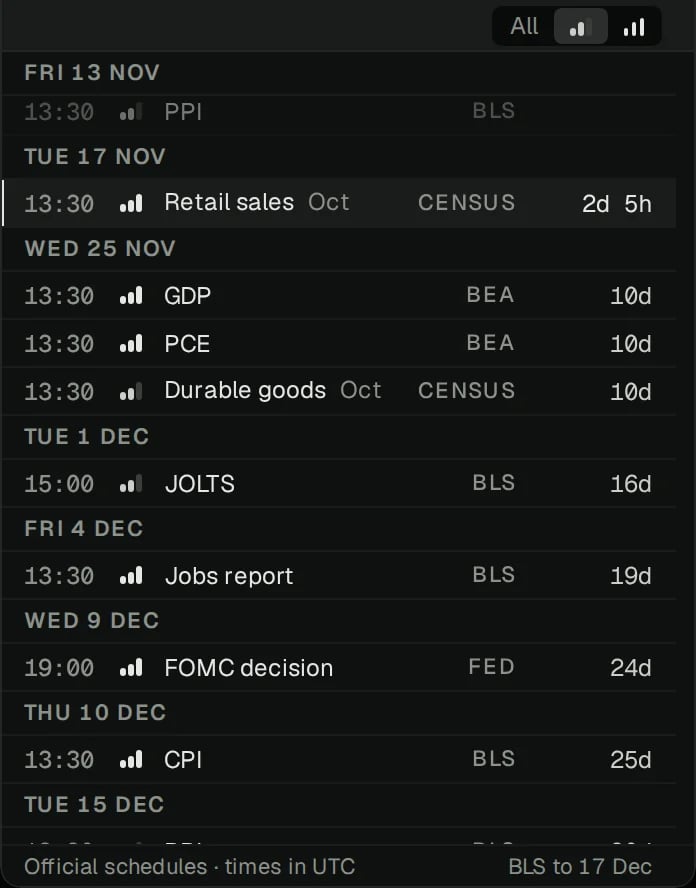
- Each row has the time, its impact (1 to 3 bars), the release, the agency and a countdown. A release reads out for 30 minutes after.
- All, Medium+ and High pick the releases shown. It opens on Medium+.
- High: FOMC decision, CPI, Jobs report, GDP, PCE and Retail sales. Medium: FOMC minutes, PPI, JOLTS, Employment cost index and Durable goods.
- Click a row to open the agency’s release page.