

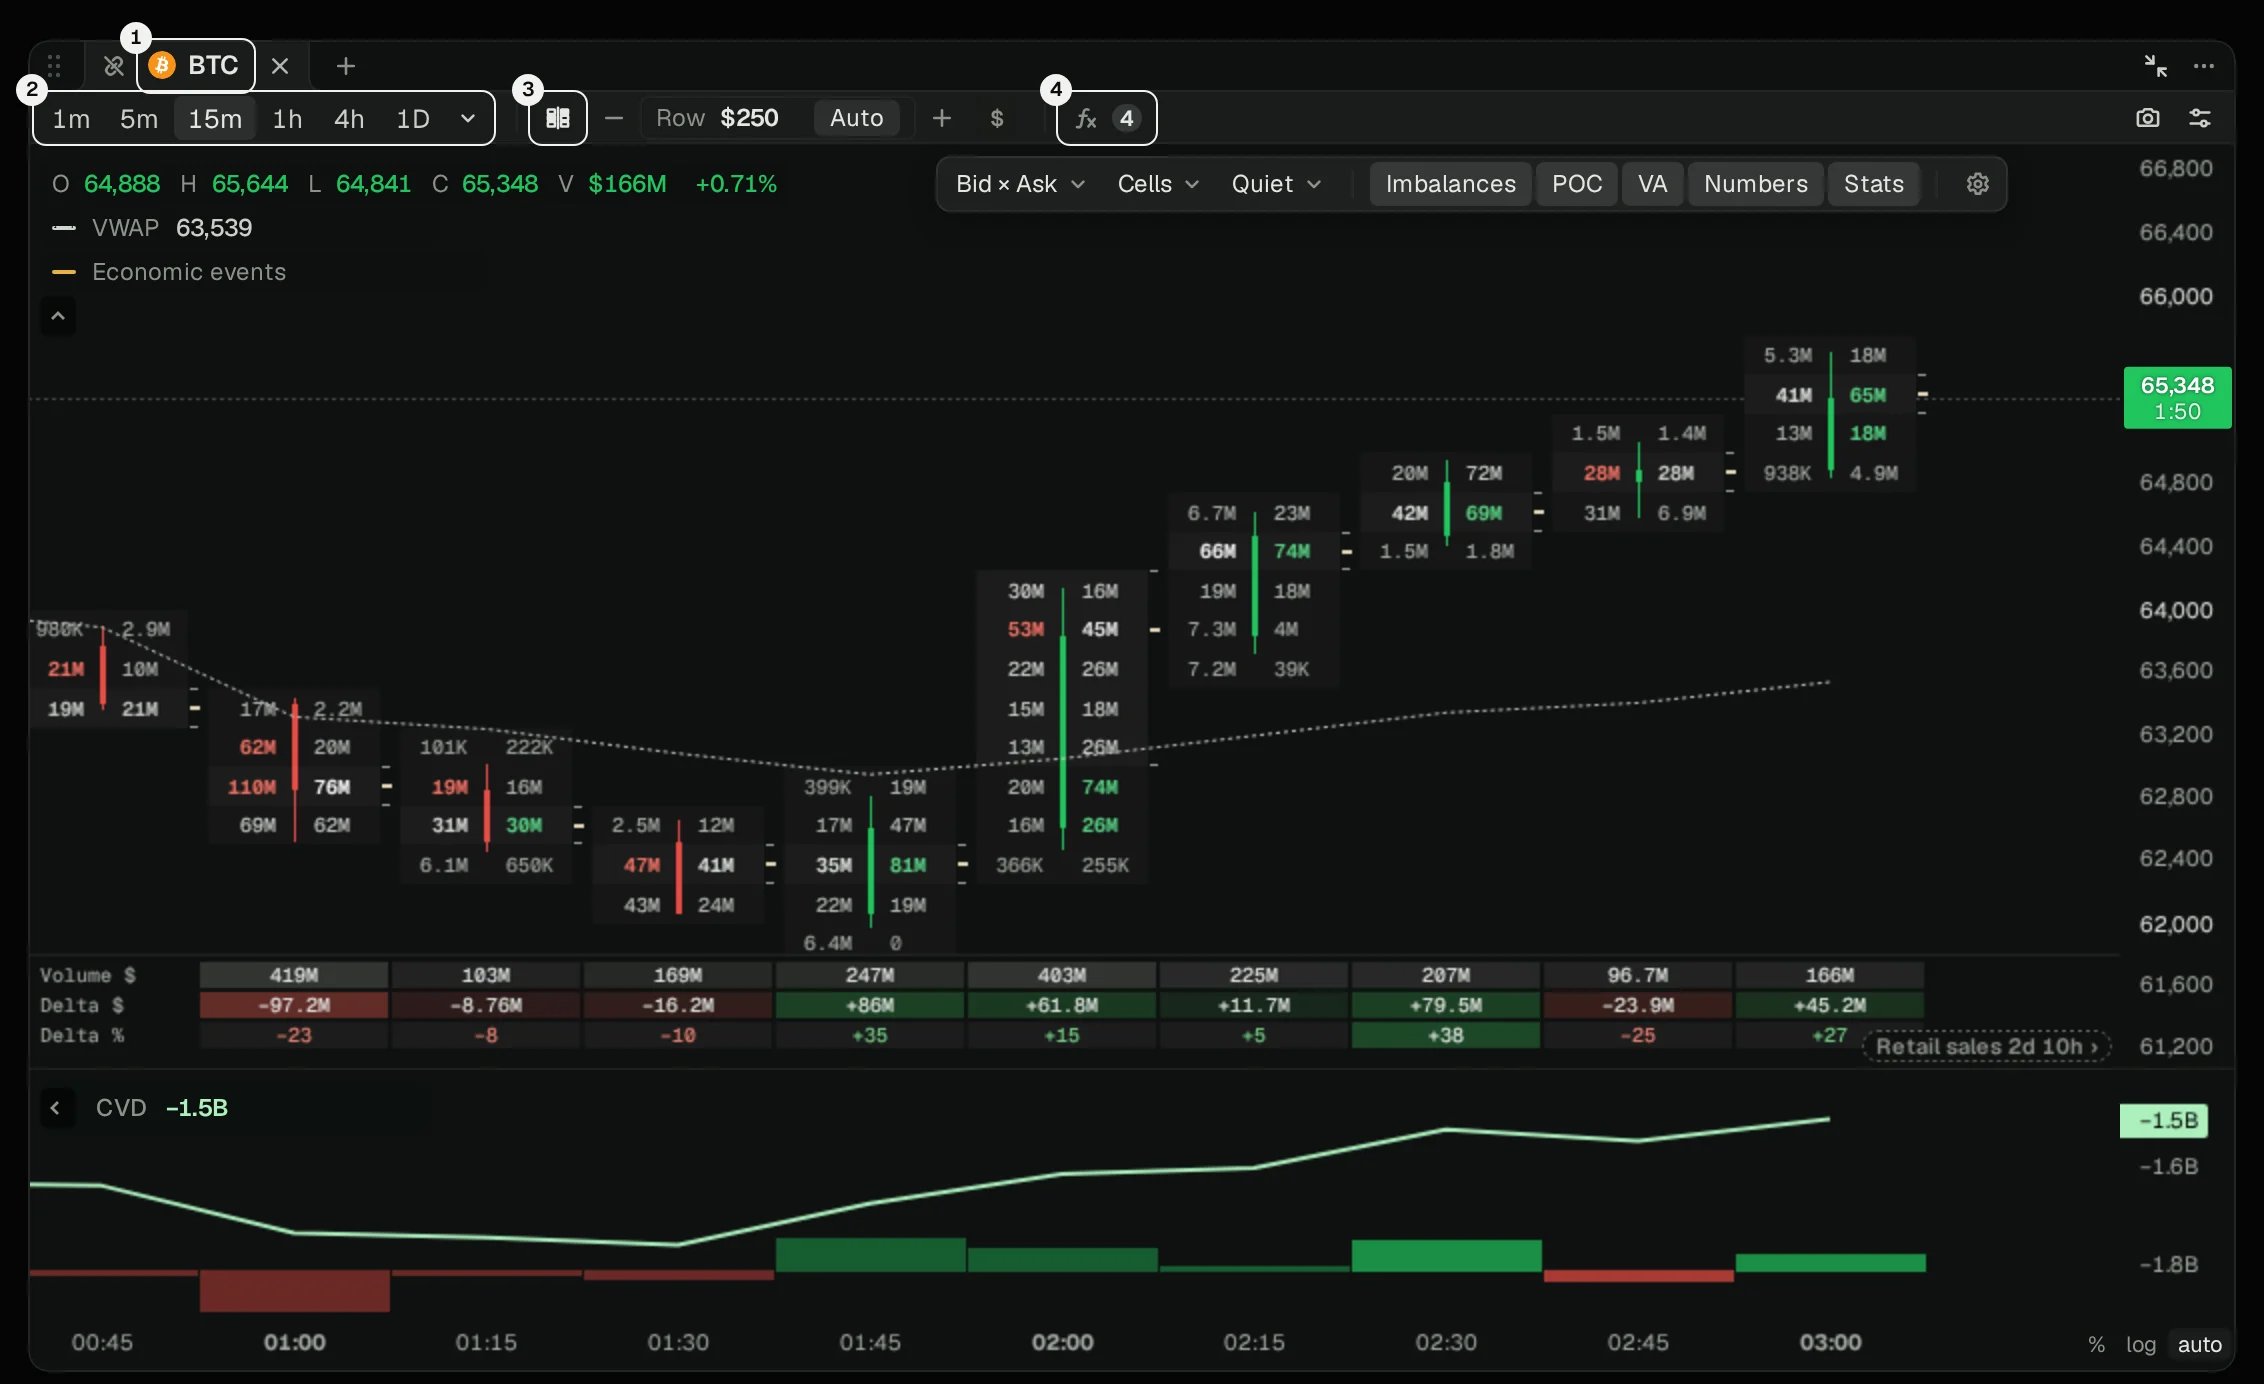
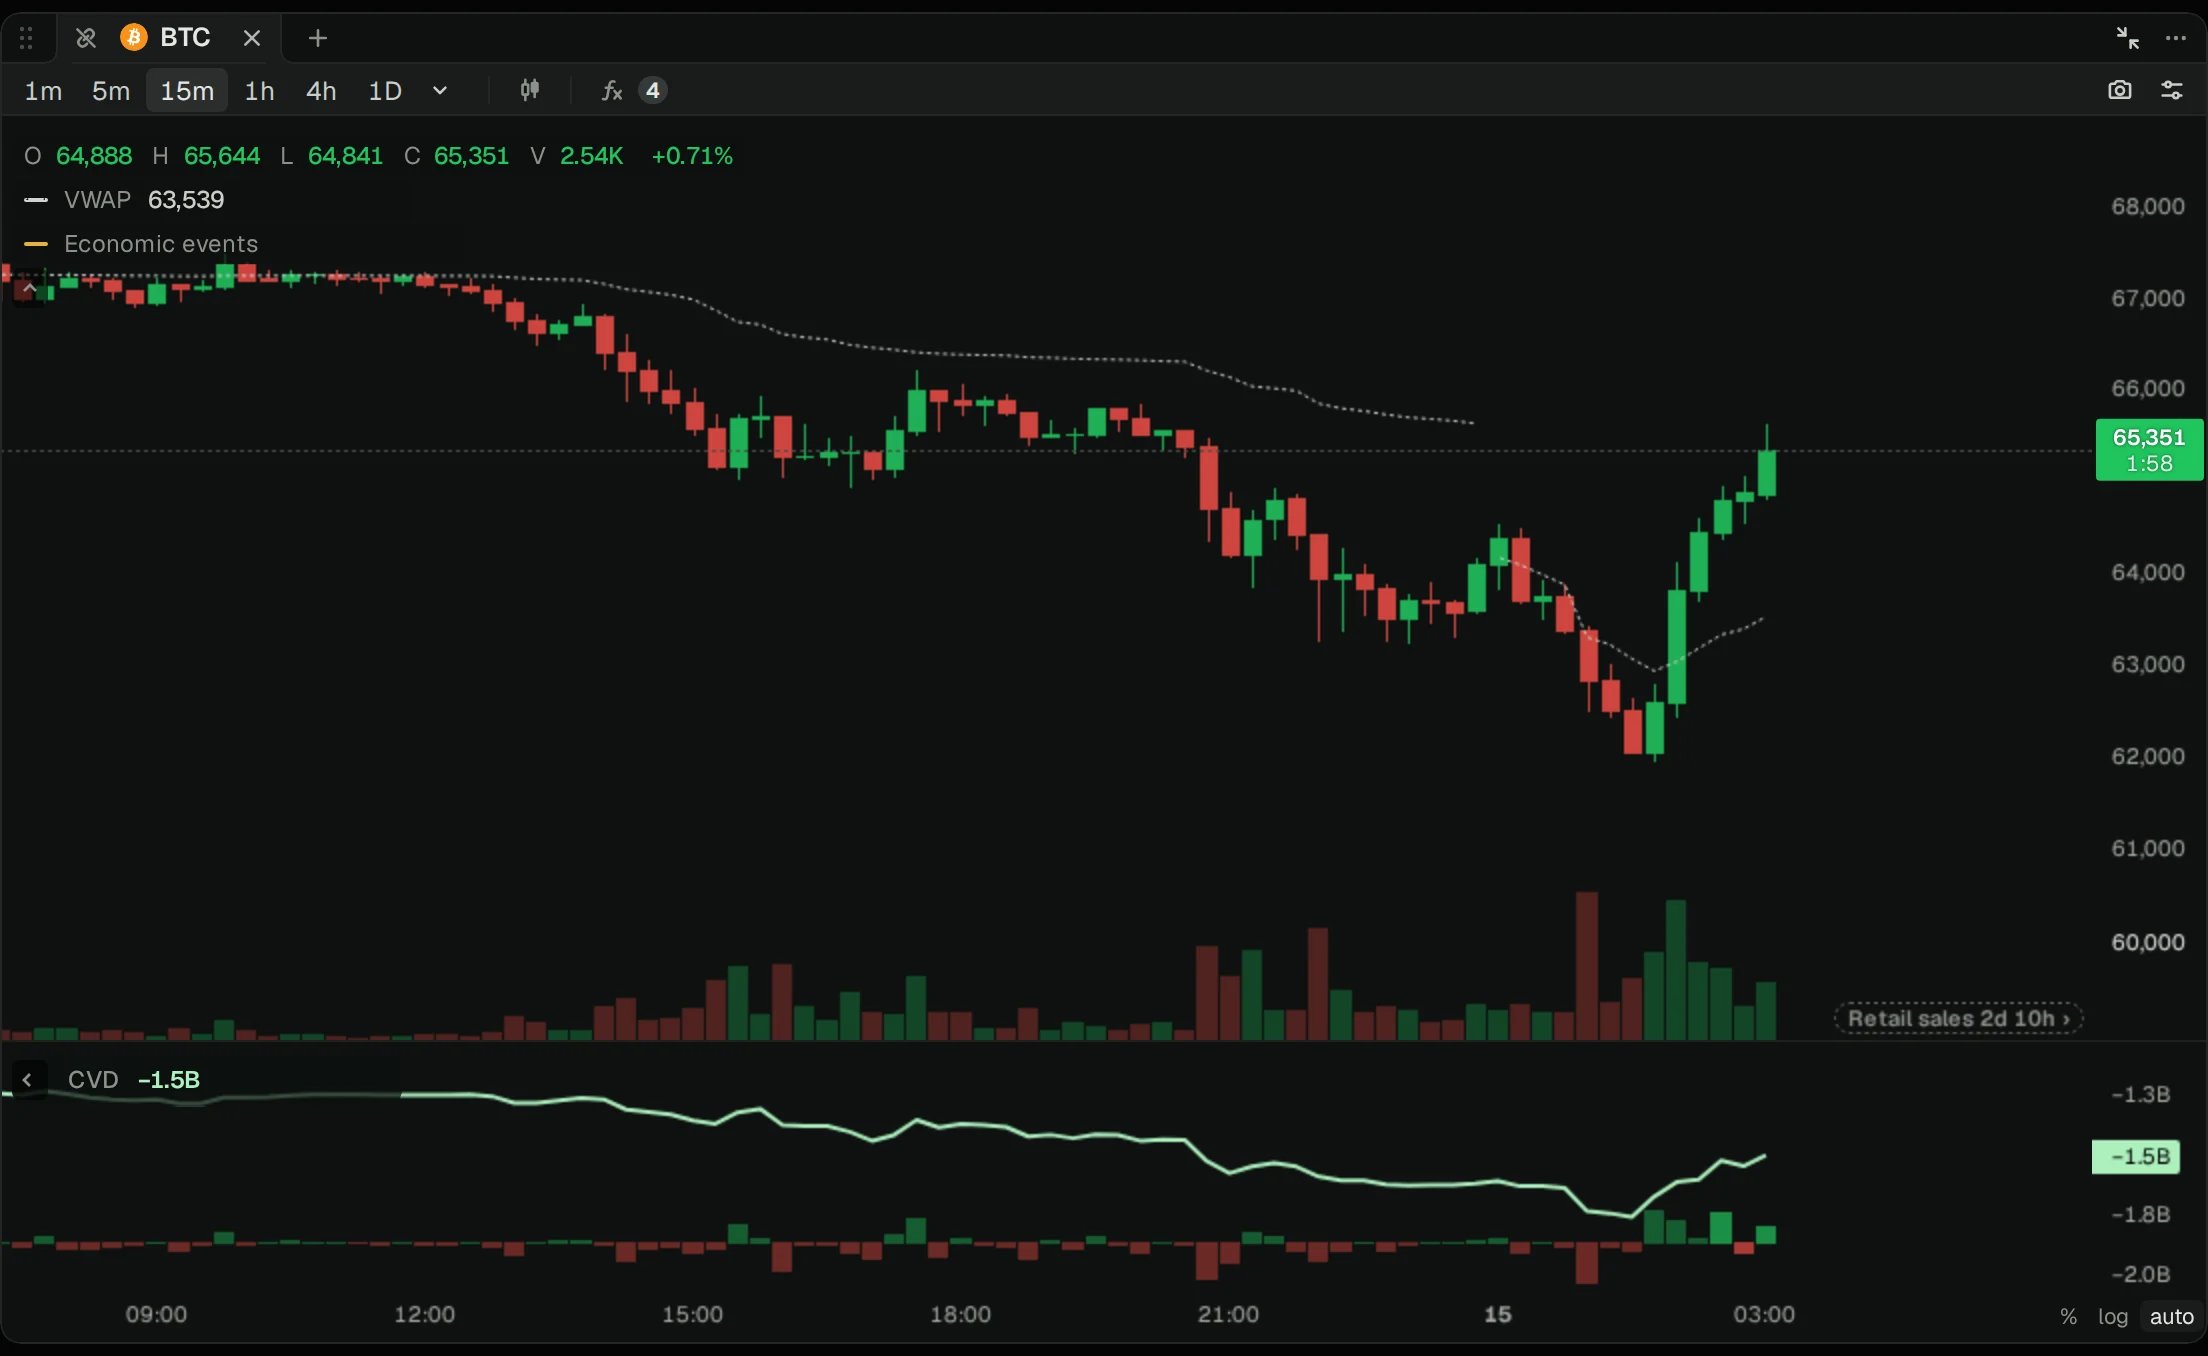
BTC on 15-minute footprint bars, with VWAP and CVD. Four controls built it.
- Market: which market and which venue.
- Timeframe: how much time, or how many trades, each bar holds.
- Chart type: candles, a footprint, a profile or TPO.
- Indicators: what’s drawn over the bars and in panes under them.
1. Pick a market
Click the market name on the chart’s tab, or press ⌥⇧S from anywhere.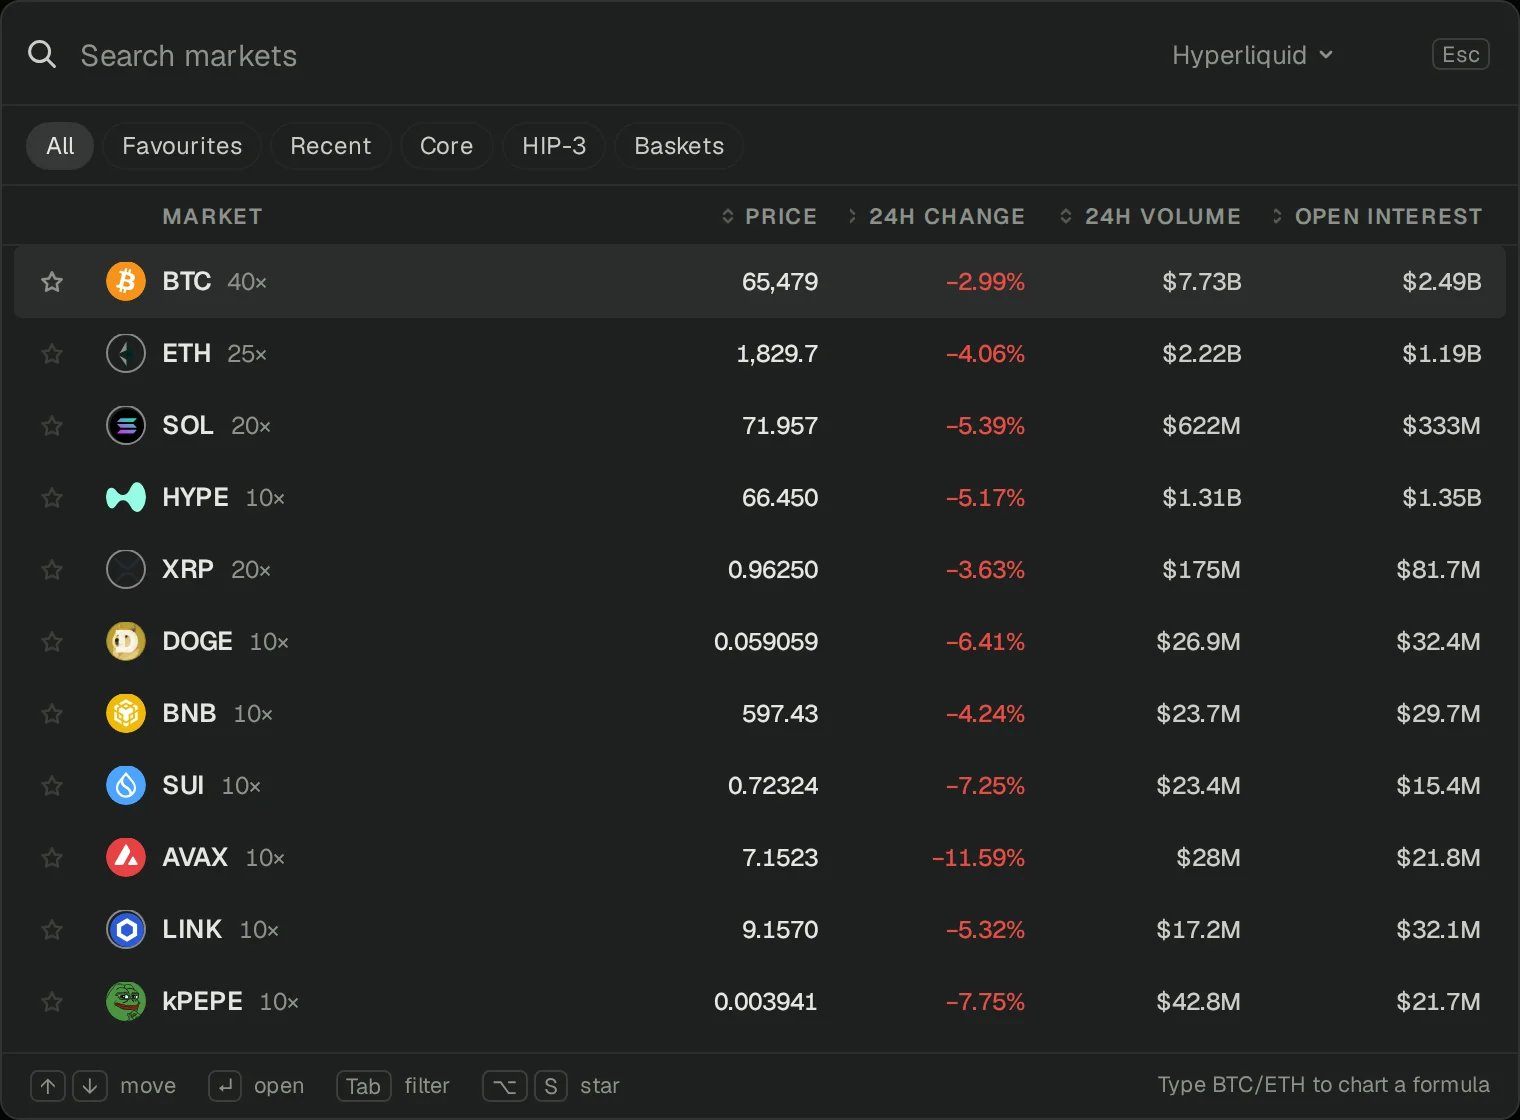
- Venue: the switch at the top right picks Hyperliquid or Lighter.
- Filters: All, Favourites, Recent, Core, HIP-3 (stocks, indices and commodities on Hyperliquid) and Baskets.
- Sort: click any column. Sort by 24h change to find what’s moving, or by open interest to find where the money is.
- Favourites: the star, or ⌥S on a highlighted row. Favourites get their own filter.
- Formulas: type
BTC/ETHto chart one market against another.
2. Set the timeframe
The buttons along the top are your favourite intervals: one click each. The arrow beside them opens the full list.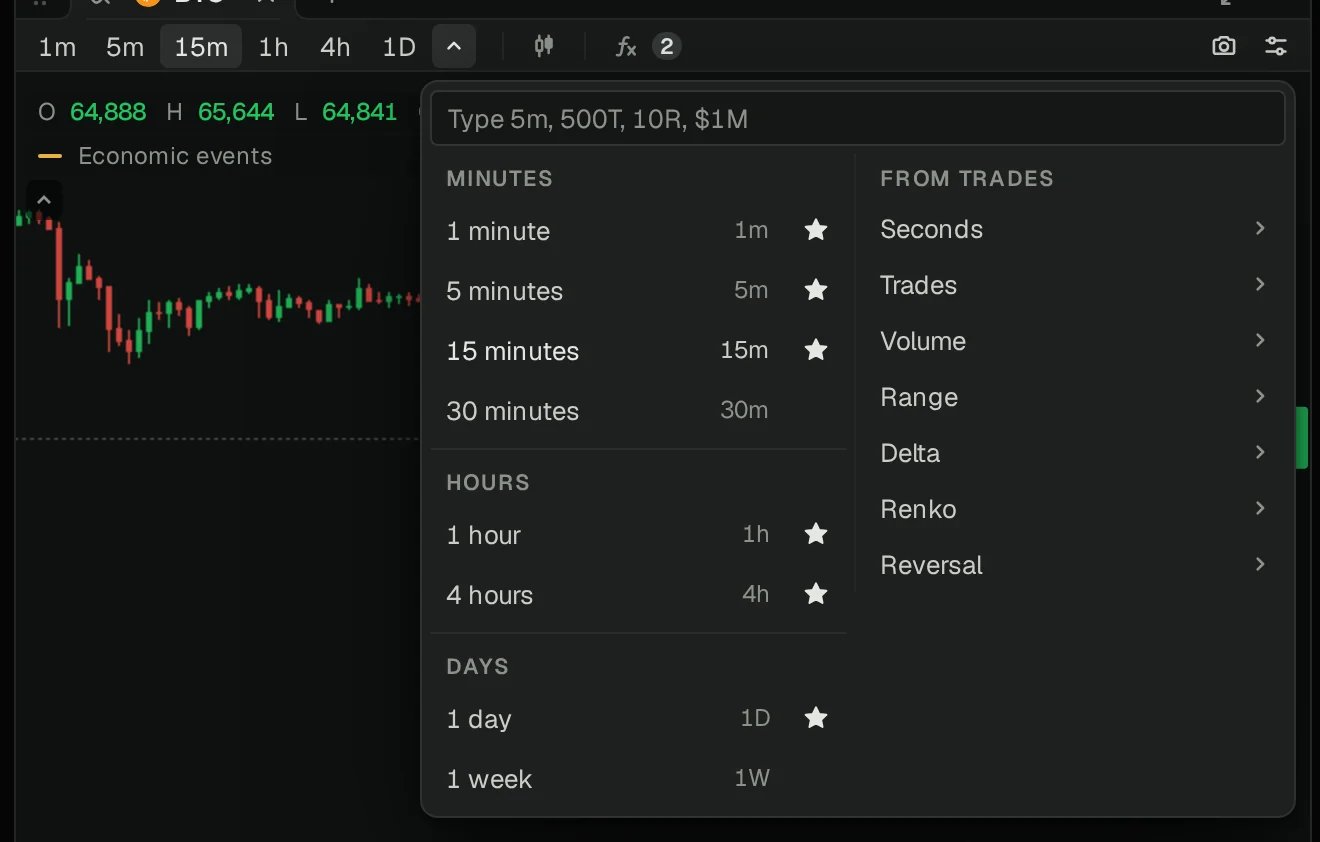
- Time bars: 1 minute to 1 week. Star one to put it on the button row.
- Bars from trades: Seconds, Trades, Volume, Range, Delta, Renko and Reversal. A 500-trade bar closes after 500 trades, however long that takes. These bars are built from every Hyperliquid trade.
- Type it: the box at the top takes any size.
5m,500T,10Rand$1Mall work.
3. Choose how bars are drawn
The chart type button sits right after the intervals.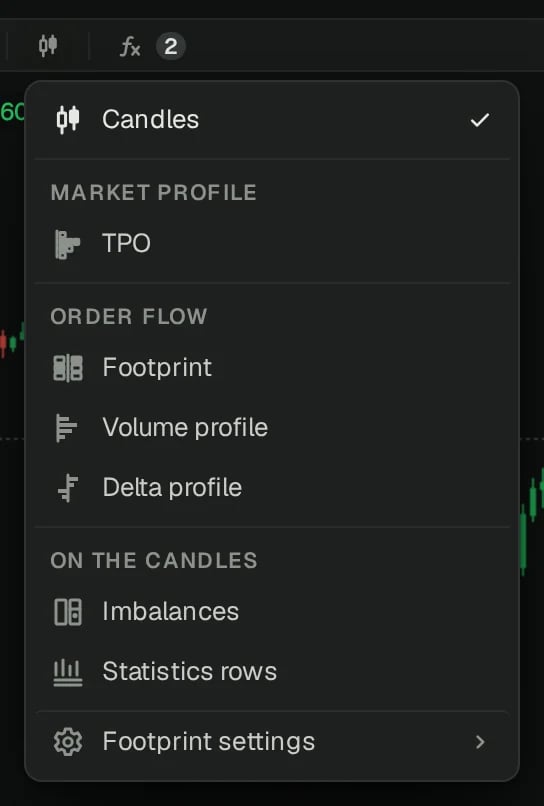
- Candles
- Footprint
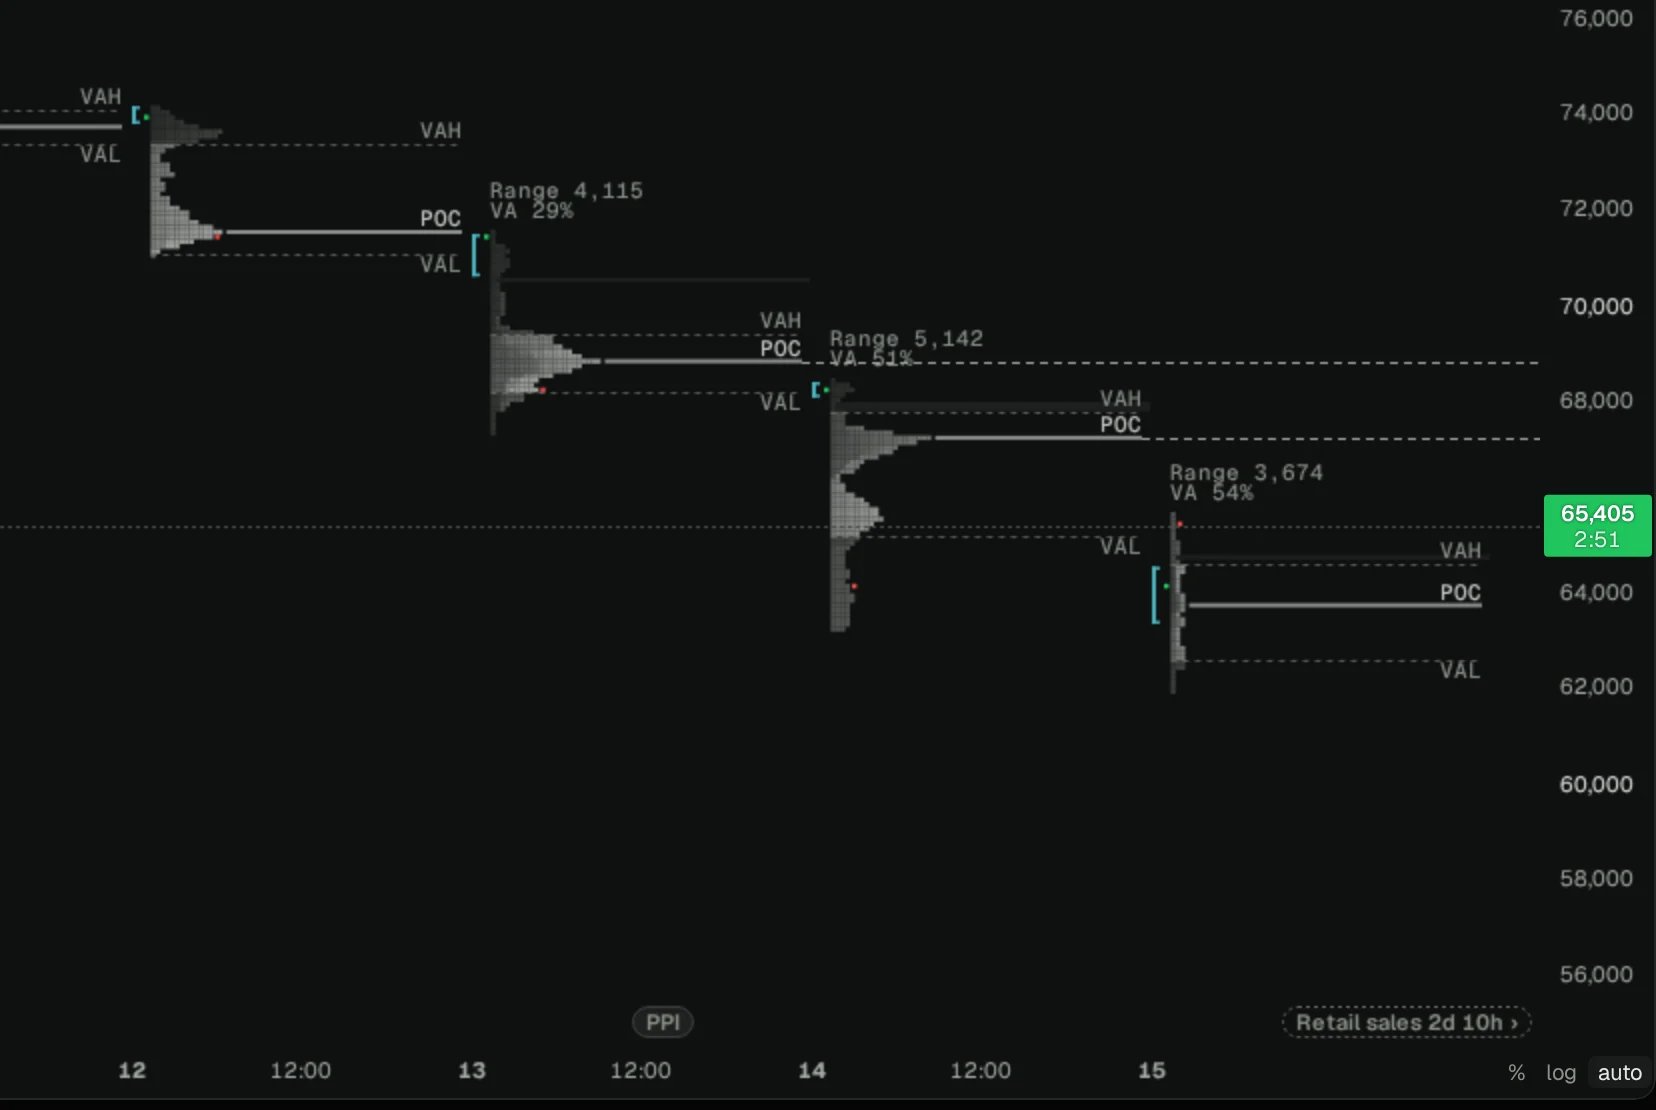
- Volume profile
- Delta profile
- TPO
Open, high, low and close. Where price went.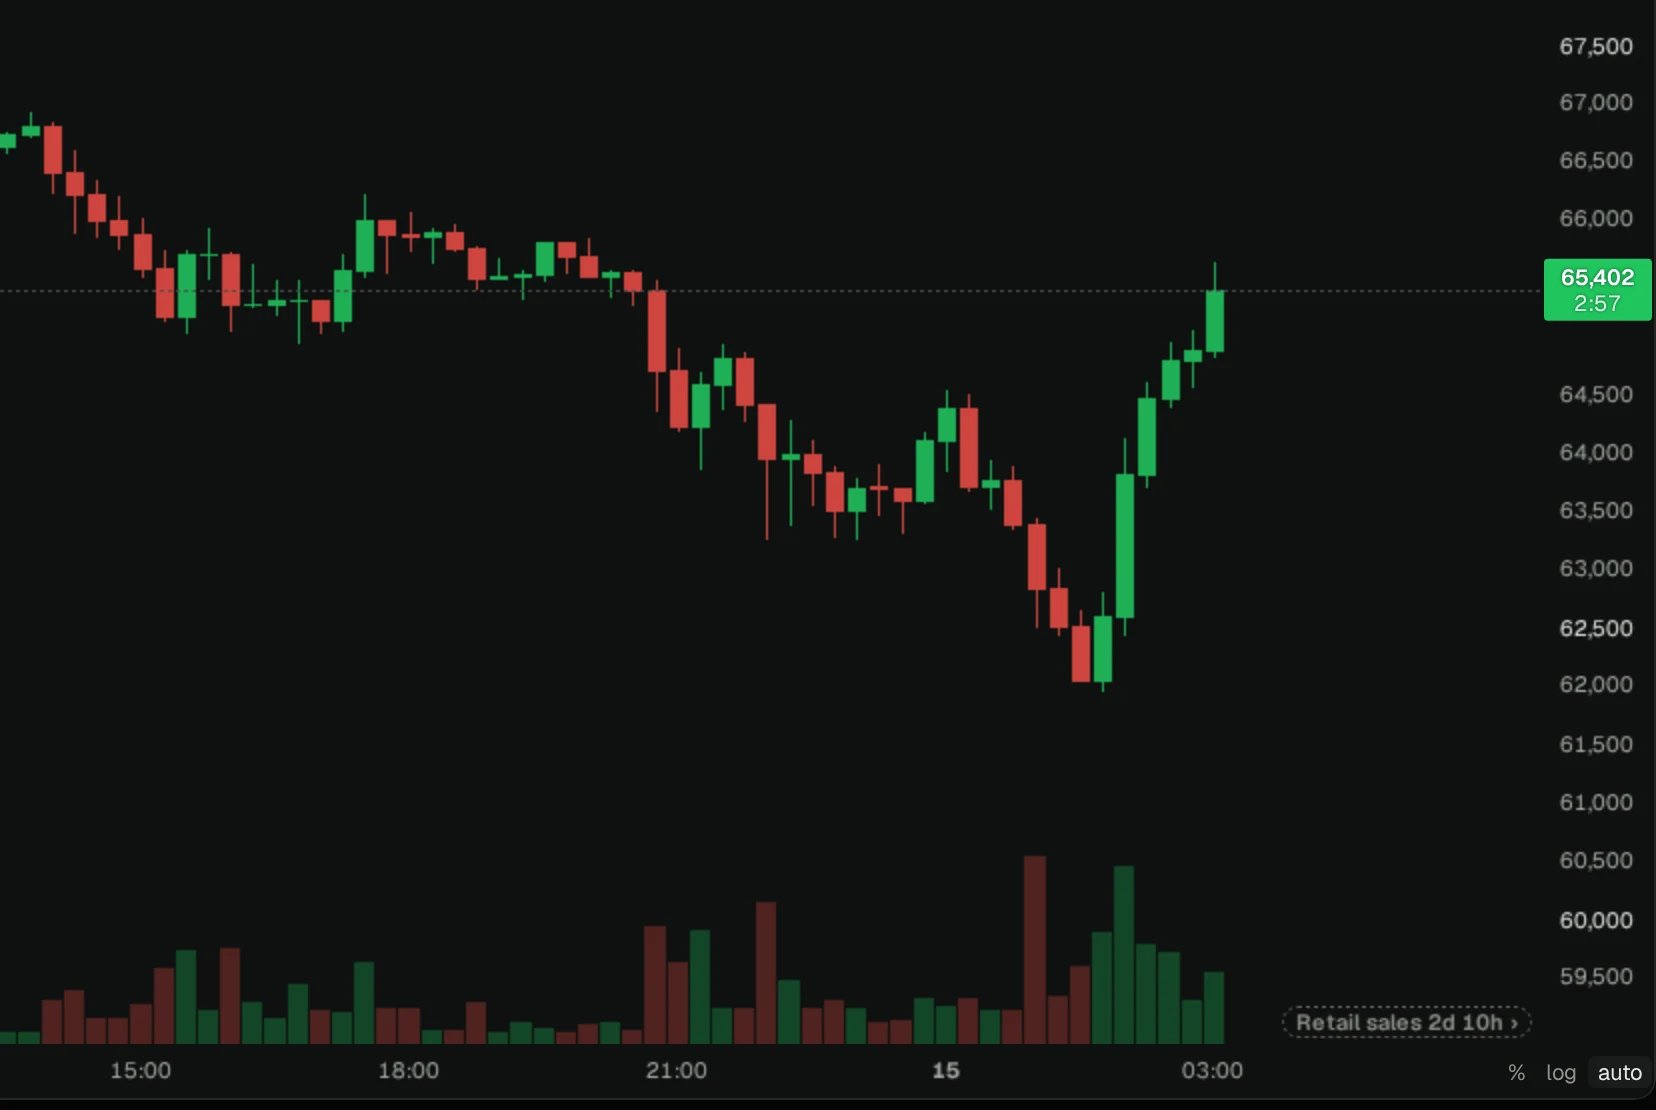
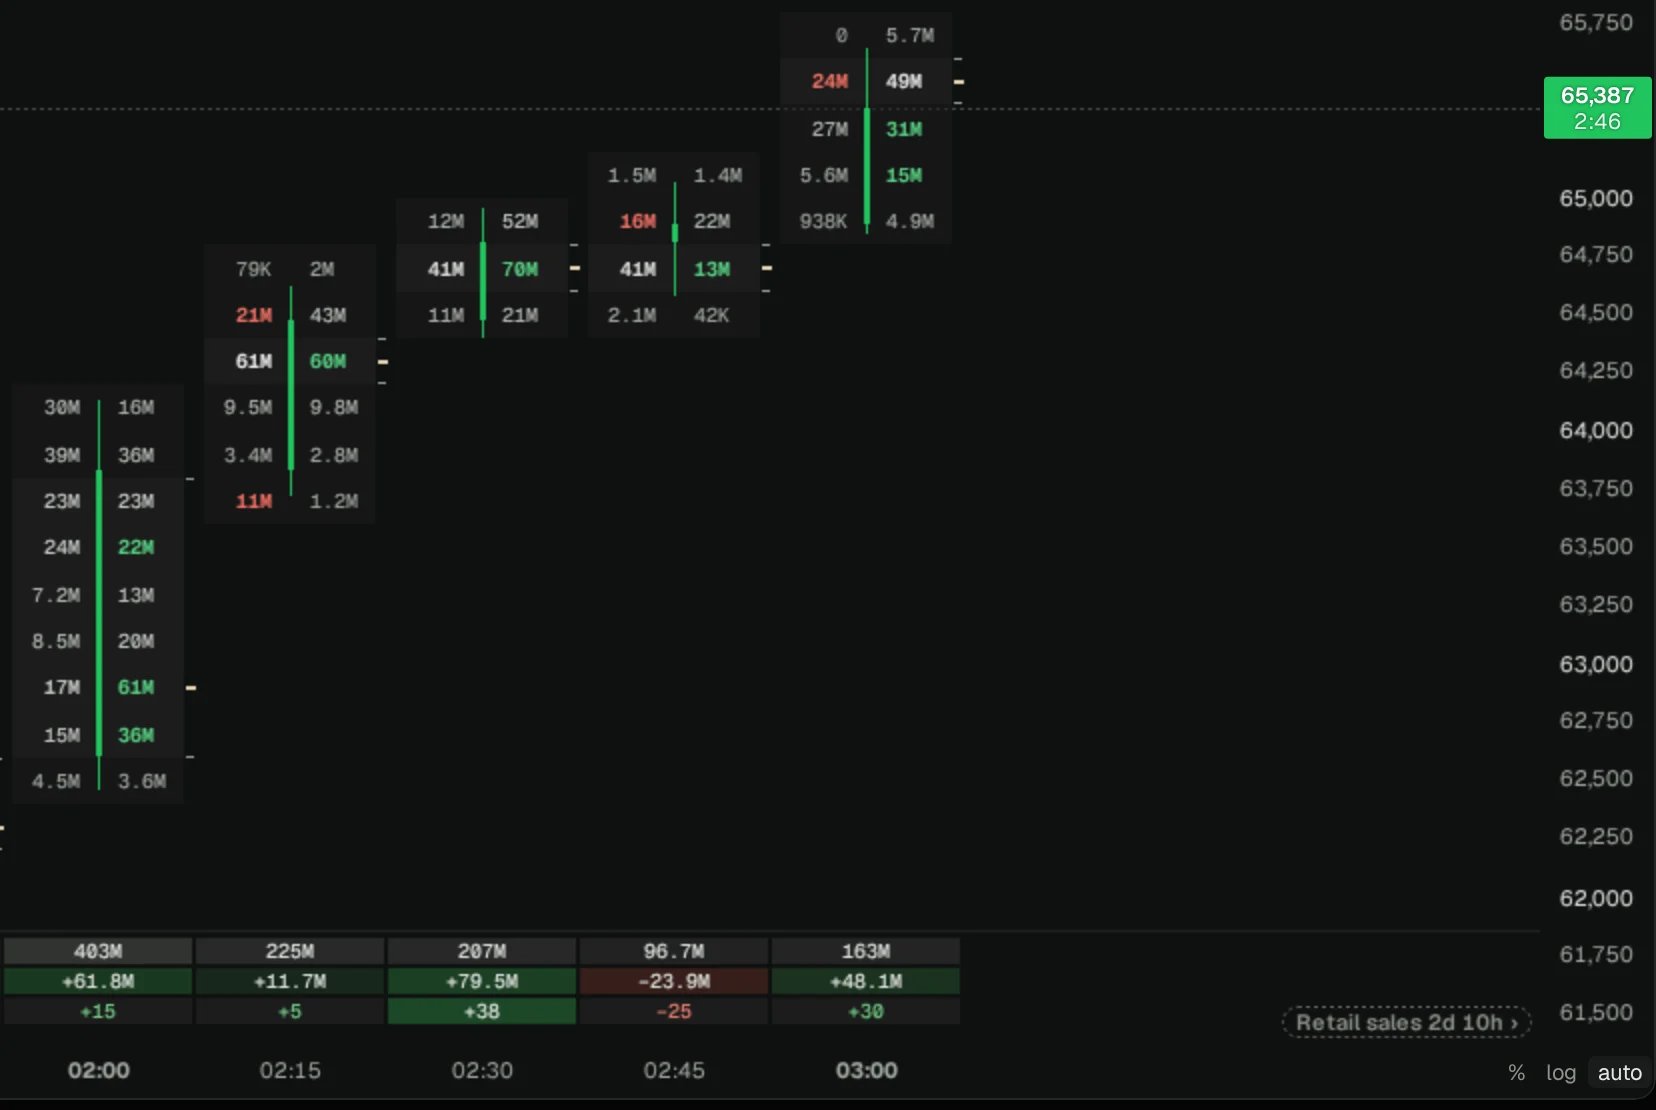
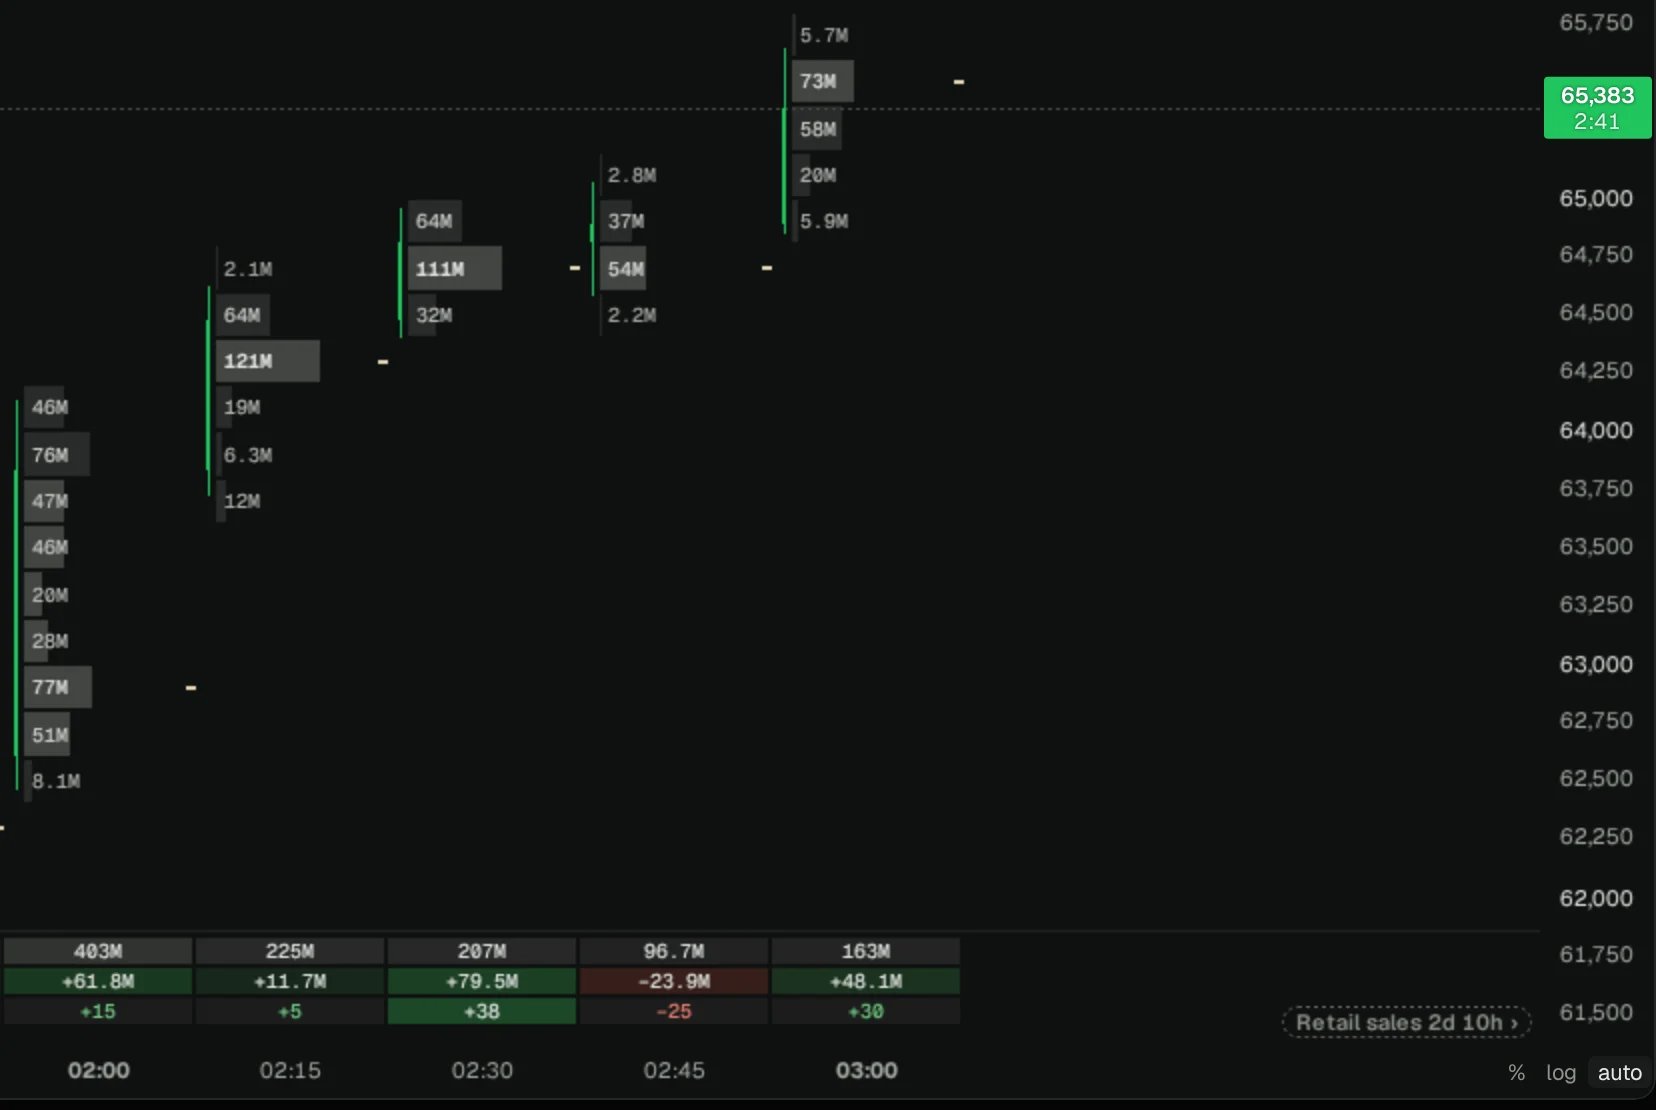
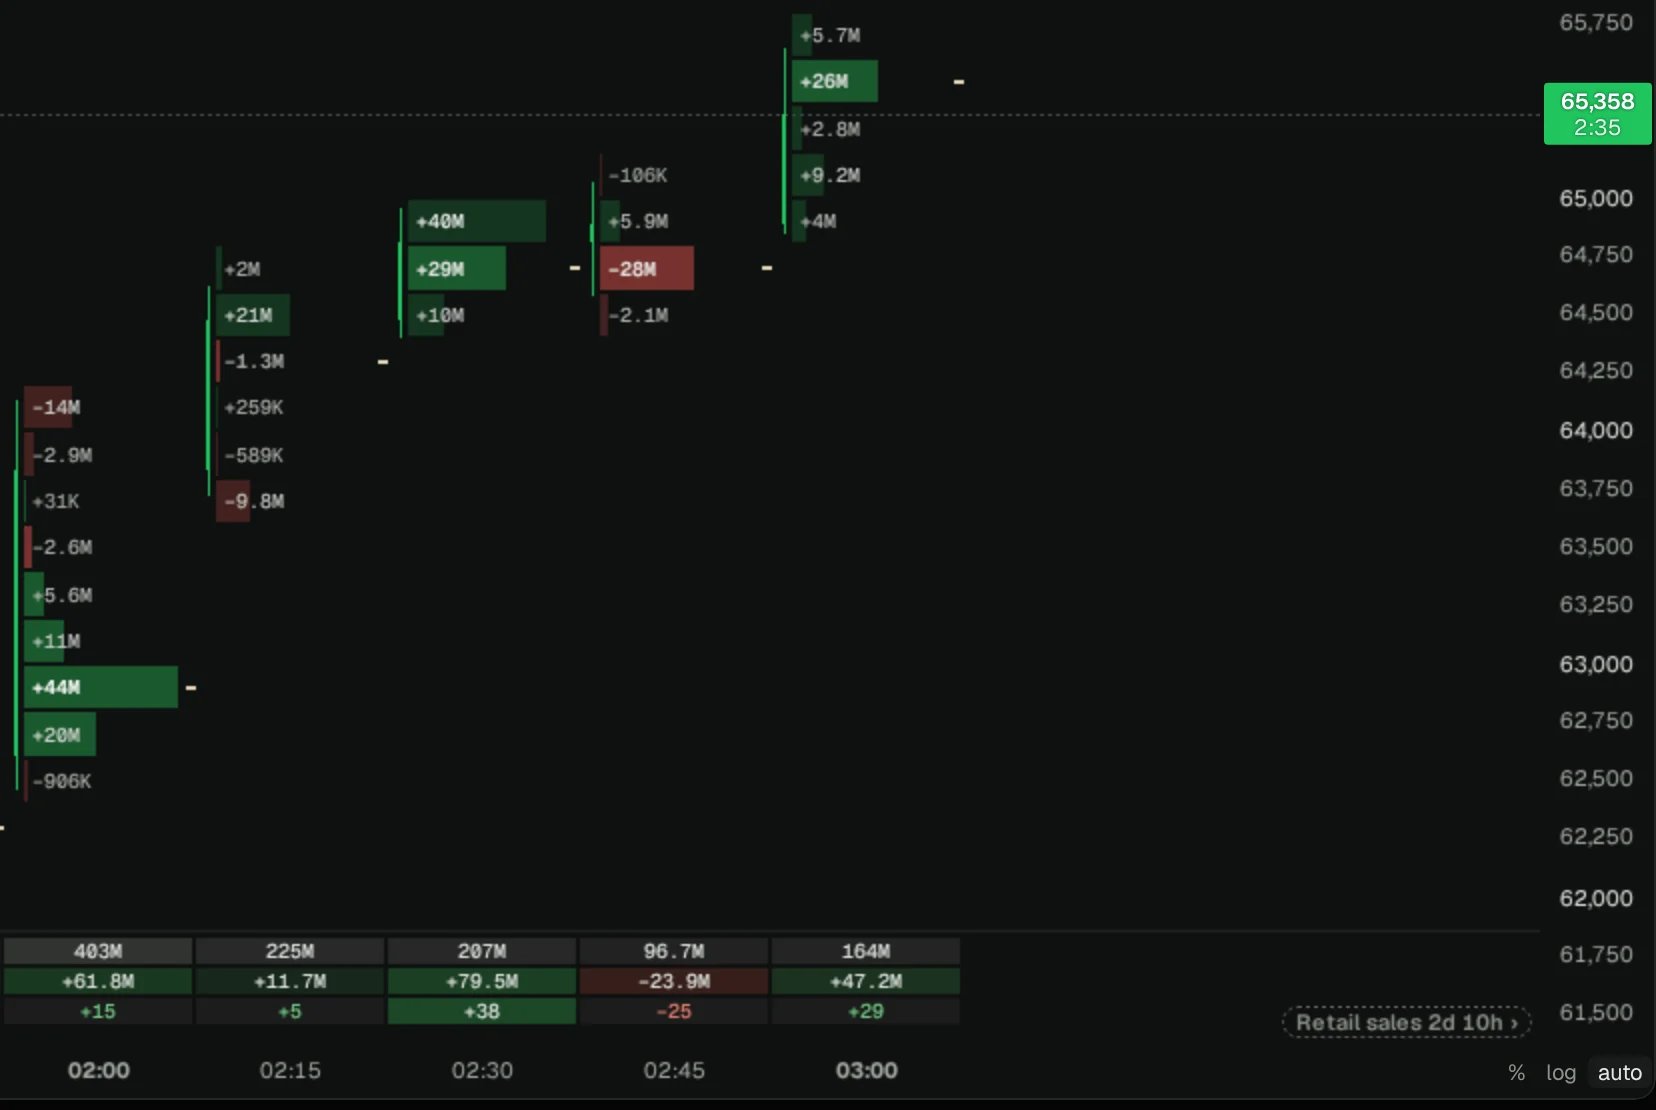
- Imbalances
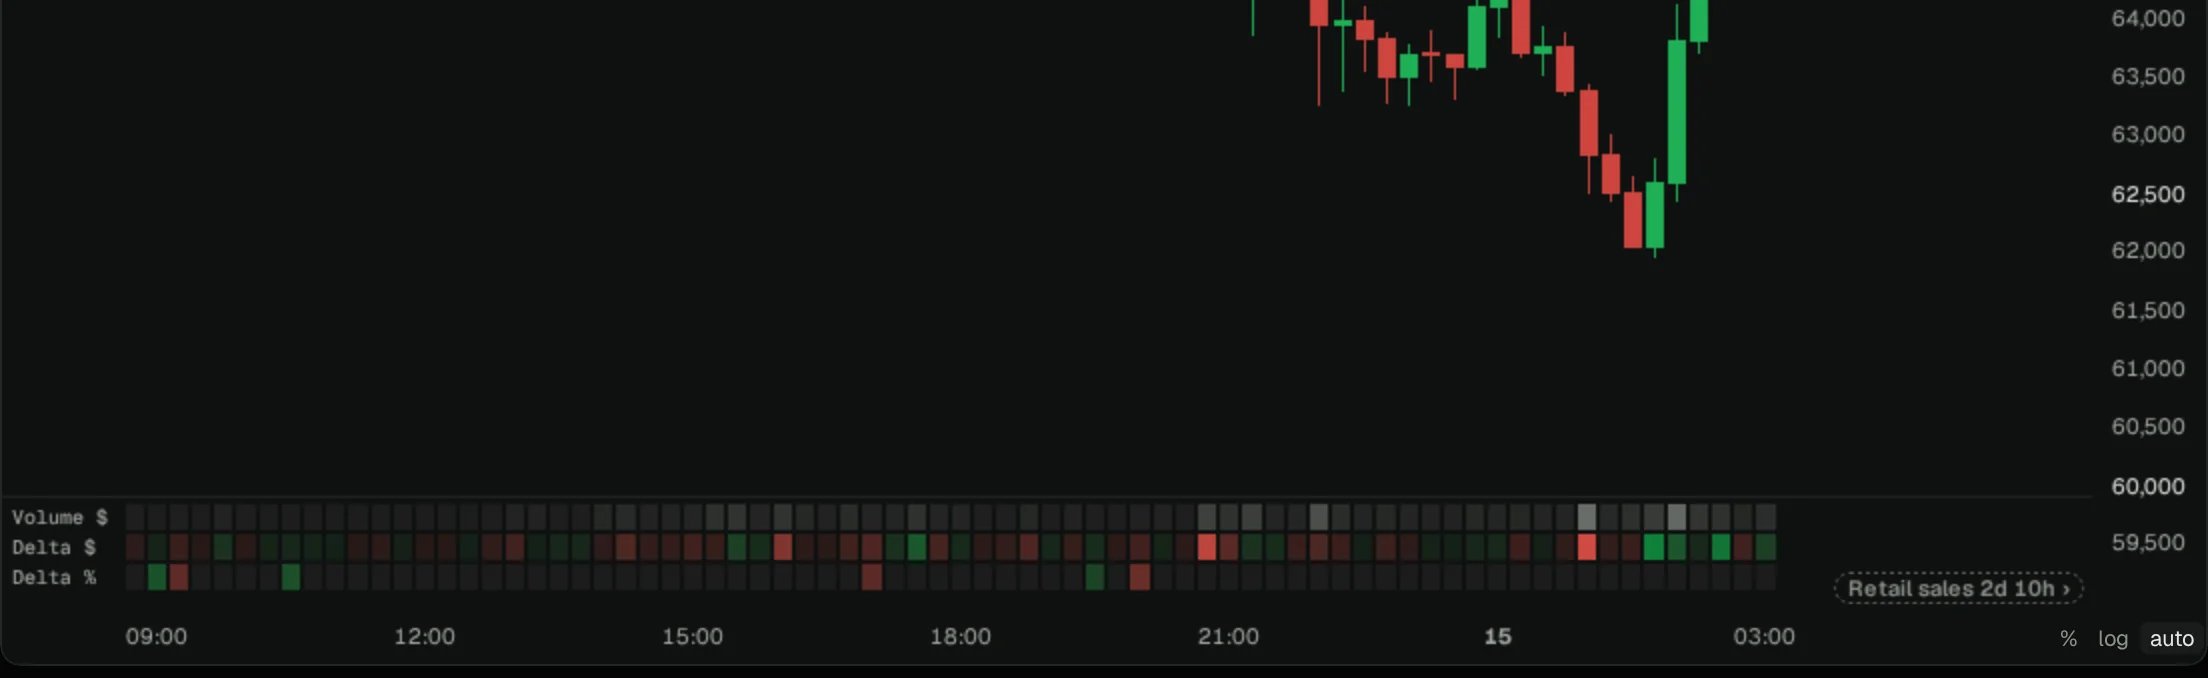
- Statistics rows
Marks the prices where one side traded 3x the other, and draws a box out from each run of them.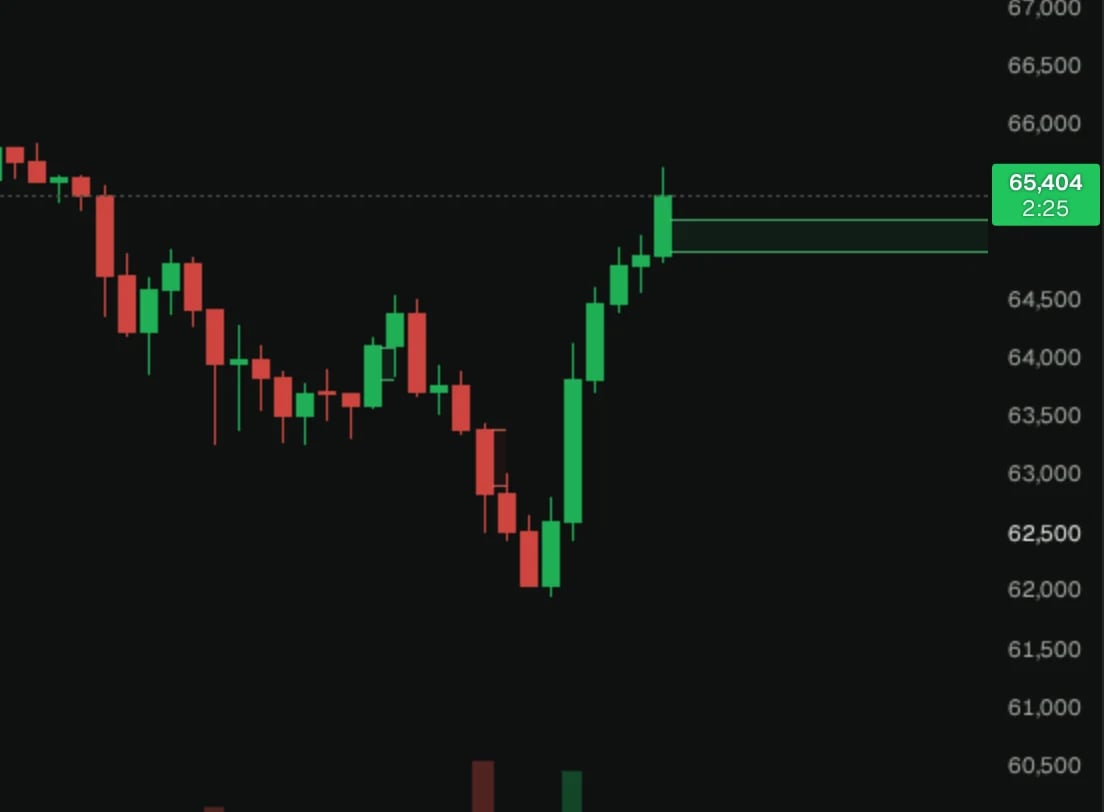
4. Add indicators
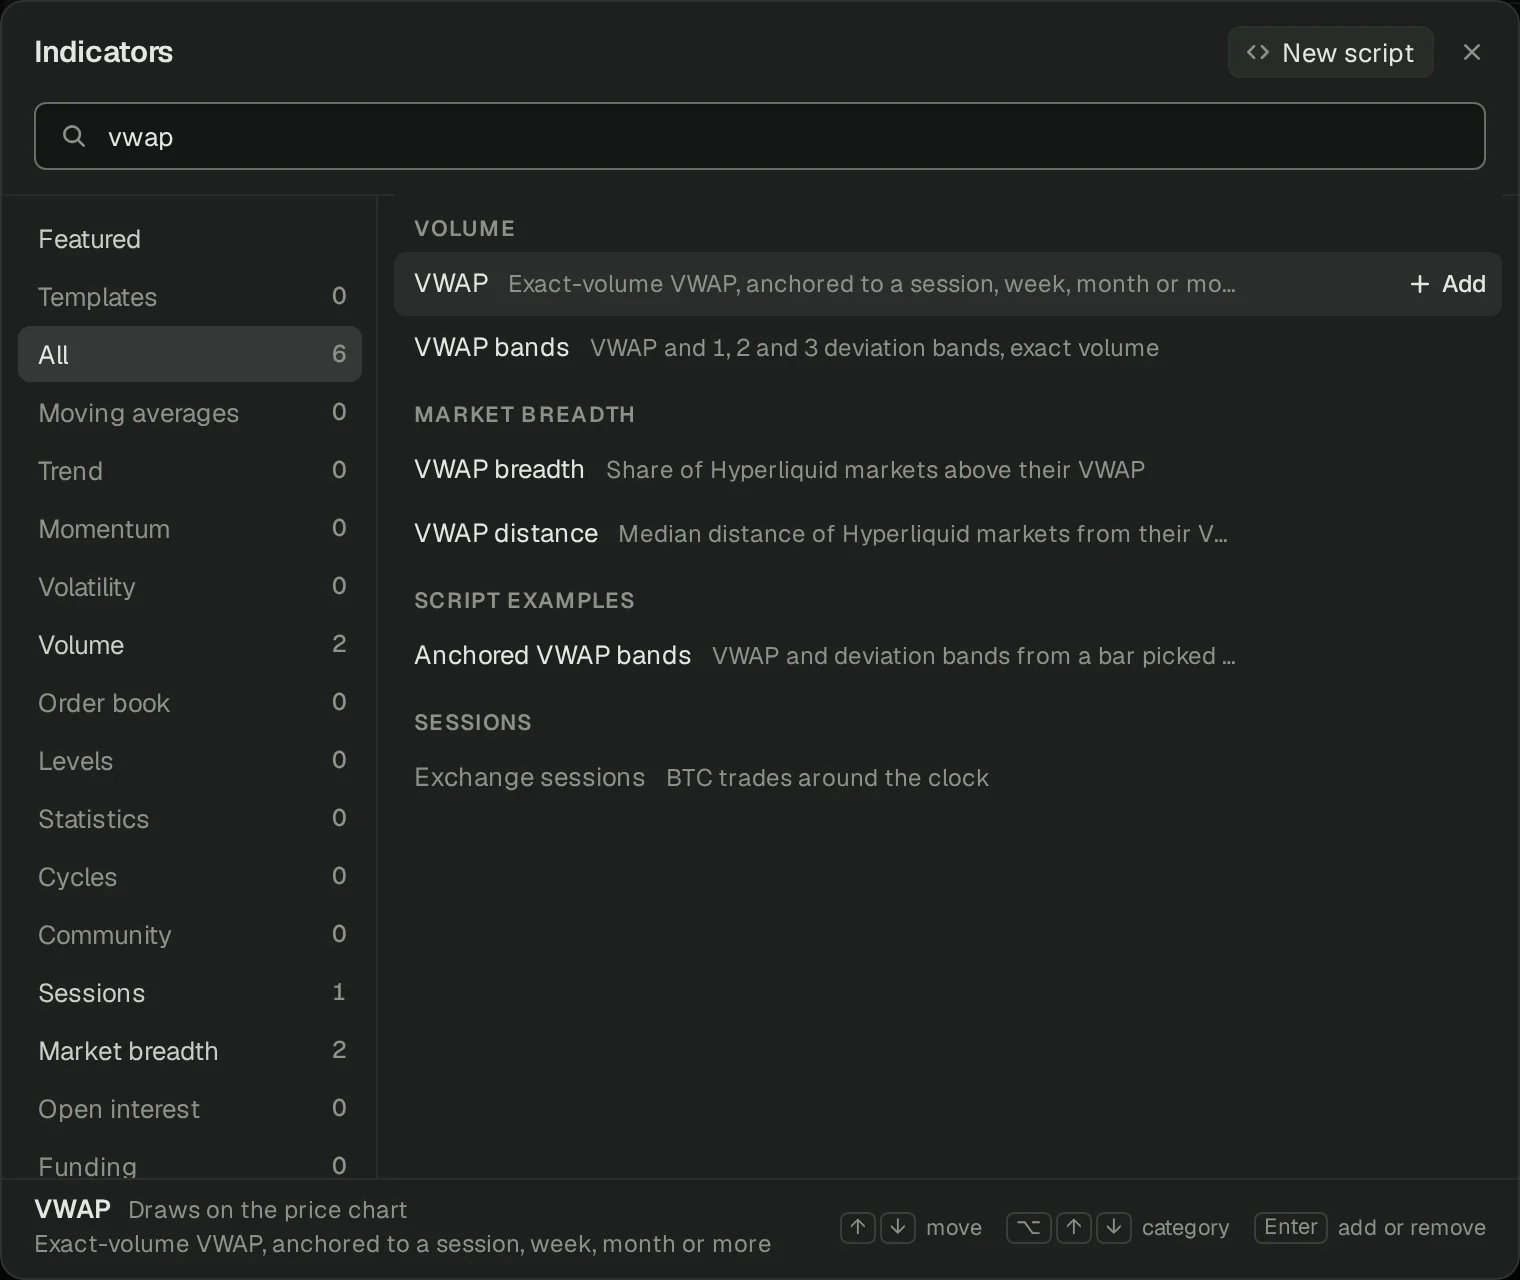
Click fx, or press/ on the chart.
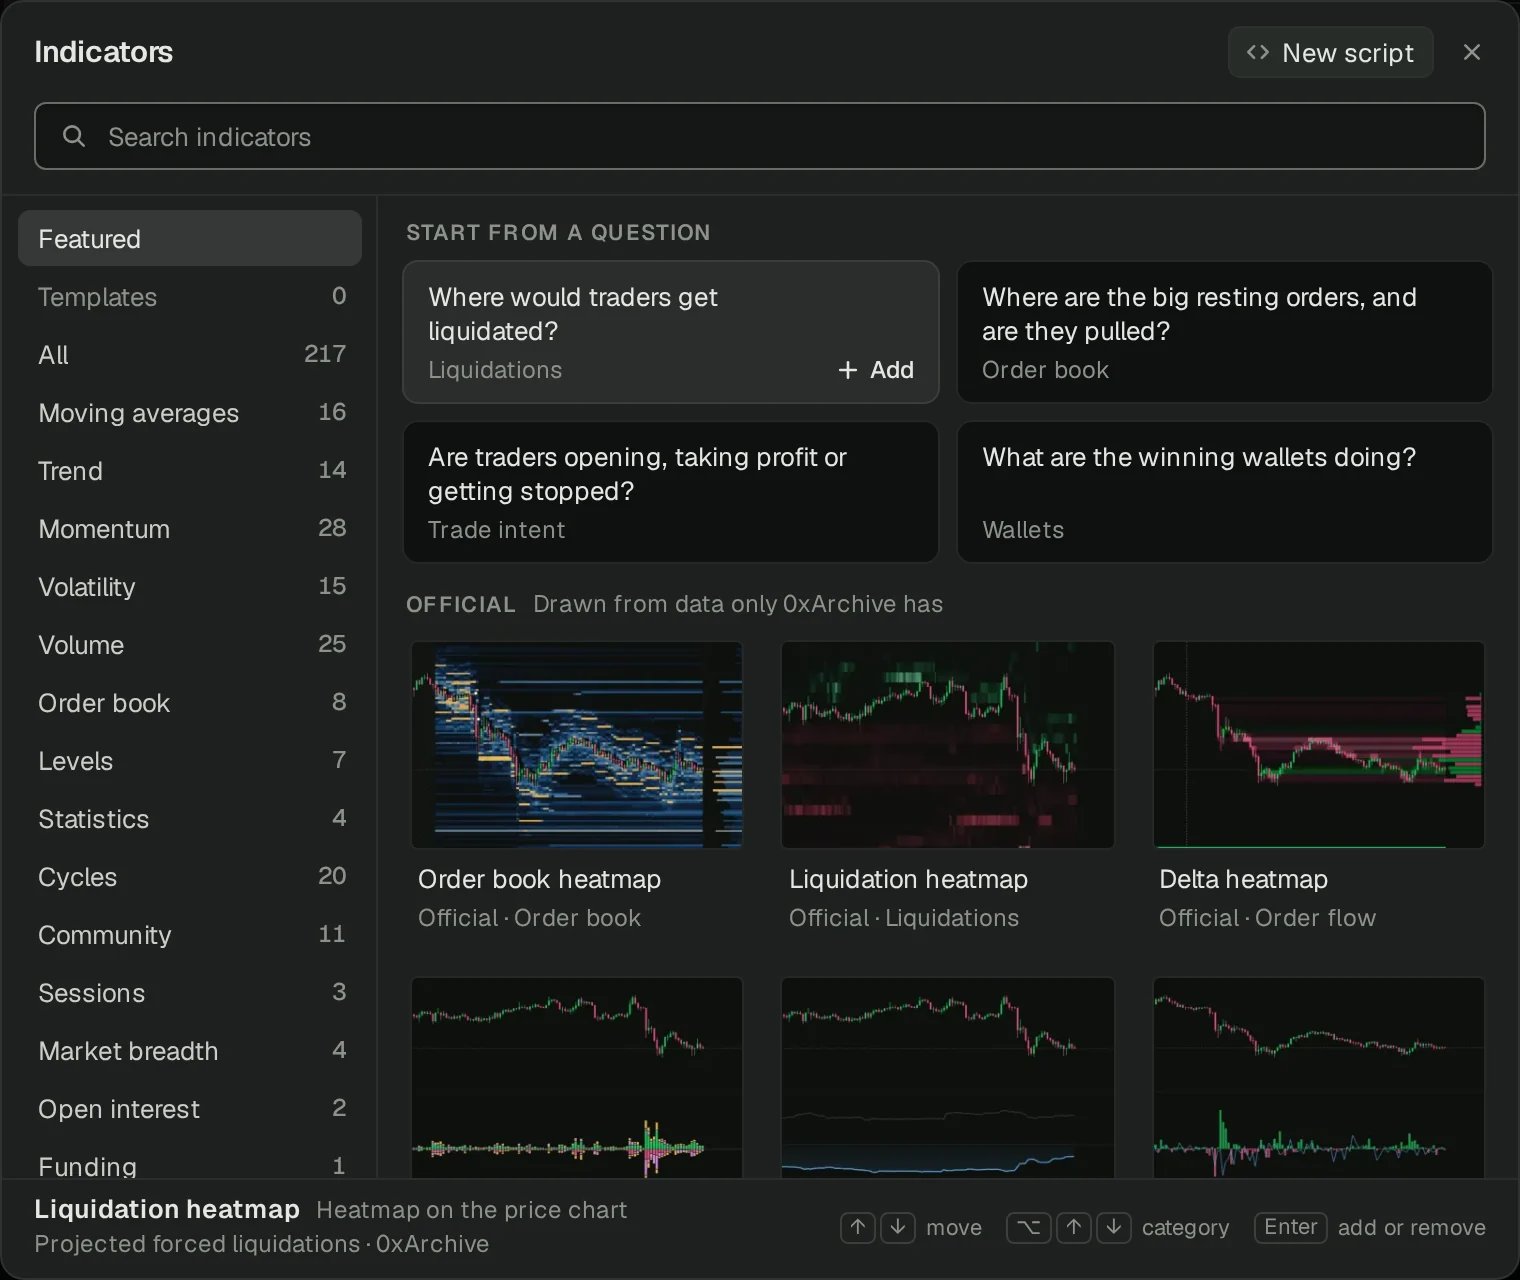
- Start from a question: “Where would traders get liquidated?” or “Are traders opening, taking profit or getting stopped?” Each one adds the indicator that answers it.
- Official: drawn from data only 0xArchive keeps, like the order book heatmap, the liquidation heatmap and the delta heatmap.
- Everything else: 217 indicators, from moving averages to market breadth, sorted down the left.
5. Move around the chart
Drag to pan, scroll to zoom, and drag the price axis to stretch it. The rest is one key away:
Fit, the live bar and the image are also in the chart’s ⋯ menu, and the camera beside it copies or downloads the image.
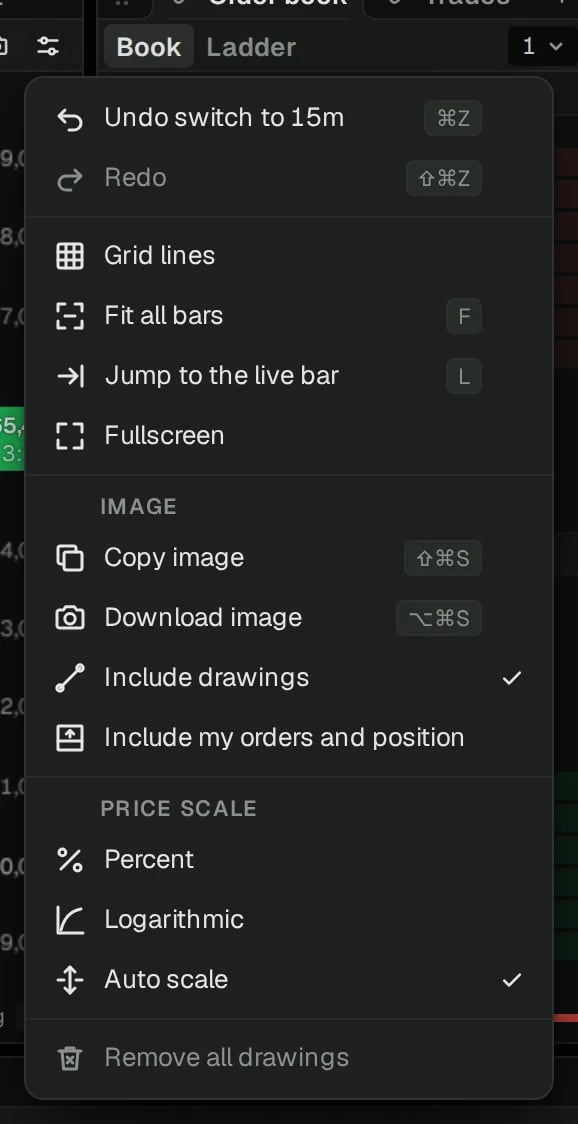
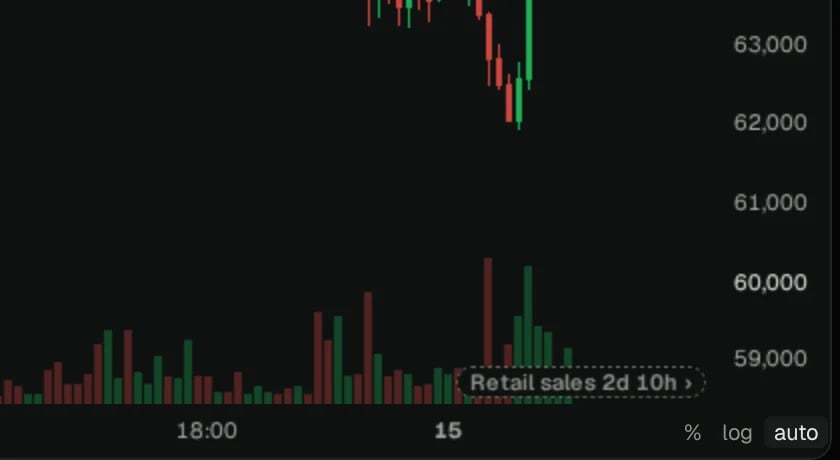
The chart's ⋯ menu: undo, grid, fit, live bar, fullscreen, images and the price scale.
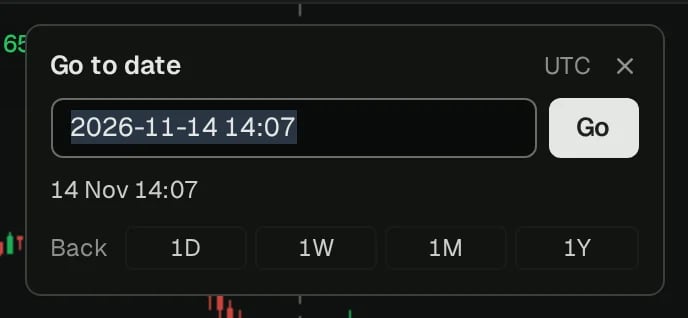
Go to date: type a date and time, or step back a day, week, month or year.
6. Keep it
The menu at the top left, named after the view you’re on, holds your views.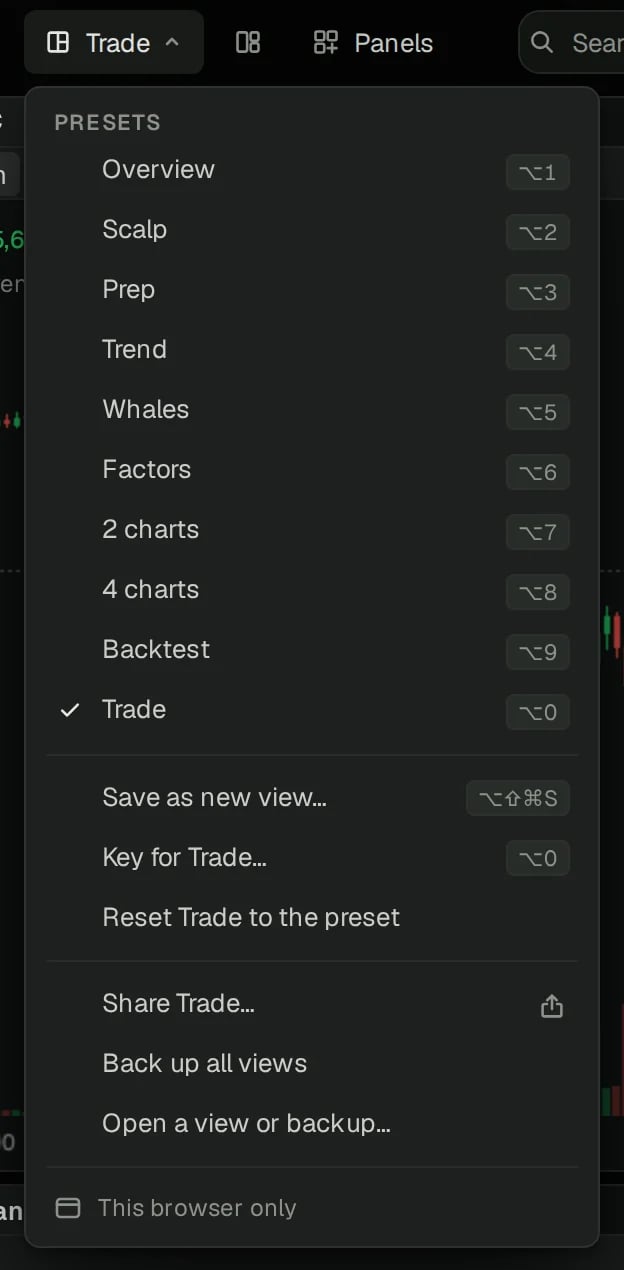
- Save as new view (⌥⇧⌘S) keeps the whole screen: markets, intervals, chart types, indicators and panels. Once it’s yours, ⌘S saves changes to it.
- Presets are views set up for a way of trading: Scalp, Prep, Trend, Whales, Factors and more. Each one is a good start to change and save as your own.
- Share saves a view for someone else to open, and Back up all views saves them all to one file.